Oscilator Predictor
- Indicators
-
Jean Charles Vilhena Maia
 BOTS AND INDICATORS DEVELOPER
ENJOY THE FREE TESTS - FOR A LIMITED TIME ONLY
xxxxxxxxxxxxxxxxxxxxxxxxxxxxxxxxxx
I ASK FOR YOUR HELP IF YOU NOTICE ANY BUGS.
I WOULD APPRECIATE IT IF YOU COULD LEAVE A POSITIVE REVIEW. - Version: 2.3
- Updated: 17 February 2026
DiNapoli Stochastic Predictor V2.02
The DiNapoli Stochastic Predictor is an advanced and optimized version of the classic Stochastic oscillator, based on the specific smoothing methods proposed by the legendary trader Joe DiNapoli. Unlike the standard Stochastic, which can be overly sensitive and "noisy," the DiNapoli version applies a double smoothing process that filters out market noise, providing much more reliable overbought and oversold signals.
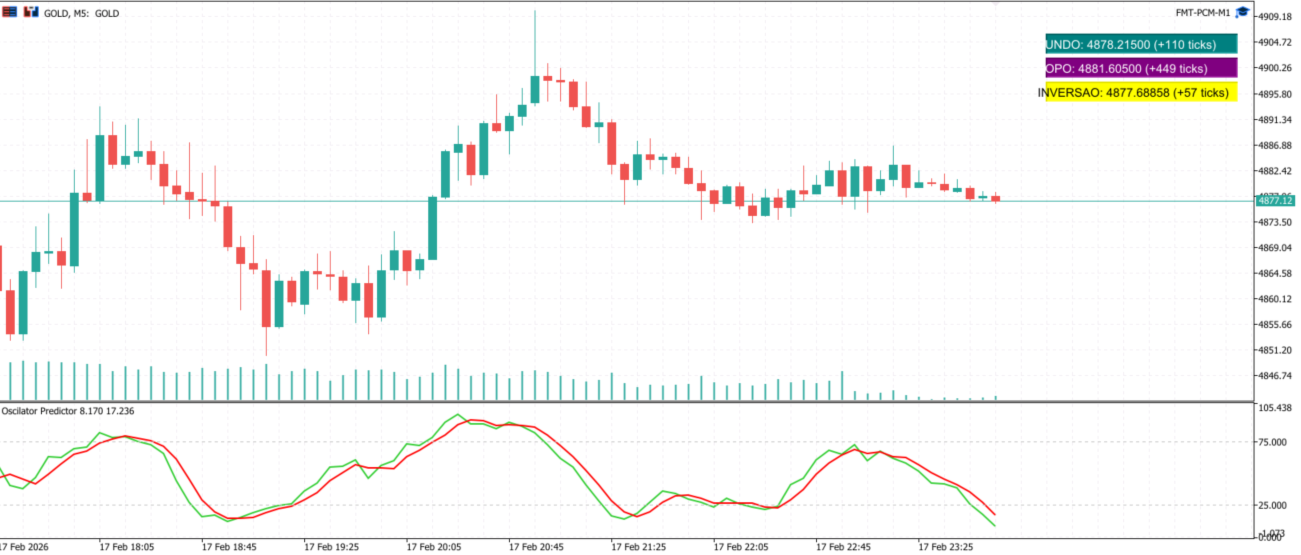
The standout feature of this tool is its Real-Time Predictive Panel. It projects directly onto the chart the exact price levels the asset needs to reach for the indicator to hit the 25 (Bottom) or 75 (Top) levels, or to trigger a crossover (Reversal). This allows you to anticipate market movements before they even happen.
Key Advantages
-
DiNapoli Smoothing: A superior calculation algorithm that reduces false signals in sideways markets.
-
Dynamic Target Panel: Visualize the exact price required for a trend change or entry signal.
-
Real-Time Tick Calculation: The panel shows the distance (in ticks/points) between the current price and the indicator's targets.
-
Visual Alerts: The panel automatically changes color (Yellow) when the price approaches a critical level, alerting you to an imminent execution.
-
Clean Interface: Pre-configured levels of 25 and 75 according to Joe DiNapoli's original methodology.
Input Parameters (Settings)
-
InpKPeriod (8): The main calculation period for the %K line.
-
InpSlow1 (3): The first smoothing period (essential for the signature DiNapoli smoothness).
-
InpSlow2 (3): The second smoothing period for the %D line (signal).
Information Panel (Labels)
-
BOTTOM (25.0): Indicates the exact price the asset must touch for the indicator to reach the oversold zone (Buy zone).
-
TOP (75.0): Indicates the exact price for the indicator to reach the overbought zone (Sell zone).
-
REVERSAL: Indicates the break-even price where the K and D lines cross, signaling a potential trend reversal.
Usage Recommendations
-
Strategy: Use it to identify trend exhaustion or to enter on pullbacks within a larger trend.
-
Confluence: Works extremely well when combined with DiNapoli Displaced Moving Averages or Fibonacci levels.
-
Timeframes: Recommended for all timeframes, with excellent performance on M15, H1, and Daily charts.
-
Assets: Ideal for Forex (Majors), Indices, and Commodities (XAUUSD).
Technical Note: This indicator was developed with high-performance code, ensuring that the predictive calculation and visual panel do not slow down the MT5 platform, even on high-volatility assets.