Fisher Transform MTF

 Indicator Overview

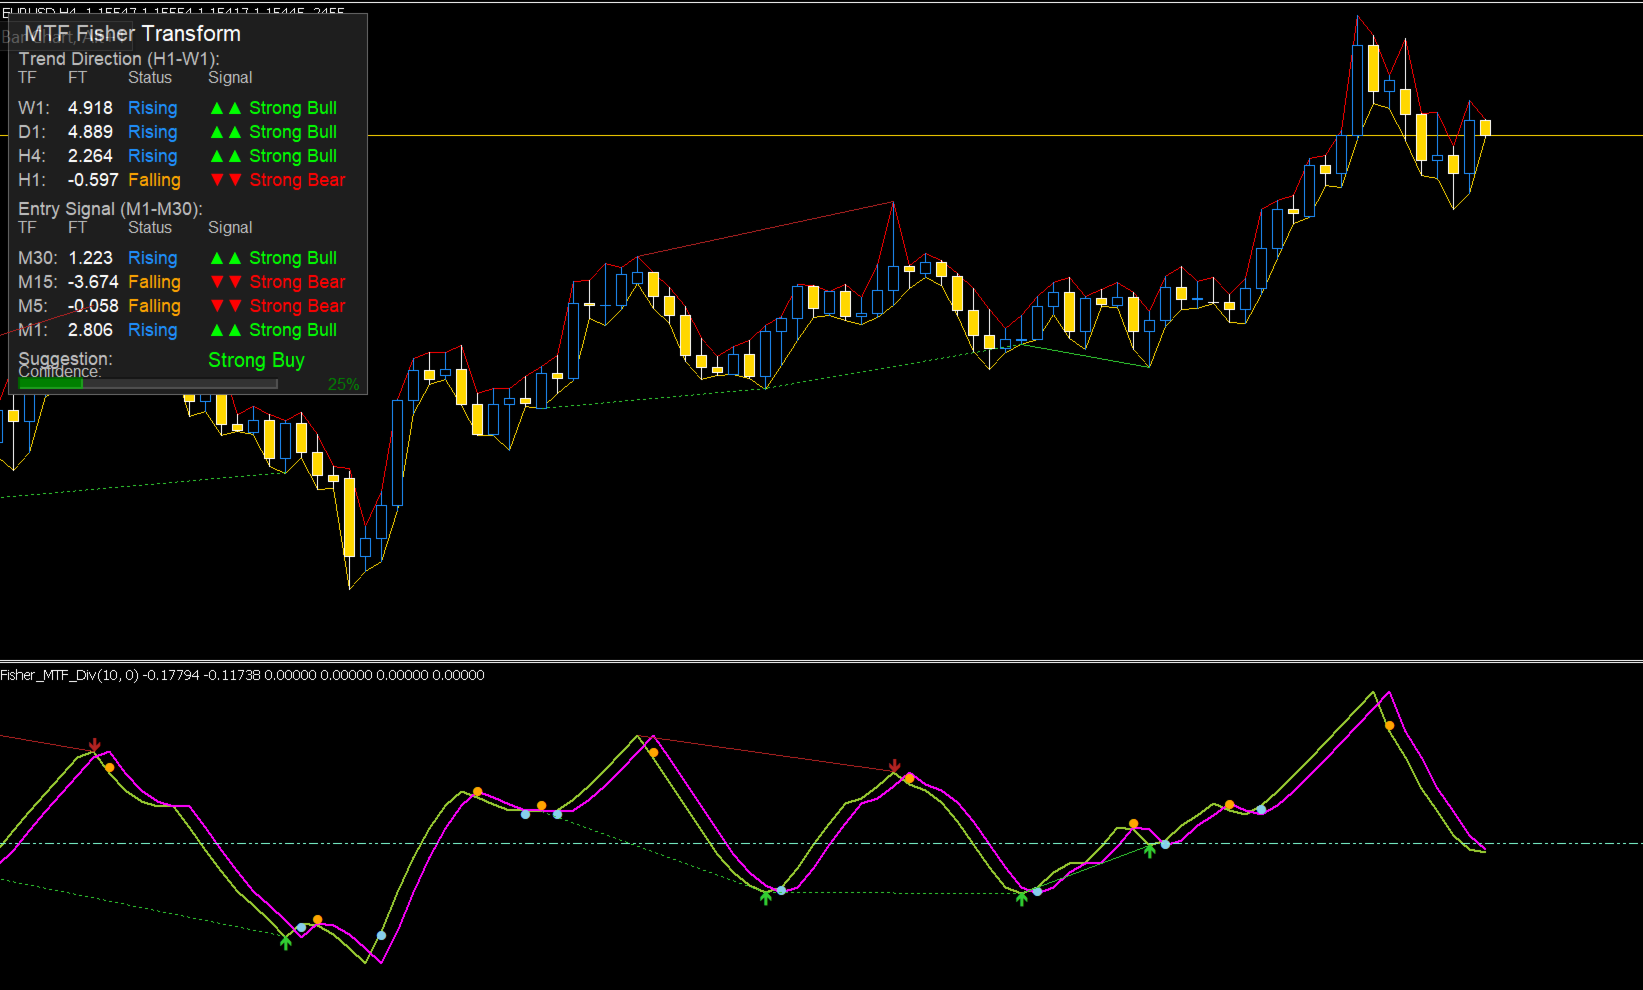
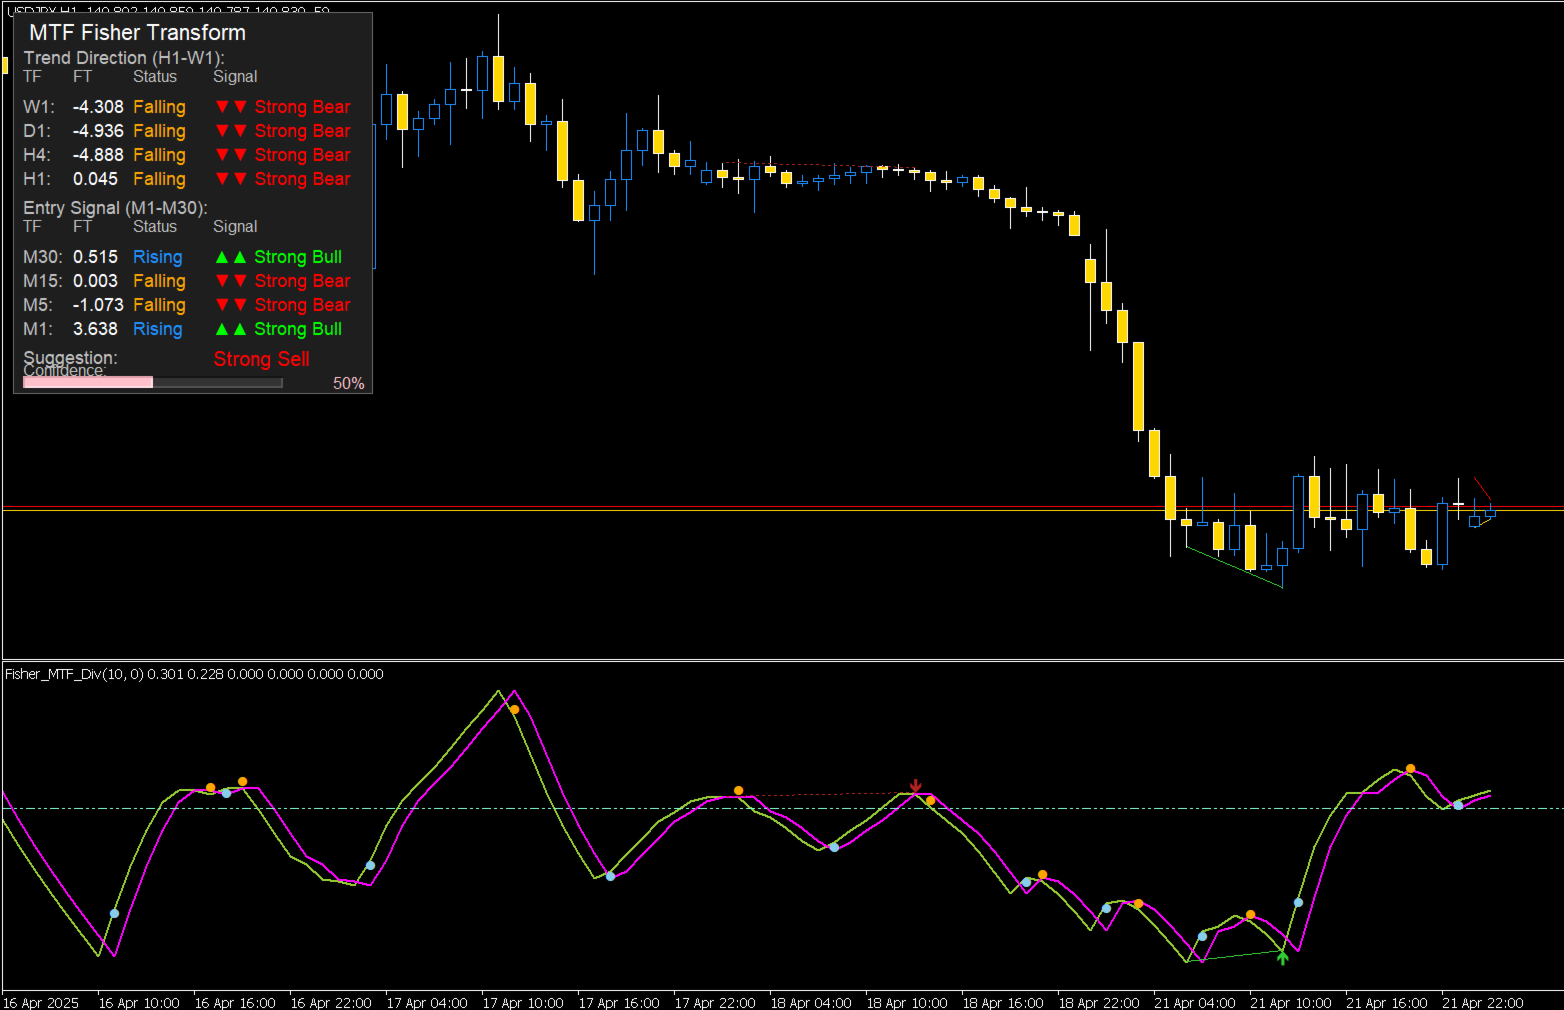
This is a sophisticated Multi-Timeframe (MTF) indicator that not only applies the classic Fisher Transform formula but integrates it into a comprehensive trading system featuring a real-time dashboard. The indicator excels at pinpointing reversals through advanced divergence detection and providing a clear, multi-timeframe view of market structure.


 How It Works: Core Fisher Logic


1.  Normalization and Signal Generation

       The indicator transforms price (using median price (High+Low)/2) into a Gaussian distribution via the Fisher Transform formula: 0.5 log((1+value)/(1-value)) .

       This process sharpens turning points and produces two lines:

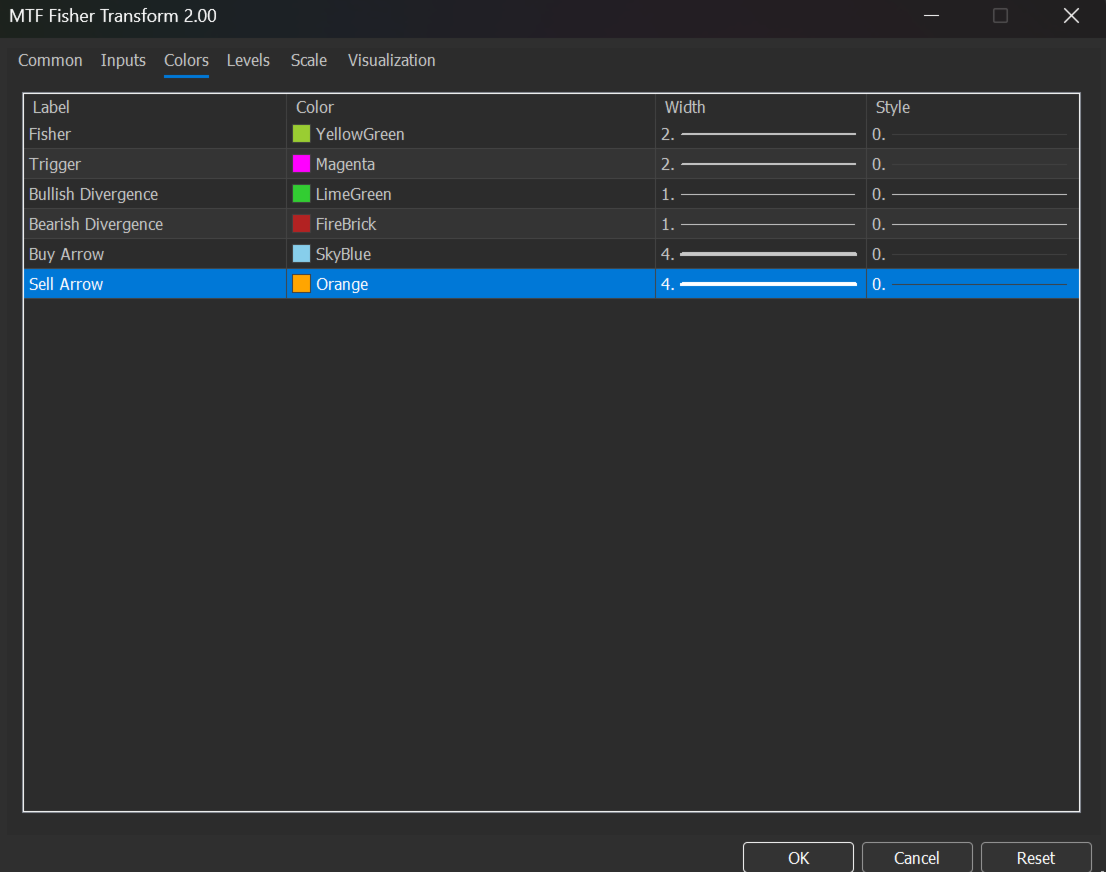
           Fisher Line (Yellow-Green): The main transformed oscillator.

           Trigger Line (Magenta): A 1-period lag of the Fisher Line (acts as a signal line).

       Crossovers between these lines generate basic buy/sell arrows in the indicator window.


2.  Key Fisher Interpretation

       Zero Line as Trend Filter: A powerful feature. When the Fisher Line is above 0, it indicates a bullish bias in the underlying price trend for that period. Conversely, a value below 0 indicates a bearish bias. This provides an instant, objective trend filter.

       Extreme Readings: Values near the upper/lower bounds suggest overbought/oversold conditions, but the Fisher is designed to spend more time at extremes during strong trends.


 The Advanced MTF Dashboard: Your Command Centre


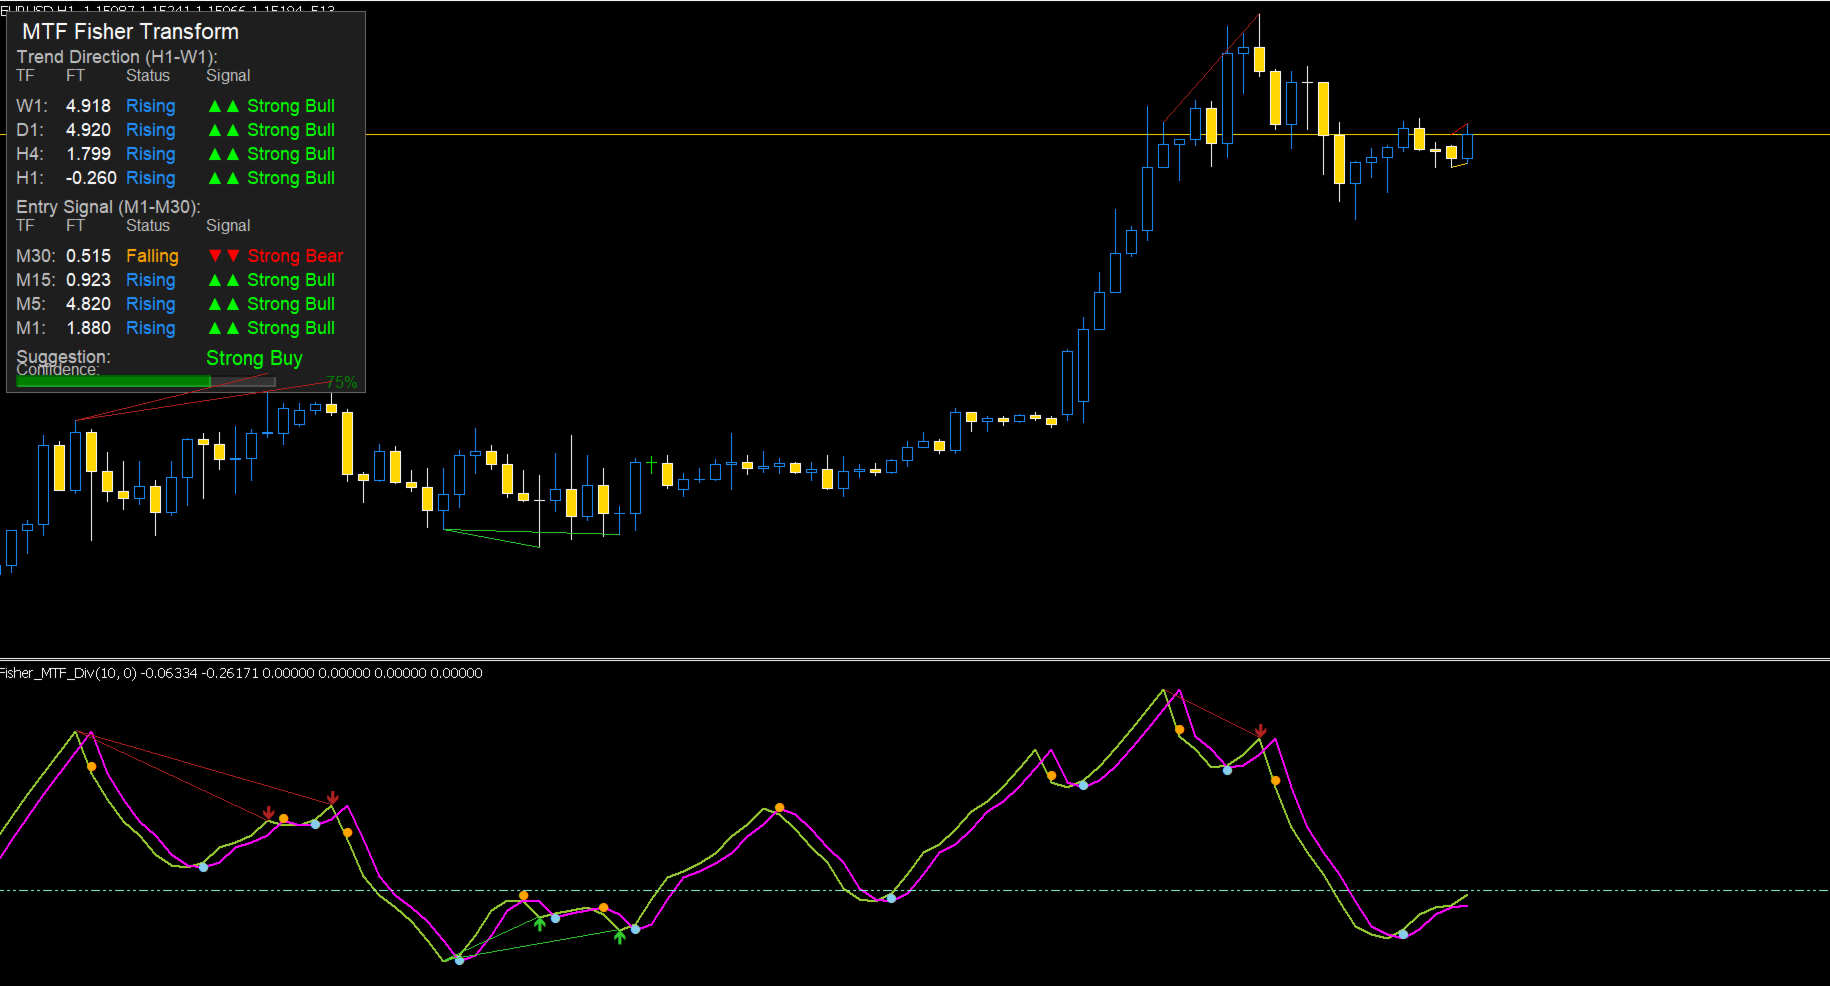
The true power lies in the on-chart panel, which aggregates Fisher analysis across 8 timeframes into an actionable overview.


1.  Four-Column Layout for Each Timeframe:

       TF: Timeframe (e.g., H1, M15).

       FT Value: The current numerical value of the Fisher Transform. This tells you instantly if the bias is bullish (>0) or bearish (<0) and how extreme the reading is.

       Status: A dynamic text label ("Rising", "Falling", or "Flat") based on the Fisher slope. Coloured Blue for Rising, Orange for Falling, and Grey for Flat. This shows the current momentum direction of the Fisher oscillator itself.

       Signal: The gradient-coloured directional assessment using proprietary slope thresholds.


2.  Gradient Signal Strength and Colours:

    The indicator doesn't just give a buy/sell signal; it classifies the strength of momentum into five distinct tiers using slope calculations:

       ▲▲ Strong Bull (LimeGreen): Slope is > 2x the positive threshold. Very strong bullish momentum.

       ▲ Bullish (Green): Slope is > the positive threshold. Standard bullish momentum.

       ● Neutral (Grey): Slope is within the neutral band. No strong directional bias.

       ▼ Bearish (Pink): Slope is < the negative threshold. Standard bearish momentum.

       ▼▼ Strong Bear (Red): Slope is < 2x the negative threshold. Very strong bearish momentum.

       The sensitivity threshold adapts per timeframe (more sensitive on lower TFs like M1).


3.  Aggregated "Suggestion" and Confidence Meter:

       The panel synthesizes all 8 timeframe signals into one clear Suggestion (e.g., "Strong Buy", "Neutral", "Sell").

       The Confidence Meter (a coloured bar) and percentage score (0-100%) show how strongly the timeframes agree. A high score with a "Strong Buy" suggestion indicates a high-probability, aligned opportunity.


 Highlighted Benefit: Superior Divergence Detection


The logic for spotting divergences between price action and the Fisher line is exceptionally well-tuned:

   Detects both Classical and Reverse/Hidden divergences.

   Plots clear arrows on the indicator and optional trend lines on both the price chart and indicator window for visual confirmation.

   Can generate alerts, ensuring you never miss a potential reversal signal.


 Key Benefits for the Trader


   Comprehensive Trend Analysis: Combines the Fisher value (>/< 0) for bias, the Status (Rising/Falling) for momentum, and the gradient Signal Strength for conviction, all in one view.

   Informed Decision-Making: The MTF panel answers critical questions: Is the trend bullish on the higher TFs? Is the momentum strengthening on the lower TFs for an entry? Is there a divergence forming?

   Objective and Visual: Removes guesswork. The color-coded dashboard provides an immediate, objective snapshot of market structure across all relevant timeframes.

   High-Probability Alerts: The divergence signals, especially when combined with a supportive MTF dashboard reading, are among the most reliable early reversal indicators available.


 Who It’s For

This tool is ideal for:

   Swing and Position Traders using the W1/H4 trend direction to filter trades.

   Day Traders using the M15/M5 signals for entries, aligned with the H1 bias.

   All Traders who rely on divergence as a core strategy component and want to avoid false signals by checking multi-timeframe alignment.


In summary, this isn't just a Fisher Transform indicator, it's a complete multi-timeframe momentum and divergence trading system that quantifies trend bias, momentum direction, and signal strength into a single, intuitive dashboard.
Recommended products
Money Flow Profile MT4  HERE   Use Guide Here our more valuable tools SMC Trend Trading   ,  Easy SMC Trading  ,  Institutional SMC Architect Volume Analysis Tools  ,  Volume flow Profile  ,  Market volume profile  , FVG with Volume  , Liquidity Heatmap Profile  ,  Volume Spread Analysis  Master Edition is a professional-grade analytical tool designed to visualize market structure through the lens of volume and money flow. Unlike standard volume indicators, this tool displays a Daily Vo
Structure King AI Signal Structure King AI Signal is a professional MetaTrader 5 trading indicator designed to help traders analyze market structure, trend direction, multi-timeframe confirmation and trade management from one clean dashboard. Key Features • Market Structure & Trend Analysis • BUY / SELL Signals • Multi-Timeframe (HTF) Confirmation • Entry Price Levels • Dynamic Stop Loss (SL) • TP1 / TP2 / TP3 Levels • ATR Volatility Analysis • ADX Trend Strength Filter • Adaptive Market Filter

Was: $249  Now: $99   Market Profile defines a number of day types that can help the trader to determine market behaviour. A key feature is the Value Area, representing the range of price action where 70% of trading took place. Understanding the Value Area can give traders valuable insight into market direction and establish the higher odds trade. It is an excellent addition to any system you may be using. Inspired by Jim Dalton’s book “Mind Over Markets”, this indicator is designed to suit the
Volume Profile Multiple — Multi-Block Volume Profiles with Buffers for Algorithmic Trading Tired of drawing Volume Profile block by block, redrawing and recalculating every time you change timeframe? Volume Profile Multiple automatically plots several consecutive volume profiles on the chart, revealing where institutional interest actually sat in each segment of the market — not just in the last visible range. What it does for you The indicator splits the price history into blocks of N candles e
Passband Filter Pro Passband Filter Pro is a trend and cycle oscillator for MetaTrader 5. It is built on the Ehlers Super Passband Filter, a band pass filter that removes long term trend drift and short term noise so that only the dominant market cycle remains. The result is a clean oscillator with a color cloud that shows overbought and oversold conditions, cycle turns, and momentum on forex, gold, indices, stocks and crypto. Most traders enter too early or too late. Simple moving averages la
WBS SMC Without Repaint – Ultimate XAUUSD Scalping Engine (M5 Timeframe) Take your Gold trading to the institutional level with "WBS SMC Without Repaint", a highly advanced premium indicator engineered specifically for XAUUSD (Gold) on the M5 (5-Minute) timeframe.  Built upon the core pillars of Smart Money Concepts (SMC) combined with precise algorithmic candle pattern recognition, this tool identifies high-probability institutional footprints in real-time. Best of all: 100% ABSOLUTELY
RBreaker
Zhong Long Wu
RBreaker Gold Indicators is a short-term intraday trading strategy for gold futures that combines trend following and intraday reversal approaches. It not only captures profits during trending markets but also enables timely profit-taking and counter-trend trading during market reversals. This strategy has been ranked among the top ten most profitable trading strategies by the American magazine   Futures Truth   for 15 consecutive years. It boasts a long lifecycle and remains widely used and st
HMA Trend Professional MT5
Pavel Zamoshnikov
4.25 (4)
Improved version of the free HMA Trend indicator (for MetaTrader 4) with statistical analysis. HMA Trend is a trend indicator based on the Hull Moving Average (HMA) with two periods. HMA with a slow period identifies the trend, while HMA with a fast period determines the short-term movements and signals in the trend direction. The main differences from the free version: Ability to predict the probability of a trend reversal using analysis of history data. Plotting statistical charts for analyzi
Trend Master V2
Oratile Pitsoane
What Is Trend Master Pro? Trend Master Pro   is a professional-grade trend trading indicator built for MetaTrader 5. It was designed with one goal in mind — to keep you on the right side of the market at all times by combining three powerful technical tools into a single, clean, easy-to-read display directly on your price chart. Instead of cluttering your screen with multiple separate indicators, Trend Master Pro fuses an   EMA Ribbon trend filter , a   ZigZag swing point engine , and a   breako
C88 Projected Candle See the Bigger Picture Before the Candle Closes C88 Projected Candle is a professional market visualization indicator that projects the current higher timeframe candle directly onto your active chart. It helps traders understand the evolving market structure without constantly switching between timeframes. Whether you trade Price Action, ICT, Smart Money Concepts (SMC), or Volume Profile, this indicator provides a cleaner and more intuitive way to read market context. Key Fe
DAILY OH/OL SDEV QUANT MODEL - STATISTICAL TRADING WITH PRECISION RISK MANAGEMENT TRADE WITH MATHEMATICAL CERTAINTY - KNOW YOUR EXACT STOP-LOSS AND TAKE-PROFIT BEFORE YOU ENTER This indicator analyzes 5,000+ days of price history to give you: Exact entry levels (sigma bands locked at daily open) Exact stop-loss distance (from M
"Impulses and Corrections 5" is created to help traders navigate the market situation. The indicator shows multi-time frame upward and downward "Impulses" of price movements. These impulses are the basis for determining the "Base" , which is composed of zones of corrections of price movements, as well as "Potential" zones for possible scenarios of price movement. Up and down impulses are determined based on a modified formula of Bill Williams' "Fractals" indicator. The last impulse is always "U
Fabii Half Trend Baseline
Fabien Georges Andre Guillemaud
Stop trading against the higher timeframe trend. Two baselines, one chart. No repaint. Any pair, any timeframe. On your chart in 2 minutes. Free demo in the Strategy Tester. Get more indicators here Baselines, volatility filters and oscillators. No repaint. Why you need it You enter a trade because a line turned green on your chart. Then you open a higher timeframe and see that the bigger trend points the other way. The signal was real. The trend behind it was not on your side. Every trade ta
STRICTLY FOR BOOM INDEX ONLY!!!!! Here I bring the Maximum Trend Arrows OT1.0 MT5 indicator. This indicator is made up of a combination of different trend indicators for entries and exits, for entries an orange arrow will paint on the chart below the current market and a red flag for closing of trades and it produces buy arrows only. When the orange arrow appears, it will appear along with it's sound to notify you. The 1H timeframe is recommended, don't use it anywhere else than on the 1H timefr
Delta Profile Volume
Teresinha Moraes Correia
Technical Description of the Indicator – Delta Profile for MetaTrader 5 The Delta Profile is an indicator developed for MetaTrader 5 focused on detailed analysis of volume flow within a defined range of candles. It organizes and displays information about the imbalance of positive volumes (associated with upward movements) and negative volumes (associated with downward movements) at different price levels. The result is a clear view of the chart points where the highest concentration of trades o
Binary Rise Fall
Israr Hussain Shah
Here   our more valuable tools SMC Trend Trading   ,  Easy SMC Trading  ,  Institutional SMC Architect Volume Analysis Tools  ,  Volume flow Profile  ,  Market volume profile  , FVG with Volume  , Liquidity Heatmap Profile  ,  Volume Spread Analysis The Fractals_Price indicator is a technical analysis tool that identifies fractal patterns on price charts. Fractals are recurring patterns that signal potential trend reversals or continuation points. This indicator marks both upward and downward
SMC Smart Flow Pro
Thitipong Nookhunthod
Short Description: SMC Smart Flow Pro is an advanced Smart Money Concept indicator that automatically detects Break of Structure (BOS), Change of Character (CHoCH), and projects precise TP/SL target levels on all timeframes — built for serious traders who trade with institutional flow. Full Description: SMC Smart Flow Pro is a premium Smart Money Concept (SMC) indicator for MetaTrader 5, engineered for traders who want to trade alongside institutional order flow. By automatically mapping m
Your Trend Friend
Luigi Nunes Labigalini
5 (1)
The trend is your friend! Look at the color of the indicator and trade on that direction. It does not  repaint. After each candle is closed, that's the color of the trend. You can focus on shorter faster trends or major trends, just test what's most suitable for the symbol and timeframe you trade. Simply change the "Length" parameter and the indicator will automatically adapt. You can also change the color, thickness and style of the lines. Download and give it a try! There are big movements w
Cycle Projection Pro is a cyclical analysis indicator for MetaTrader 5, designed for the Daily timeframe. It identifies and projects recurring price cycles forward in time, helping you estimate when — not how much — the market may be approaching a turning point. How it works The indicator sums six harmonic cycles with explicit periods — Weekly, Biweekly, Monthly, Quarterly, Semiannual, Annual — each independently adjustable and can be turned on or off. Their combination produces a composite wav
Here   our more valuable tools SMC Trend Trading   ,  Easy SMC Trading  ,  Institutional SMC Architect Volume Analysis Tools  ,  Volume flow Profile  ,  Market volume profile  , FVG with Volume  , Liquidity Heatmap Profile  ,  Volume Spread Analysis The    Liquidity Heatmap   is a sophisticated institutional trading tool designed to reveal where over-leveraged traders are trapped. By calculating estimated liquidation levels based on volume spikes and leverage, this indicator draws a dynamic "h
Max Min Delta Indicator - Market Volume Imbalance Analysis Gain Deeper Insights into Market Volume Imbalance with Delta Analysis What is the Max Min Delta Indicator? The Max Min Delta Indicator is a powerful market volume analysis tool that visually represents maximum and minimum delta values using a histogram. It helps traders identify market strength, weakness, absorption, and aggressive buying/selling activity with precision. Key Features Histogram Visualization: Displays Max Delta (Green) an
Advanced Volume Profile Analysis Tool for MetaTrader 5 The Kecia Volume Profile Order Finder provides traders with volume profile analysis capabilities. This MT5 indicator combines volume profile visualization with statistical calculations to help identify potential trading opportunities and suggests entry, stop loss, and take profit levels based on market structure. Market Profile Visualization Transform your chart with customizable volume profile visualizations: Multiple visualization options
Noize Absorption Index - is the manual trading system that measures the difference of pressure between bears forces and bulls forces. Green line - is a noize free index that showing curent situation. Zero value of index shows totally choppy/flat market.Values above zero level shows how powerfull bullish wave is and values below zero measures bearish forces.Up arrow appears on bearish market when it's ready to reverse, dn arrow appears on weak bullish market, as a result of reverse expectation.
Onnyx Indicator is a non-repainting supply and demand analysis indicator for MetaTrader 5. It identifies confirmed swing-based zones, scores their quality, and displays clear BUY and SELL signals directly on the chart. MAIN FEATURES • Supply and demand zones based on confirmed price swings • ATR-adaptive zone width for changing market volatility • Zone quality displayed as a percentage inside each zone • Clear BUY and SELL arrows with enlarged signal markers • Closed-candle signal logic designed
JTC Smart Gold Indicator is a professional trading indicator designed exclusively for the XAUUSD (Gold) 5-minute timeframe on MetaTrader 5. It focuses on identifying high-quality trading opportunities during the New York session while helping traders maintain a disciplined and structured trading approach. Unlike indicators that generate excessive signals, JTC is designed to prioritise quality over quantity, typically highlighting a small number of carefully selected opportunities during active
VELOS Trading Indicator Precision. Speed. Confidence. The VELOS Trading Indicator is a professional, non-repainting MT5 trading system developed by DC Trading to help traders identify high-probability trading opportunities with confidence. Designed for both beginner and experienced traders, VELOS combines trend analysis, momentum confirmation, and volatility filtering into one intelligent indicator, delivering precise entry and exit signals while reducing false setups. Built for fast-moving m
Smart Support And Resistance Indicator See the Market Levels That Matter. Make your chart clearer and your technical analysis more organized with Smart Support And Resistance Indicator — a powerful trading tool designed to help traders identify important support and resistance levels directly on their MetaTrader 5 charts. Whether you trade Forex, Gold, Indices, or other available markets, this indicator helps you focus on key price areas, monitor potential market reactions, and analyze price act
Ultimate Boom and Crash Indicator The Ultimate Boom and Crash Indicator is a cutting-edge tool developed by  Coetsee Digital , designed to identify potential spike opportunities in the market. Crafted for traders focusing on Deriv and Weltrade synthetic markets, this indicator is optimized to operate exclusively on the 3-minute (M3), 5-minute (M5), 15-minute (M15), 30-minute (M30), and 1-hour (H1) timeframes and supports only the following pairs: PainX 1200, PainX 999, PainX 800, PainX 600, Pai
What if you could finally SEE where the market really wants to go? Most traders watch price. Pros watch VOLUME — where the money was actually traded. Volume Profile Fibo Confluence puts that reading right in front of you, in plain language, no jargon. WHAT YOU SEE ON YOUR CHART • The POC, the most-traded price: the market's natural magnet • The value area (VAH / VAL): the "house" where price spends its time • Automatic Fibonacci retracement + the golden pocket • Low-volume nodes
MercariaPattern1-2-3 відстежує рух ціни, знаходить трьоххвильові структури 1-2-3 та підсвічує момент, коли сценарій підтверджується пробоєм ключового рівня. MercariaPattern1-2-3 tracks price movement, detects three-leg 1-2-3 structures and highlights the moment when the scenario is confirmed by a key level breakout. Індикатор збирає локальні свінги в компактну фігуру 0–1–2–3 , чекає підтвердженого пробою та будує стрілку входу з готовими рівнями SL/TP. The indicator combines local swings into a
Buyers of this product also purchase
Trend Sniper X
Sarvarbek Abduvoxobov
4.86 (42)
Trend Sniper X is a multi-timeframe trend-following indicator for MetaTrader 5 that helps traders identify trend direction and potential reversal points with clarity and precision. for MT4: https://www.mql5.com/en/market/product/193245 Price Information: The current price is promotional and is subject to change as upcoming updates and new features are released. Bonus Offer: To get the FREE Auto-Trade Assistant EA for this indicator, please message the author after purchasing. Code2Profit Channe
Smart Trend Trading System — MetaTrader 5 Message me on MQL5 after purchase to receive Smart Universal Expert Advisor for FREE, plus the online course, PDF manual, and private group access. STTS brings trend direction, entry and exit signals, reversal zones, and important price levels together on your chart. Follow the system manually, or connect a separate compatible EA for automated execution using your chosen settings. ONE SYSTEM. FOUR TRADING APPROACHES. STTS organizes its trading approaches
SuperScalp Pro
Van Minh Nguyen
4.54 (37)
SuperScalp Pro - Professional Multi-Layer Confluence Scalping System SuperScalp Pro is an advanced scalping indicator that upgrades the classic Supertrend with multiple intelligent confirmation filters. It helps you identify higher-probability Buy/Sell opportunities while significantly reducing false signals. Clear Buy and Sell arrows appear directly on the chart, along with automatic ATR-based Stop Loss and Take Profit levels calculated in real time. Current price is a promotional offer. The pr
Auto Optimized SpeedAngle is an institutional-grade momentum vectoring system that eliminates curve-fitting through continuous Walk-Forward Optimization (WFO). Rather than relying on static inputs that degrade when market regimes shift, the indicator dynamically recalibrates its parameters using Out-of-Sample (OOS) validation, ensuring the displayed signals represent genuine statistical edges rather than historical anomalies. By shifting the focus from subjective visual angles to normalized, qua
Boba Analysis Suite
Trade Ready Solutions LLC
5 (1)
Boba Analysis Suite Boba Analysis Suite is an analytical indicator for MetaTrader 5. It brings market structure, relevant price zones and broader market context together in a single chart view. Developed through practical experience as a trader and trading coach, it supports a structured analysis process: assessing market direction, identifying important levels and considering multiple timeframes together. Analysis in Context Individual signals gain meaning through context. Boba Analysis Suite h
Entry Points Pro 10 — the legend of the MQL5 Market. Three years in the Market's Top-3. 595 reviews across two versions. Over 31,000 demo downloads. Thousands of traders open their charts with it every morning. Built and traded by an author who has been in the market since 1999. Version 10 is the biggest rebuild in the indicator's history: I read every review from five years — and built the answers into the code. WHAT IT DOES It shows the entry point in advance — strictly without repainting. The
Adaptive Price Action Engine Buy Indicator- Get EA Based on it for FREE. Self-Optimizing Multi-Timeframe Trend & Candlestick Intelligence Markets do not behave the same way all the time—and not every price-action pattern has the same value in every market regime. Adaptive Price Action Engine is designed to adapt to changing market conditions by combining trend structure, multi-timeframe analysis, candlestick patterns, and statistical optimization into one analytical framework. Two Adaptive Mode
ARIPoint
Temirlan Kdyrkhan
1 (4)
ARIPoint is a powerful trading companion designed to generate high-probability entry signals with dynamic TP/SL/DP levels based on volatility. Built-in performance tracking shows win/loss stats, PP1/PP2 hits, and success rates all updated live. Key Features: Buy/Sell signals with adaptive volatility bands Real-time TP/SL/DP levels based on ATR Built-in MA Filter with optional ATR/StdDev volatility Performance stats panel (Success, Profit/Loss, PP1/PP2) Alerts via popup, sound, push, or email Cu
Gann Made Easy   is a professional and easy to use Forex trading system which is based on the best principles of trading using the theory of W.D. Gann. The indicator provides accurate BUY and SELL signals including Stop Loss and Take Profit levels. You can trade even on the go using PUSH notifications. PLEASE CONTACT ME AFTER PURCHASE TO GET TRADING  INSTRUCTIONS   AND GREAT EXTRA INDICATORS  FOR FREE! Probably you already heard about the Gann trading methods before. Usually the Gann theory is a
M1 Sniper MT5
Oleg Rodin
5 (7)
M1 SNIPER  is an easy to use trading indicator system. It is an arrow indicator which is designed for M1 time frame. The indicator can be used as a standalone system for scalping on M1 time frame and it can be used as a part of your existing trading system. Though this trading system was designed specifically for short-term trading, it still can be helpful for all traders. This trading system can be used with any forex pair and time frame, though lower time frames are recommended from M1 up to M
FiboSniper Pro
Van Minh Nguyen
5 (4)
FiboSniper Pro - Multi-Filter Fibonacci System with Auto SL/TP and Control Panel FiboSniper Pro is a technical indicator that combines dynamic Fibonacci Envelopes with multiple confirmation filters to generate selective Buy and Sell signals. Fibonacci levels are calculated from Moving Average and ATR, then filtered by ADX, EMA, RSI, ATR, Volume, Time and Candle structure. The indicator displays automatic ATR-based Stop Loss and Take Profit levels directly on the chart, along with an interactive
Get Ready for Major New Features in Our Next Update — Version 2.52 Coming Soon! [NEW]  We’re taking market analysis to the next level with 4   new features designed to meet your trading needs. Introducing: TRADE OVERVIEW DASHBOARD  CONFLUENCE AT ZONE  OTE   Strong & Weak High/Low  1. TRADE OVERVIEW DASHBOARD A dashboard that helps you see the overall market picture more easily, with key information from multiple timeframes and trading guidance to support your trading decisions, helping you an
Apex Patterns PRO Buy Indicator - Get Expert Advisor Based on it for FREE. Self-Optimizing Chart Pattern & Breakout Intelligence Traditional pattern scanners rely on fixed inputs, often underperforming when market volatility and structures shift. Apex Patterns PRO is designed to adapt to changing market conditions by combining structural chart pattern recognition, momentum filtering, and statistical self-optimization into one analytical framework. Adaptive Scanning Engine Self-Optimizing Patter
Neuro Poseidon MT5
Daria Rezueva
4.75 (52)
Neuro Poseidon is a new indicator by Daria Rezueva. It combines precise trading signals with adaptive TP/SL levels - creating best possible trades as a result! Message me and get  Neuro Poseidon Assistant  as a gift to automize your trading process! What makes it stand out? 1. Proven profitability on all assets and timeframes 2. Only confirmed BUY and SELL signals present on the chart 3. Adaptive TP & SL levels generated by the software for each trade 4. Easy to understand - suitable for al
Unix Scalper
Issam Kassas
4 (4)
Unix Scalper — MetaTrader 5 Message me on MQL5 after purchase to receive Smart Universal Expert Advisor for FREE, plus the online course, PDF manual, and private group access. Find the setup. See the plan. Choose how to trade it. UNIX Scalper brings market analysis, BUY/SELL/WAIT decisions and Entry, Stop Loss, TP1 and TP2 levels into one organized panel. SEE THE SIGNAL AND THE PLAN • Clear decisions: BUY, SELL or WAIT. • Defined levels: Entry, Stop Loss, TP1 and TP2. • Multi-timeframe overvie
Advanced Supply Demand MT5
Bernhard Schweigert
4.53 (15)
Best Solution for any Newbie or Expert Trader! This indicator is a unique, high quality and affordable trading tool because we have incorporated a number of proprietary features and a new formula. With this update, you will be able to show double timeframe zones. You will not only be able to show a higher TF but to show both, the chart TF, PLUS the higher TF: SHOWING NESTED ZONES. All Supply Demand traders will love it. :) Important Information Revealed Maximize the potential of Advanced Supply
FX Trend MT5 NG
Daniel Stein
5 (6)
FX Trend NG: The Next Generation Multi-Market Trend Intelligence Overview FX Trend NG is a professional multi-timeframe trend and market monitoring tool designed to give you a complete structural overview of the market in seconds. Instead of switching between dozens of charts, you instantly see which symbols are trending, where momentum is fading, and where strong alignment exists across timeframes. This tool is part of the Stein Investments ecosystem - 18+ tools plus Max, your 1-on-1 AI tradi
Introducing   Quantum Breakout PRO , the groundbreaking MQL5 Indicator that's transforming the way you trade Breakout Zones! Developed by a team of experienced traders with trading experience of over 13 years,   Quantum Breakout PRO   is designed to propel your trading journey to new heights with its innovative and dynamic breakout zone strategy. Quantum Breakout Indicator will give you signal arrows on breakout zones with 5 profit target zones and stop loss suggestion based on the breakout b
Scalper Vault is a powerful, fully-equipped trading system designed for traders who want to achieve consistency in intraday trading . This high-precision indicator serves as a complete, standalone trading system that delivers institutional-grade analysis for both Forex and Binary Options traders. PLEASE CONTACT ME AFTER PURCHASE TO GET MY TRADING TIPS PLUS A GREAT BONUS! By eliminating the guesswork and complex manual analysis, Scalper Vault allows you to focus purely on execution using easy to
Volatility Master for MetaTrader is a real-time dashboard tool that scans up to  50 symbols  to identify high-volatility , trending markets instantly. With bullish/bearish signals, customizable alerts, and a user-friendly interface, it helps you avoid range-bound conditions and focus on high-probability trades. Clarity leads to confidence. Trade confidently and protect your capital effectively with this powerful dashboard. We don't offer free or bonus indicators in exchange of reviews from you.
SR Liquidity   is a trading indicator designed to reveal the hidden zones where market liquidity concentrates and price reacts most strongly. These special liquidity areas act as powerful support and resistance levels, giving you a clear map of where the market is most likely to reverse. Instead of drawing ordinary Support/Resistance lines, SR Liquidity analyzes real price behavior to detect the zones where buying and selling pressure accumulate. These are actually the pools of liquidity that dr
Power Candles MT5
Daniel Stein
4.58 (12)
Power Candles - Self-Optimizing Strength Indicator Strength usually lives in a sub-window. The line runs below, the candle above, and your eye keeps connecting the two. Power Candles puts the strength into the candle itself, colored from dark red to dark green, so the chart reads at a glance and the sub-window stays closed. The indicator also finds its own settings for the symbol and timeframe in front of you. One click on [ Apply Best ] draws entry, Stop Loss and Take Profit at the exact prices
Btmm state engine pro
Garry James Goodchild
5 (4)
BTMM State Engine Pro by G-Labs — Beat The Market Maker indicator for MetaTrader 5. Asian session range, London and New York kill zones, level progression (L1/L2/L3), peak formation detection (PFH/PFL), entry signals, and a multi-pair scanner from one chart. Stop scanning charts one pair at a time. The State Engine tracks the BTMM daily cycle automatically — Asian box, room boundaries, level blocks, peak formations, and filtered entries — while the scanner dashboard shows level, peak status, d
Matreshka
Dimitr Trifonov
5 (2)
Matreshka self-testing and self-optimizing indicator: 1. Is an interpretation of the Elliott Wave Analysis Theory. 2. Based on the principle of the indicator type ZigZag, and the waves are based on the principle of interpretation of the theory of DeMark. 3. Filters waves in length and height. 4. Draws up to six levels of ZigZag at the same time, tracking waves of different orders. 5. Marks Pulsed and Recoil Waves. 6. Draws arrows to open positions 7. Draws three channels. 8. Notes support and re
Divergence Bomber
Ihor Otkydach
4.89 (94)
Each buyer of this indicator also receives the following for free: The custom utility "Bomber Utility", which automatically manages every trade, sets Stop Loss and Take Profit levels, and closes trades according to the rules of this strategy Set files for configuring the indicator for various assets Set files for configuring Bomber Utility in the following modes: "Minimum Risk", "Balanced Risk", and "Wait-and-See Strategy" A step-by-step video manual to help you quickly install, configure, and
Atomic Analyst MT5
Issam Kassas
4.48 (62)
Atomic Analyst — MetaTrader 5 Message me on MQL5 after purchase to receive Smart Universal Expert Advisor for FREE, plus the online course, PDF manual, and private group access. Atomic Analyst brings price action, trend direction, entry and exit signals, Stop Loss and multiple Take Profit levels together on your chart. SEE THE SIGNAL. UNDERSTAND THE SETUP. Atomic Analyst organizes its analysis into clear visual information: • Buy and sell arrows to identify potential entries. • Stop Loss and mul
DayTrader PRO
Davit Beridze
5 (4)
DayTrader PRO (Buy DayTrader PRO and get Another Paid Self Optimizing indicator for FREE as BONUS!) DayTrader PRO is an advanced trading indicator that combines John Ehlers' Laguerre Filter with a powerful Auto-Optimization Engine. Instead of using fixed parameters, the indicator automatically searches for the best settings based on recent market conditions, helping you adapt to changing volatility without constant manual adjustments. The indicator generates clear BUY and SELL signals together
ICT PO3 (Power of 3) AMD Protocol Framework Indicator True Time & Structure Integration   |  Non-Repainting | Real-Time  | Multi-Asset  | MT4 Version Available Full Setup Guide & Strategy Playbook: https://www.mql5.com/en/blogs/post/768683 The ICT Power of Three (PO3): The Complete Guide to Accumulation, Manipulation, and Distribution https://www.mql5.com/en/blogs/post/771729 MT4 Version: https://www.mql5.com/en/market/product/171742 Indicator Overview The ICT PO3 AMD Protocol Framework i
Crystal Heikin Ashi Signals
Muhammad Jawad Shabir
5 (5)
Crystal Heikin Ashi Signals—Professional Trend & Signal Detection Indicator Advanced Heikin Ashi Visualization with Intelligent Signal System for Manual & Automated Trading Final Price: $149 ---------> Price goes up $10 after every 10 sales . Limited slots available — act fast . Overview User Guide PDF Crystal Heikin Ashi Signals is a professional-grade MetaTrader 5 indicator that combines pure Heikin Ashi candle visualization with an advanced momentum-shift detection system. Designed for both m
Precision Spike Detector
Francisco Mandomo Simbine
5 (2)
Precision Spike Detector V3 – Institutional-Grade AI Trading System Attention: The price increases by US$50 for every 10 purchases.  Final price: US$599 Precision Spike Detector V3   is a   state-of-the-art, institutional-grade market analysis system   for   MetaTrader 5 , designed to detect   high-probability market movements   in synthetic indices such as   Boom, Crash, GainX, and PainX . After purchase, send me a private message to receive the optimized configuration files,  the installation
More from author
Cumulative Volume Delta (CVD) MA-X Plus : The Ultimate Order Flow Framework Unlock the hidden mechanics of the market with the CVD MA-X Plus. While standard volume indicators only tell you how much was traded, CVD MA-X Plus tells you Who is winning the battle, When they are winning it, and Where the "smart money" is anchored. By aggregating tick-level price action (set to Real Volume when using on regulated markets such as Stocks/Futures/Gold) and multi-layer volume distribution, this indicator
The Ultimate Ichimoku MTF Dashboard: Your All-In-One Trading Edge Transform Your Trading with One Powerful Indicator Imagine having a professional trading assistant that monitors multiple timeframes simultaneously, identifies high-probability entries, warns you of potential reversals, and provides clear risk management guidance-all in one clean, intuitive display. That's exactly what the Ichimoku MTF Dashboard delivers.     Why This Isn't Just Another In
QQE Kalman Hybrid  Smarter Trend Detection. Faster Entries. Cleaner Decisions. QQE Kalman Hybrid is built to help you act on what’s happening now. This momentum and trend confirmation indicator combines the proven structure of classic QQE logic with a modern Kalman adaptive engine designed to reduce lag, smooth noise, and surface high-quality trade opportunities earlier. The result is a clean, decision-focused tool that helps traders identify:  What’s the trend structure?  Where’s the best
FREE
MTF Connecting Fractals Multi-Timeframe Market Structure. One Glance. Real Decisions. MTF Connecting Fractals is not just another arrow-printing indicator. It’s a complete multi-timeframe market structure intelligence system designed to answer the most important trading questions in real time - clearly, visually, and without clutter. Built around fractals as objective structure anchors, this tool gives traders a decisive edge by combining price action, structural context, proximity risk, and
Critical Market Session Information with a Single Glance Stop juggling multiple tools and squinting at time zone converters. The SessionInfoDisplay Indicator is your new, indispensable trading co-pilot that puts real-time market intelligence directly on your chart.   What It Does: Your Essential Trading Dashboard   This intelligent indicator provides three critical pieces of information at a glance: 1. Real-Time Session Detection    - Automatically identifies which major financial session is act
FREE
Clr-Dynamic RSI v SMA Indicator : A Comprehensive Analysis of Features and Advantages The Clr-Dynamic RSI v SMA indicator represents a significant evolutionary leap in technical analysis tools, transforming the classic Relative Strength Index (RSI) from a potentially ambiguous oscillator into a sophisticated, multi-dimensional trading system. At its core, this indicator retains the mathematical foundation of the RSI, measuring the speed and change of price movements, but radically enhances its
MTF Candlestick Patterns Detector : Your Ultimate Price Action Command Centre   In the fast-paced world of trading, missing a single reversal pattern can be the difference between a profitable week and a missed opportunity. The MTF Candlestick Patterns Detector is a professional-grade MQL5 indicator designed to scan, detect, and aggregate over 24 legendary candlestick patterns across all timeframes simultaneously. Stop hunting and guessing through charts. Let the algorithm bring the high-probabi
MTF VWAP Indicator - Quick Overview   This indicator shows you where institutional money is flowing across multiple timeframes using Volume Weighted Average Price (VWAP) to identify high-probability trading zones. New version has VWAP bands plotting capability if user enabled and display panel (whose background changes colour on confluence) can be toggled on/off.      What It Actually Does:     1. Tracks Smart Money Levels: - Shows Daily, Weekly, and Monthly VWAP lines where big players (banks,
MTF WAD Simplified Indicator - Professional Trading Solution     Overview The MTF WAD Simplified is a sophisticated multi-timeframe volume-based indicator designed to track smart money flow across financial markets. By monitoring the Williams Accumulation/Distribution (WAD) across 8 different timeframes, this tool provides traders with unprecedented insight into institutional accumulation and distribution patterns.     Core Benefits for Traders     1. Smart Money Tracking - Detect Institutional
RSI v SMA MTF Indicator : Professional Trading Edge in One Tool   Summary The RSI v SMA MTF Indicator is a sophisticated, multi-timeframe momentum analysis tool that transforms the traditional RSI into a powerful, actionable trading system. By combining RSI slope analysis with SMA crossover signals, divergence detection, and real-time multi-timeframe confluence, this indicator provides traders with a more comprehensive view of market momentum across all relevant timeframes.     Core Utility an
Cumulative Volume Delta MA-X MTF with Gradient Momentum This indicator performs multi-timeframe volume delta analysis for MetaTrader5. It calculates the net difference between buying and selling pressure by analyzing tick or real volume data, providing a visual representation of order flow sentiment. Indicator Logic and Features The indicator uses a mathematical approach to volume analysis: Data Sourcing: Supports both Real Volume (for Exchange assets) and OHLC Wick Proxy calculations (for Forex
Cumulative Volume Delta (CVD) MA-X: Intelligent Order Flow Sentiment Tool Unlock the hidden mechanics of the market with the   Cumulative Volume Delta (CVD) MA-X . While standard volume indicators only tell you   how much   was traded, CVD MA-X tells you   W ho is winning   the battle between buyers and sellers When . By aggregating tick-level price action and volume distribution, this indicator provides a crystal-clear map of market conviction and exhaustion. The Trader’s Edge: Why CVD MA-X? Mo
Multi-Timeframe Money Flow Index (MTF MFI) with Smart Divergence and Dashboard Unlock the flow of institutional money across every timeframe. Are you tired of guessing the trend only to be trapped by a sudden reversal? The Multi-Timeframe Money Flow Index (MTF MFI) is a professional-grade trading tool designed to provide a bird's-eye view of market liquidity and momentum. By aggregating volume-weighted data from W1 down to M1, this indicator eliminates noise and highlights high-probability tra
MTF Parabolic SAR Maximize your trading efficiency with the Multi-Timeframe Parabolic SAR Trend and Momentum Dashboard. Designed for serious traders who value clarity over clutter, this tool aggregates price action across six timeframes into a single, sleek visual interface.  By combining that reliable classic Parabolic SAR logic with advanced momentum scoring and risk assessment, this indicator transforms raw data into actionable trade signals.  The Strategic Edge: Why This Indicator? Most tra
Multi-Timeframe Heiken Ashi (Smoothed with Dashboard) Professional Market Structure Visualization with Weighted Confluence Scoring Transform your trading with crystal-clear multi-timeframe analysis. This indicator combines smoothed Heiken Ashi candles with an intelligent weighted scoring system to give you unprecedented clarity in any market condition. YOUR TRADING QUESTIONS – ANSWERED INSTANTLY: 1. What's the REAL trend direction? Dashboard Reveals:   Higher timeframe (MN1, W1, D1, H4) trend a
Hybrid BB-LRMA [Trend and Volatility Engine]   Master the markets with the Hybrid BB-LRMA, a professional-grade technical analysis tool that fuses the volatility-tracking power of Bollinger Bands (BB) with the hyper-responsive Linear Regression Moving Average (LRMA) to eliminate lag and pinpoint high-probability entries with arrow Signals   Why Hybrid BB-LRMA? Most moving averages are too slow, and Bollinger Bands alone can be noisy. The Hybrid BB-LRMA solves this by using a gradient-based LRMA
Hybrid FATL Fractal: Professional Digital-Signal Logic   Simplify the Complexity of Market Structure.   Unlock the power of digital signal processing combined with price action geometry. The Hybrid FATL Fractal is a professional-grade technical analysis tool designed to eliminate market noise and pinpoint high-probability institutional turning points. By merging the Fast Adaptive Trend Line (FATL) algorithm with Dynamic Fractal Breakout logic, this indicator provides a dual-layered filter that a
VOLUME PROFILE SAF-XII                            Professional Market Profile Analysis for MT5   (The Definitive Tool for Grid & Mean-Reversion Traders)         WHAT IS VOLUME PROFILE? Volume Profile is a professional institutional tool that displays trading activity at specific price levels, unlike traditional volume indicators that show volume over time. It reveals WHERE trading occurred, within your window of choice, helping identify:   • FAIR VALUE AREAS (VAH/VAL) - Price levels wh
Fisher Transform MTF Pro v4.03 Professional Multi-Timeframe Trading Decision System Fisher Transform MTF Pro turns complex multi-timeframe data into clear, actionable trade decisions in seconds. It answers instantly:  What’s the trend?  Where’s the entry?  How strong is the setup?  What are the risks?  Should I buy, sell, or wait?  The Edge   Zero-Line Filter (Trend Protection) Prevents counter-trend trades by default:  No buys above zero  No sells below zero This forces alignment with th
Turtles Professional v2.0 The Legendary Turtle Strategy, Reimagined for the Modern Trader Turtles Pro transforms the iconic 1980s Turtle Trading System into a high-performance, multi-timeframe decision engine. It eliminates guesswork by providing institutional-grade analysis on trend structure, entry quality, and volatility all on a single chart. The Strategic Edge Turtles Professional uses a Smart Weighted Bias Engine to prioritize higher time frames, ensuring your trades align with the d
Hybrid Hull-LSMA : The Trend Meets Momentum Powerhouse Are you struggling with moving averages that are either too slow to react or too noisy to trust? The Hybrid Hull-LSMA is a solution, engineered to solve the "lag vs. noise" dilemma. By fusing the ultra-smooth Hull Moving Average (HMA) with the predictive Least Squares Moving Average (LSMA), this indicator delivers a high-definition view of market structure and entry timing. Why the Hybrid Hull-LSMA? Standard indicators follow the market; t
T3 MTF PureMaths : Multi-Timeframe Tillson T3 Indicator   Zero-Lag Confluence Trading System with Interactive Dashboard  Multi-Timeframe Trading Edge   T3 MTF PureMaths is a professional-grade trading dashboard that aggregates market structure across 8 timeframes simultaneously – from Monthly down to 5-minute charts – giving you instant, actionable insights without chart switching or mental arithmetic. T3 is an advanced tripple-smoothed moving average designed to reduce lag while filtering marke
Divergent Fisher Transform MT5  Precision Momentum. Intelligent Filtering. EA-Ready Automation. The Divergent Fisher Transform for MT5 is a professional-grade momentum trading indicator designed to help traders answer the most important question in the market: “What should I do right now?” It transforms raw price into high-probability, structured trading decisions using a powerful combination of:  Fisher Transform momentum modeling  Zero-line structural filtering  Multi-level overbought/o
Divergent Stochastic Filter II Catch Reversals Early, Filter Noise, Trade with Confidence The Edge: Why This Stochastic is Different  Every trader knows the Stochastic oscillator. But knowing when to trust its signals, that's the real challenge. The Divergent Stochastic Filter II transforms this classic indicator into a precision reversal detection system by adding critical elements: divergence intelligence, signal filtering and exhaustion detection.  While standard Stochastic oscillators fire s
X-Hybrid Modular Z – Execution Intelligence Platform   Transform Any Indicator into a Fully Automated Trading System X-Hybrid Modular Z is a modular execution engine that converts any well-designed custom indicator into a complete automated trading system. Designed for traders who demand professional-grade execution and risk control, it bridges the gap between signal generation and institutional-level trade management, without requiring any coding.   What Makes This EA Different Unlike tradition
Hybrid FATL-LRMA : Digital Precision Meets Statistical Certainty The Ultimate Trend-Momentum Convergence System with clear action protocols. Why Hybrid FATL-LRMA? The Edge some Traders Miss Are you tired of lagging indicators that signal entries after the move has already happened? Frustrated by noisy oscillators that keep you in chop while trends pass you by? The Hybrid FATL-LRMA is a dual-engine trading system that bridges the gap between high-frequency digital signal processing and stat
ADX ClrDynamic Slope-Aware, Low-Lag Trend & Momentum Engine Tired of lagging indicators that signal a trend only after the move is over? Traditional ADX calculations are often too slow for modern market volatility. ADX ClrDynamic bridges this gap by combining customizable low-lag smoothing algorithms (EMA, SMA, Wilder, or Hull Acceleration) with slope-aware momentum logic, giving you a lean, high-precision decision engine for timing trend entries and exits. Key Trading Questions Answered What is
ADX ClrDynamicPro Plus III Multi-Timeframe Trend, Momentum & Divergence Command Center Tired of lagging indicators that signal a trend only after the move is over? ADX ClrDynamicPro Plus III is a complete decision engine for trend, momentum, and reversal traders. By combining customizable smoothing algorithms (EMA, SMA, Wilder, or optional Hull Acceleration) with multi-timeframe (HTF) confirmation, institutional divergence detection, and an embedded subwindow dashboard, this tool delivers clear,
SERA - Sigma-Enhanced Regression Analysis – The Non-Repaint, Early-Entry MTF Trading System The Problem with Most Regression Tools (And How We Solved It) Traditional regression indicators lie to you. They repaint, they lag, and distort actionable data. Their flaws cost you in false back-tests, late entries/exits and therefore missed profits. Avoid catching a falling knife or chasing a train with SERA, she eliminates ALL three problems. One-Click Trading Style Selection – Choose Conservative, R
Streamlined Tri-Color Band Logic prioritizes price action visibility while maintaining the Squeeze detection. 1.The Philosophy Switch: Trade Your Way The   SignalMode   setting lets you choose how the indicator reads band touches. Think of it as your trading personality: When Price Hits The... BREAKOUT Mode (You're a Trend Trader) BOUNCE Mode (You're a Reversal Hunter) AUTO Mode (You Want Both) Upper Band   BUY   – "Momentum is accelerating, ride it!"   SELL   – "Price is stretched, time
Filter:
No reviews
Reply to review