Fisher Transform MTF
- Indicatori
- Versione: 4.0
- Aggiornato: 13 gennaio 2026
- Attivazioni: 5

Indicator Overview
This is a sophisticated Multi-Timeframe (MTF) indicator that not only applies the classic Fisher Transform formula but integrates it into a comprehensive trading system featuring a real-time dashboard. The indicator excels at pinpointing reversals through advanced divergence detection and providing a clear, multi-timeframe view of market structure.
How It Works: Core Fisher Logic
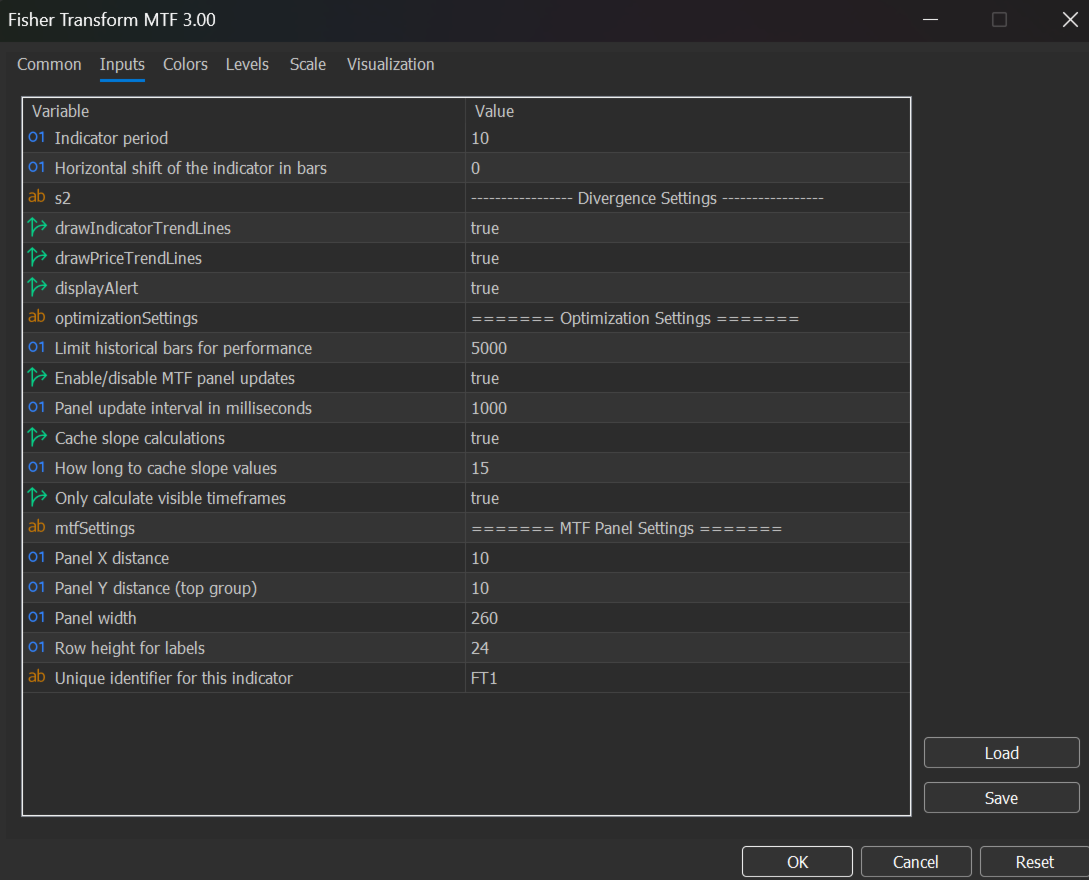
1. Normalization and Signal Generation
The indicator transforms price (using median price (High+Low)/2) into a Gaussian distribution via the Fisher Transform formula: 0.5 log((1+value)/(1-value)) .
This process sharpens turning points and produces two lines:
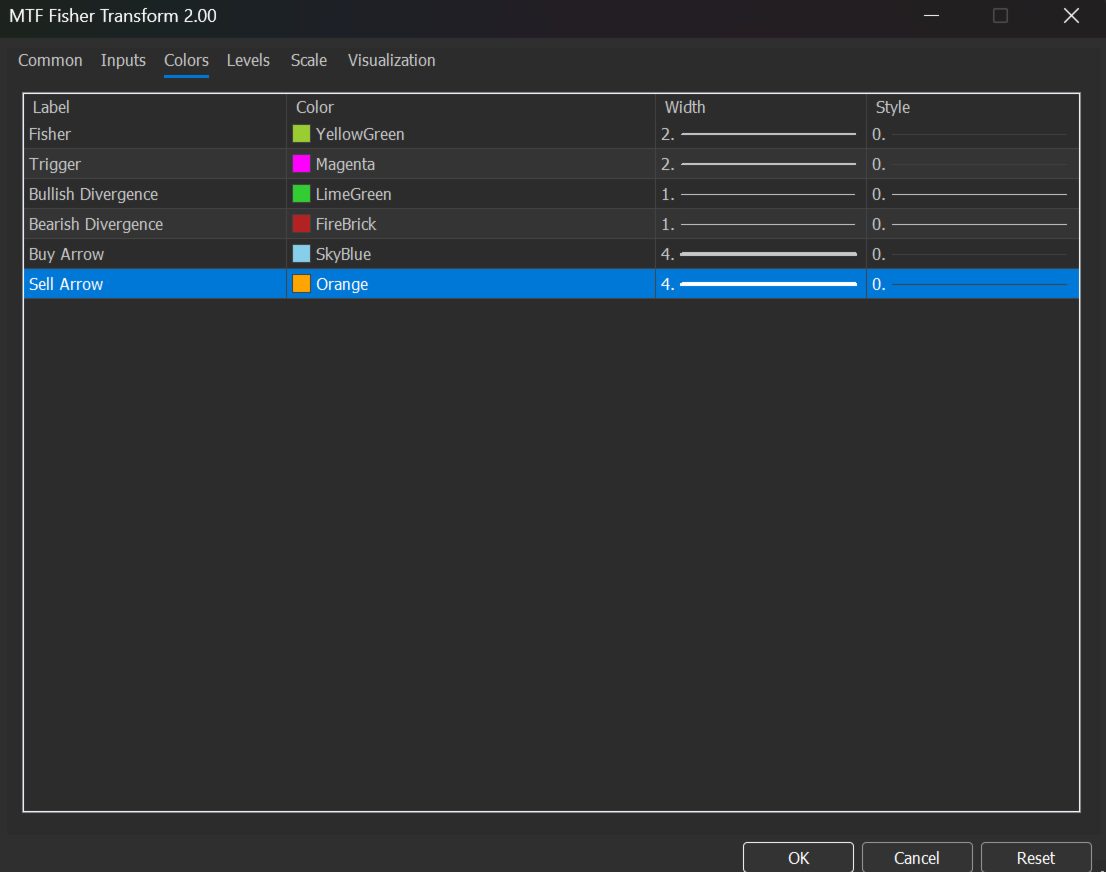
Fisher Line (Yellow-Green): The main transformed oscillator.
Trigger Line (Magenta): A 1-period lag of the Fisher Line (acts as a signal line).
Crossovers between these lines generate basic buy/sell arrows in the indicator window.
2. Key Fisher Interpretation
Zero Line as Trend Filter: A powerful feature. When the Fisher Line is above 0, it indicates a bullish bias in the underlying price trend for that period. Conversely, a value below 0 indicates a bearish bias. This provides an instant, objective trend filter.
Extreme Readings: Values near the upper/lower bounds suggest overbought/oversold conditions, but the Fisher is designed to spend more time at extremes during strong trends.
The Advanced MTF Dashboard: Your Command Centre
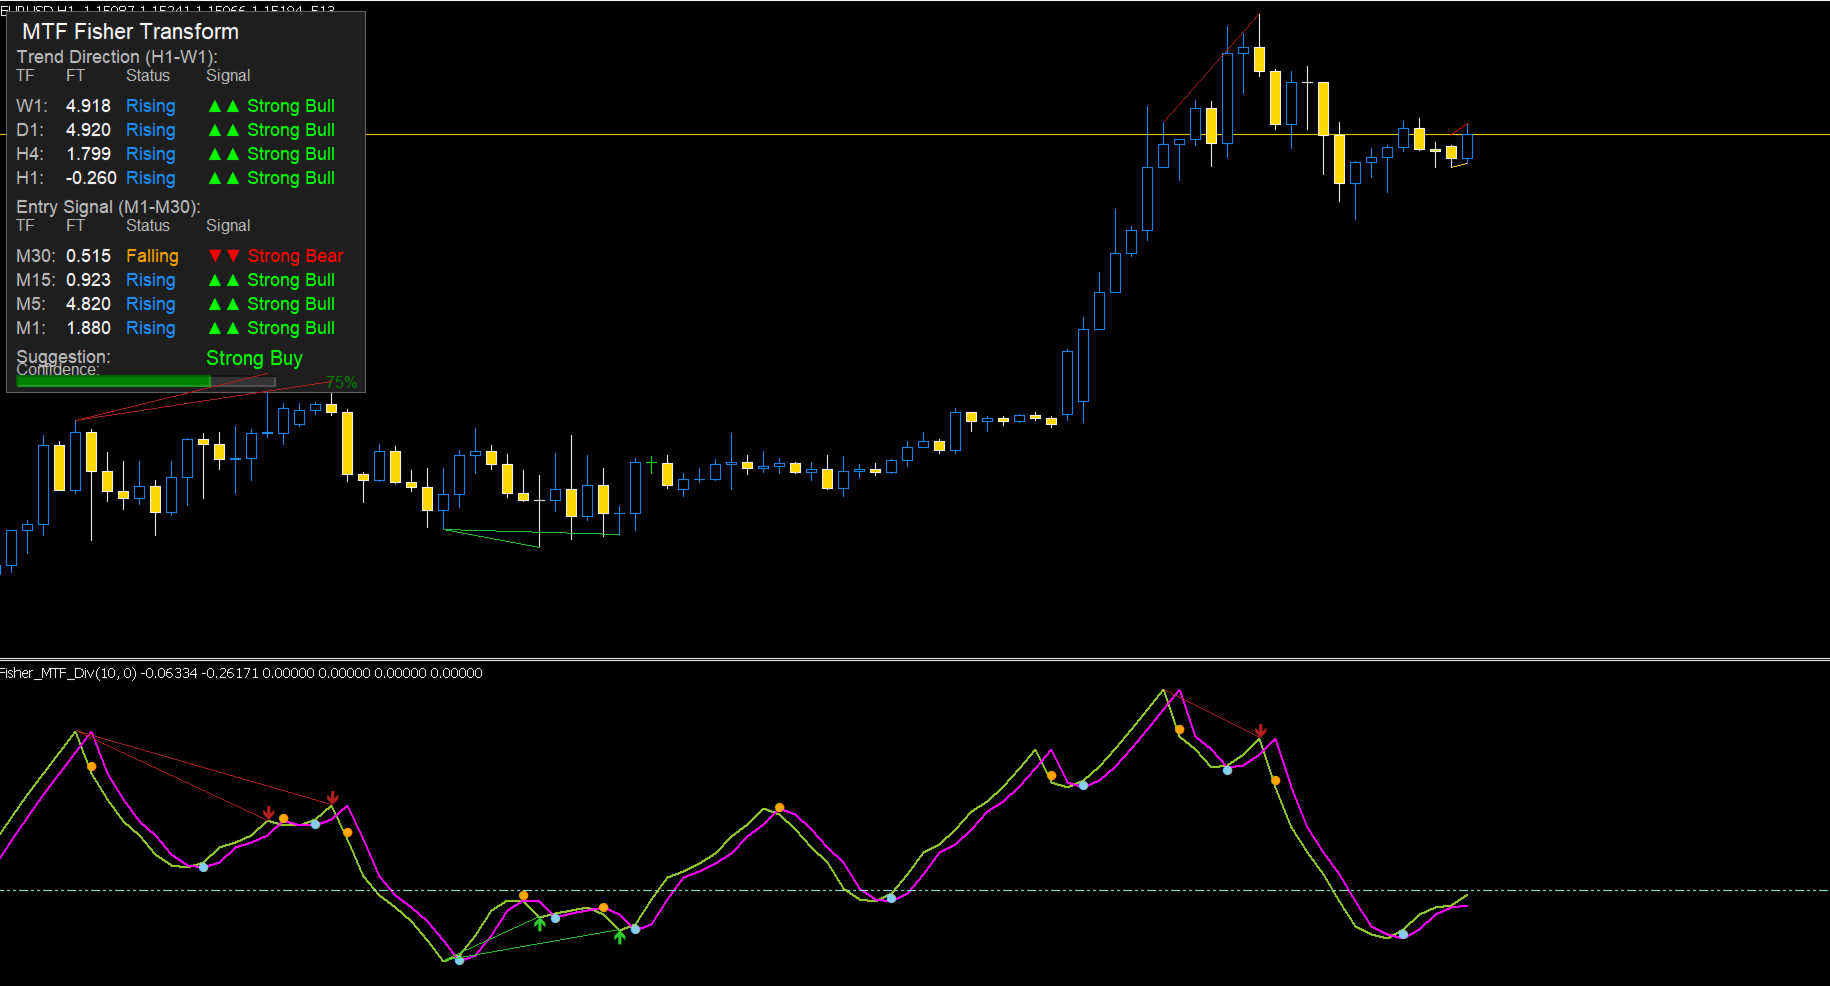
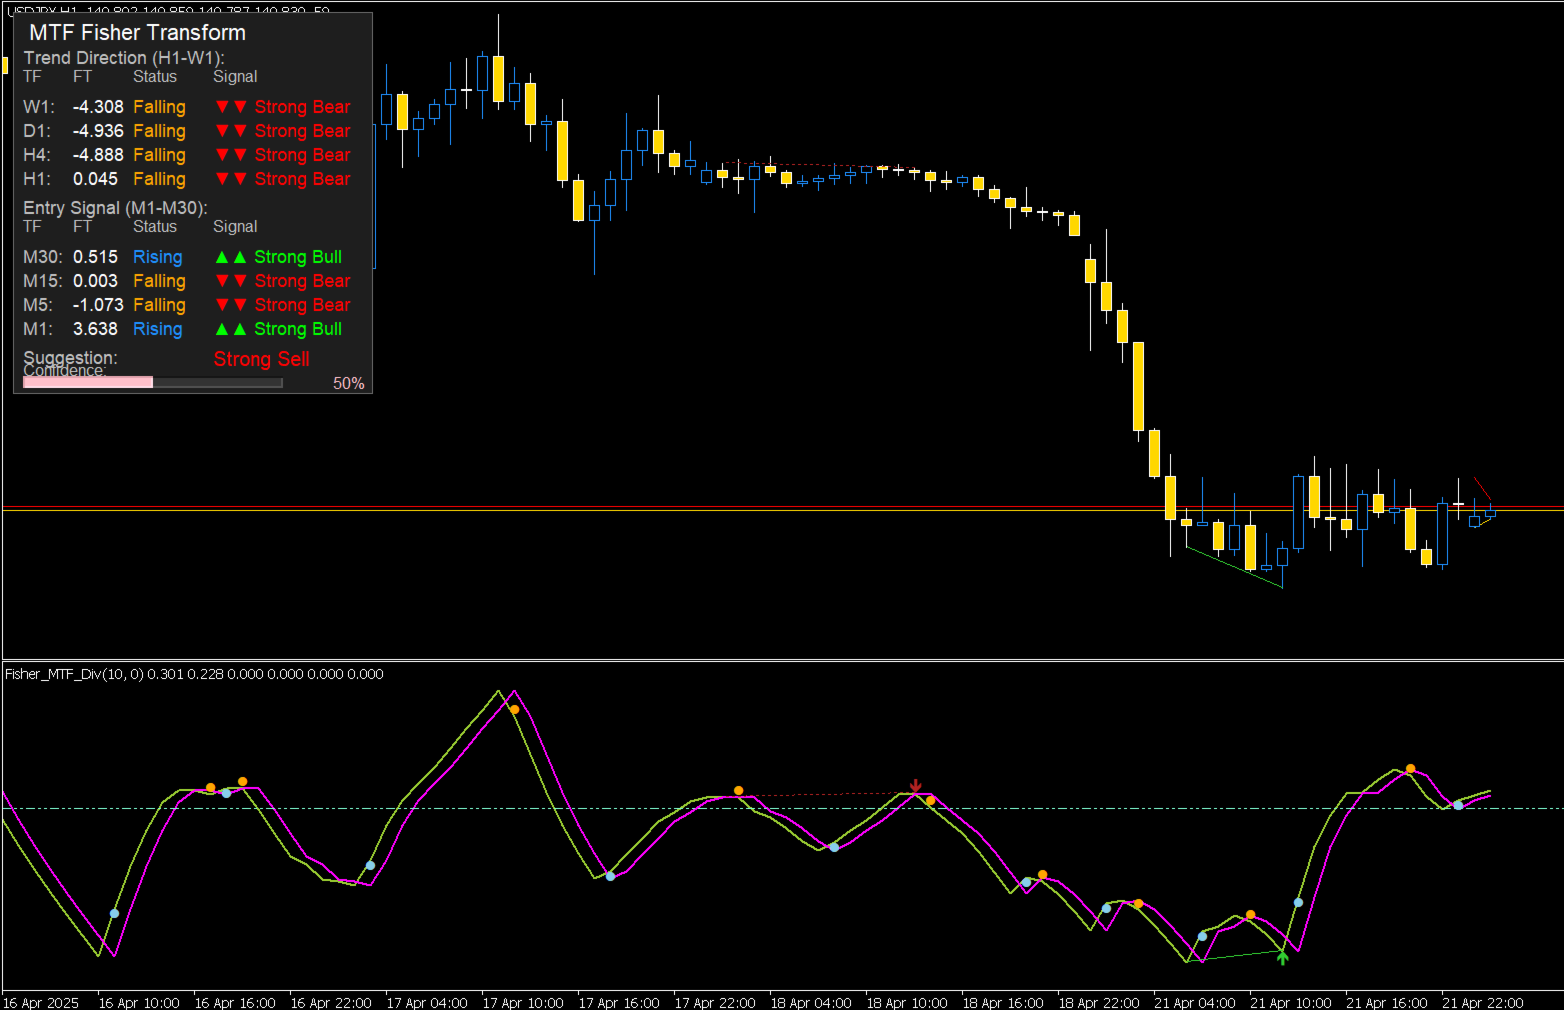
The true power lies in the on-chart panel, which aggregates Fisher analysis across 8 timeframes into an actionable overview.
1. Four-Column Layout for Each Timeframe:
TF: Timeframe (e.g., H1, M15).
FT Value: The current numerical value of the Fisher Transform. This tells you instantly if the bias is bullish (>0) or bearish (<0) and how extreme the reading is.
Status: A dynamic text label ("Rising", "Falling", or "Flat") based on the Fisher slope. Coloured Blue for Rising, Orange for Falling, and Grey for Flat. This shows the current momentum direction of the Fisher oscillator itself.
Signal: The gradient-coloured directional assessment using proprietary slope thresholds.
2. Gradient Signal Strength and Colours:
The indicator doesn't just give a buy/sell signal; it classifies the strength of momentum into five distinct tiers using slope calculations:
▲▲ Strong Bull (LimeGreen): Slope is > 2x the positive threshold. Very strong bullish momentum.
▲ Bullish (Green): Slope is > the positive threshold. Standard bullish momentum.
● Neutral (Grey): Slope is within the neutral band. No strong directional bias.
▼ Bearish (Pink): Slope is < the negative threshold. Standard bearish momentum.
▼▼ Strong Bear (Red): Slope is < 2x the negative threshold. Very strong bearish momentum.
The sensitivity threshold adapts per timeframe (more sensitive on lower TFs like M1).
3. Aggregated "Suggestion" and Confidence Meter:
The panel synthesizes all 8 timeframe signals into one clear Suggestion (e.g., "Strong Buy", "Neutral", "Sell").
The Confidence Meter (a coloured bar) and percentage score (0-100%) show how strongly the timeframes agree. A high score with a "Strong Buy" suggestion indicates a high-probability, aligned opportunity.
Highlighted Benefit: Superior Divergence Detection
The logic for spotting divergences between price action and the Fisher line is exceptionally well-tuned:
Detects both Classical and Reverse/Hidden divergences.
Plots clear arrows on the indicator and optional trend lines on both the price chart and indicator window for visual confirmation.
Can generate alerts, ensuring you never miss a potential reversal signal.
Key Benefits for the Trader
Comprehensive Trend Analysis: Combines the Fisher value (>/< 0) for bias, the Status (Rising/Falling) for momentum, and the gradient Signal Strength for conviction, all in one view.
Informed Decision-Making: The MTF panel answers critical questions: Is the trend bullish on the higher TFs? Is the momentum strengthening on the lower TFs for an entry? Is there a divergence forming?
Objective and Visual: Removes guesswork. The color-coded dashboard provides an immediate, objective snapshot of market structure across all relevant timeframes.
High-Probability Alerts: The divergence signals, especially when combined with a supportive MTF dashboard reading, are among the most reliable early reversal indicators available.
Who It’s For
This tool is ideal for:
Swing and Position Traders using the W1/H4 trend direction to filter trades.
Day Traders using the M15/M5 signals for entries, aligned with the H1 bias.
All Traders who rely on divergence as a core strategy component and want to avoid false signals by checking multi-timeframe alignment.
In summary, this isn't just a Fisher Transform indicator, it's a complete multi-timeframe momentum and divergence trading system that quantifies trend bias, momentum direction, and signal strength into a single, intuitive dashboard.