Fusion StructureBlocksAuto MonthlyOR

StructureBlocksAuto + MensuelOU

構造の力と月次精度の融合

Description:
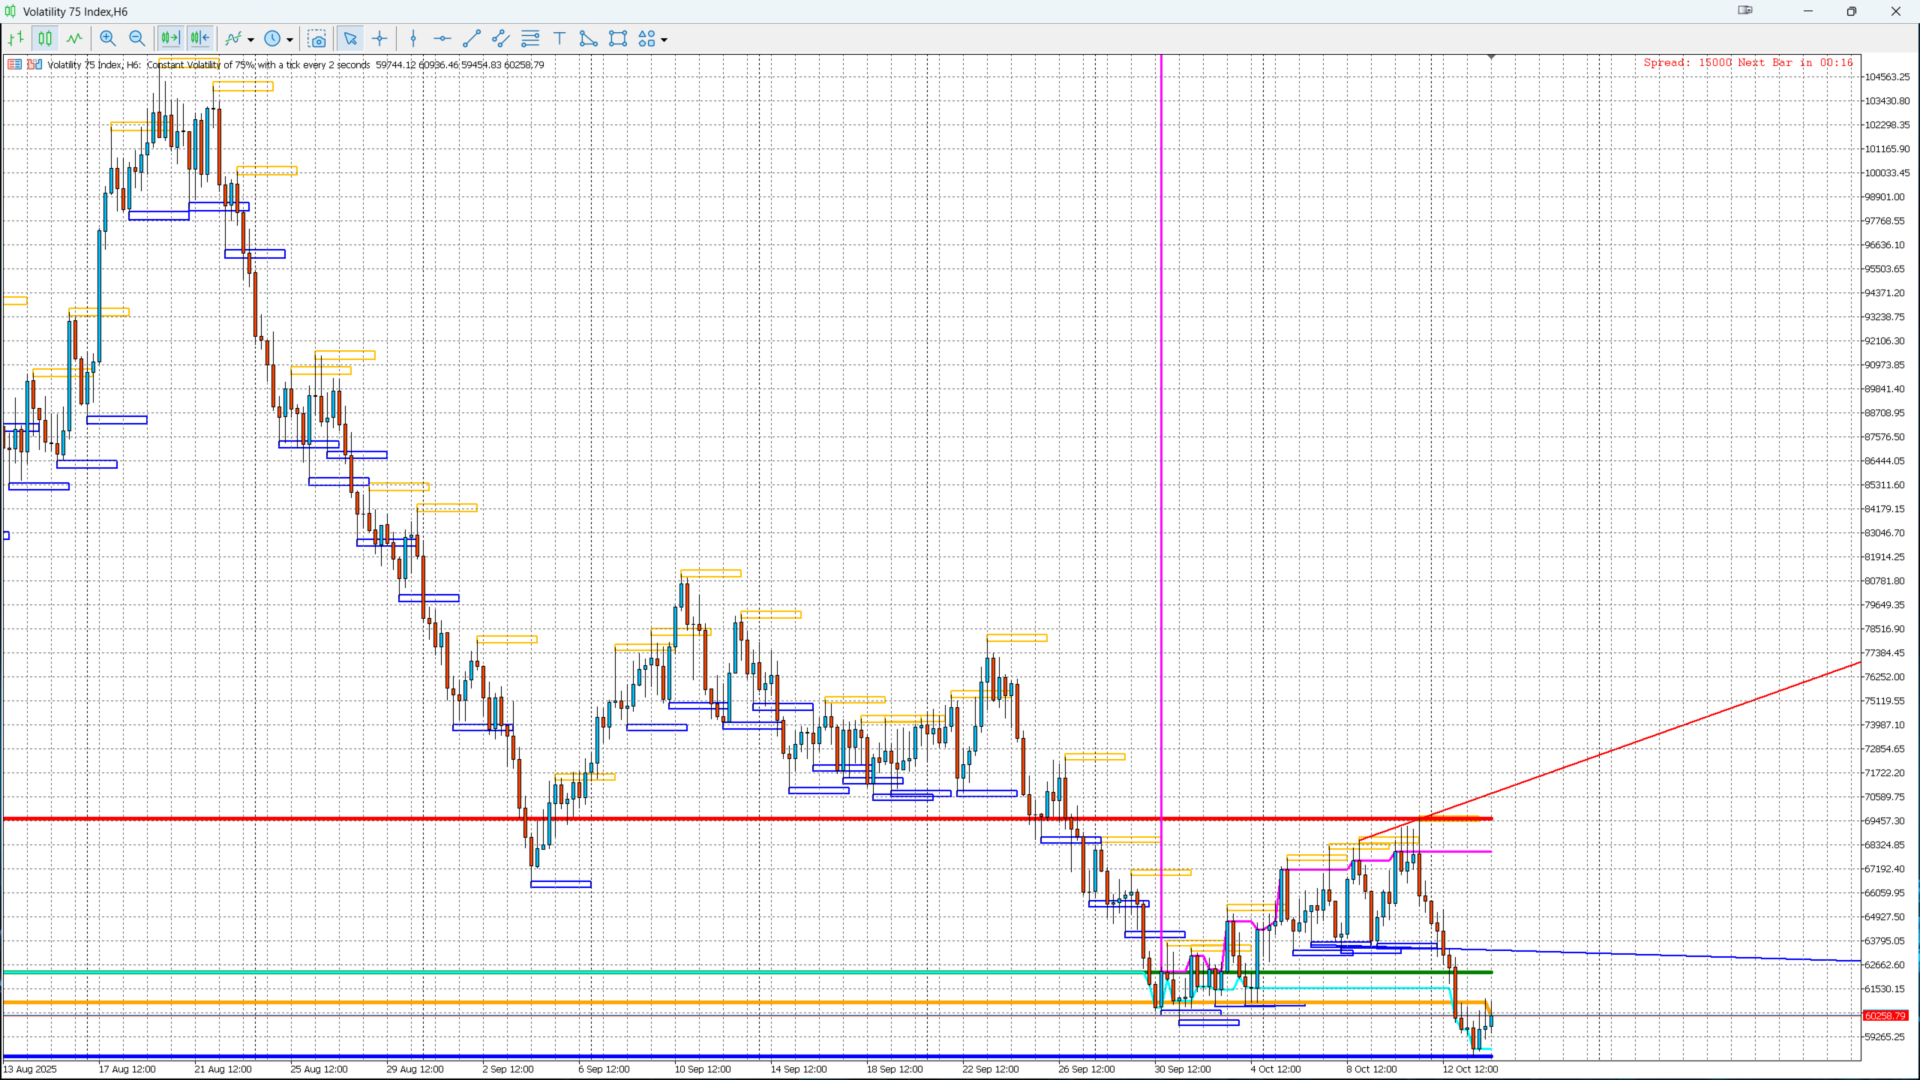
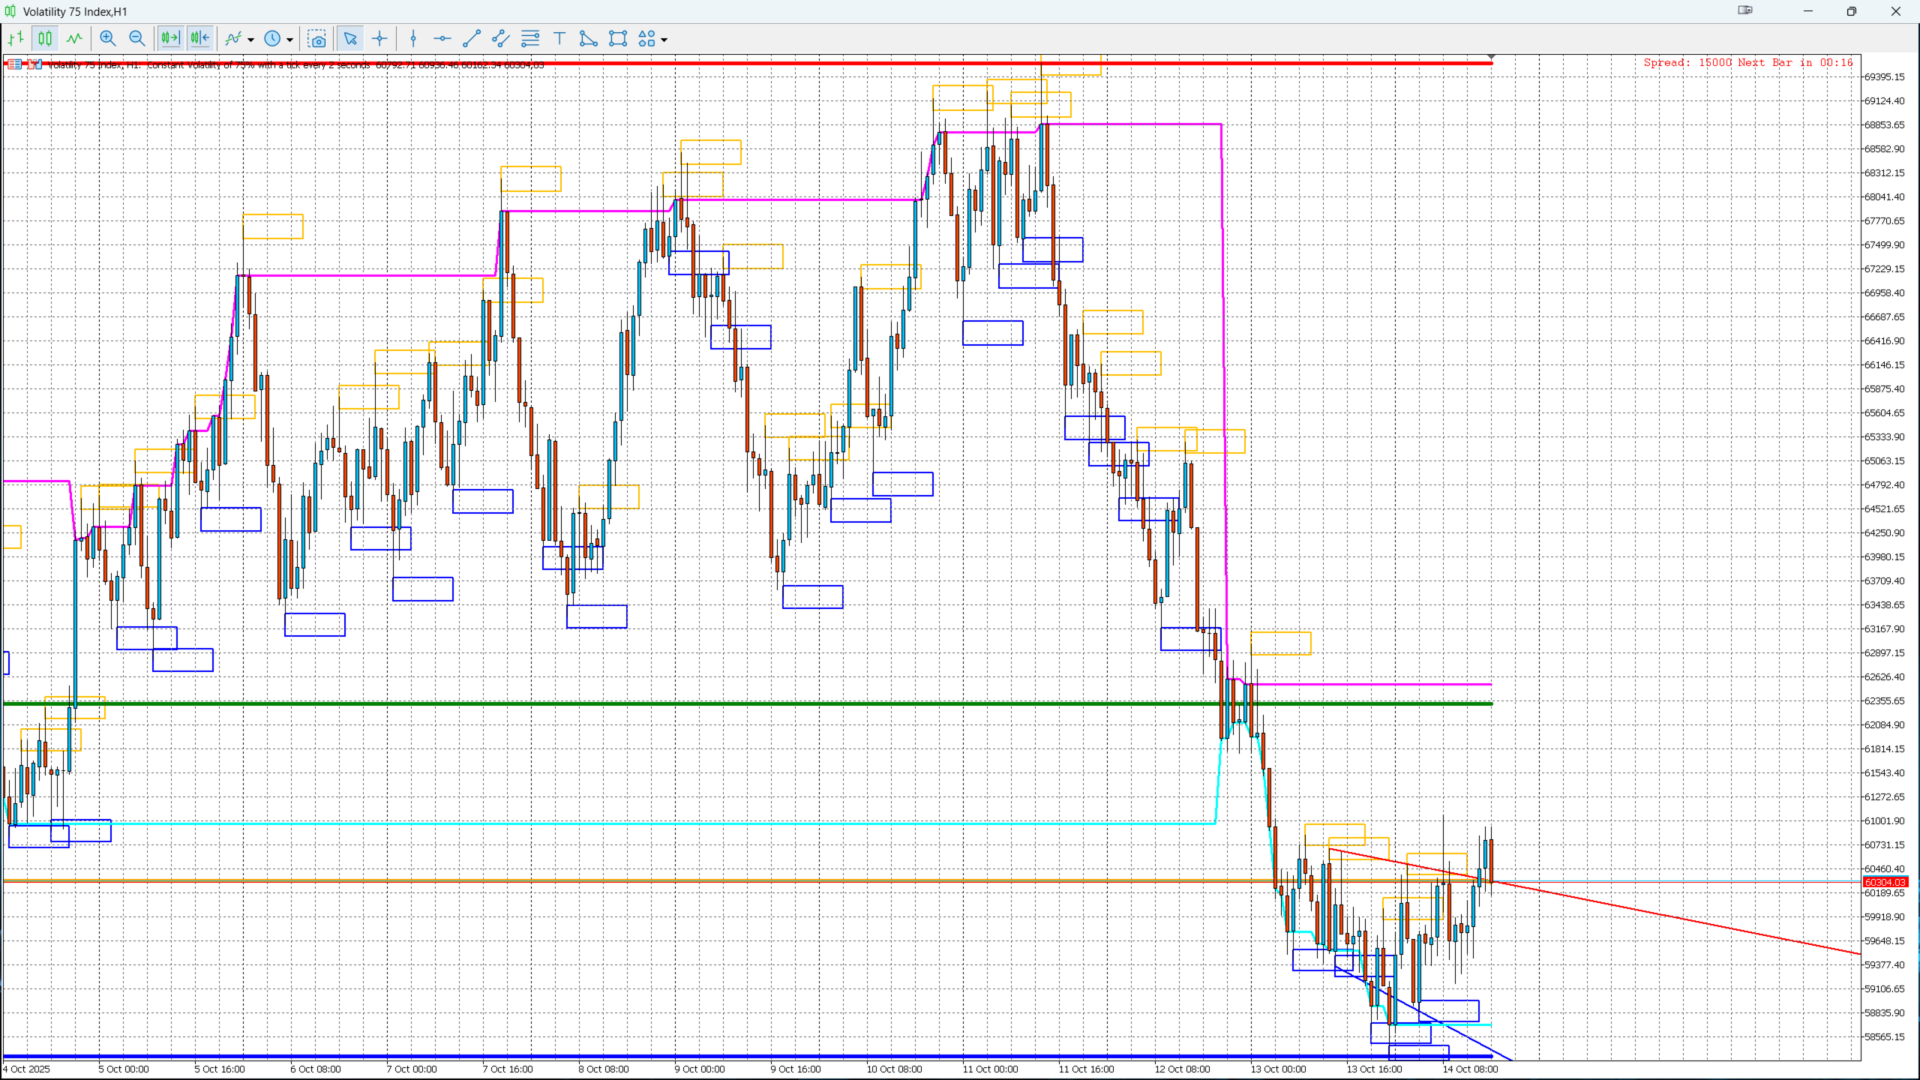
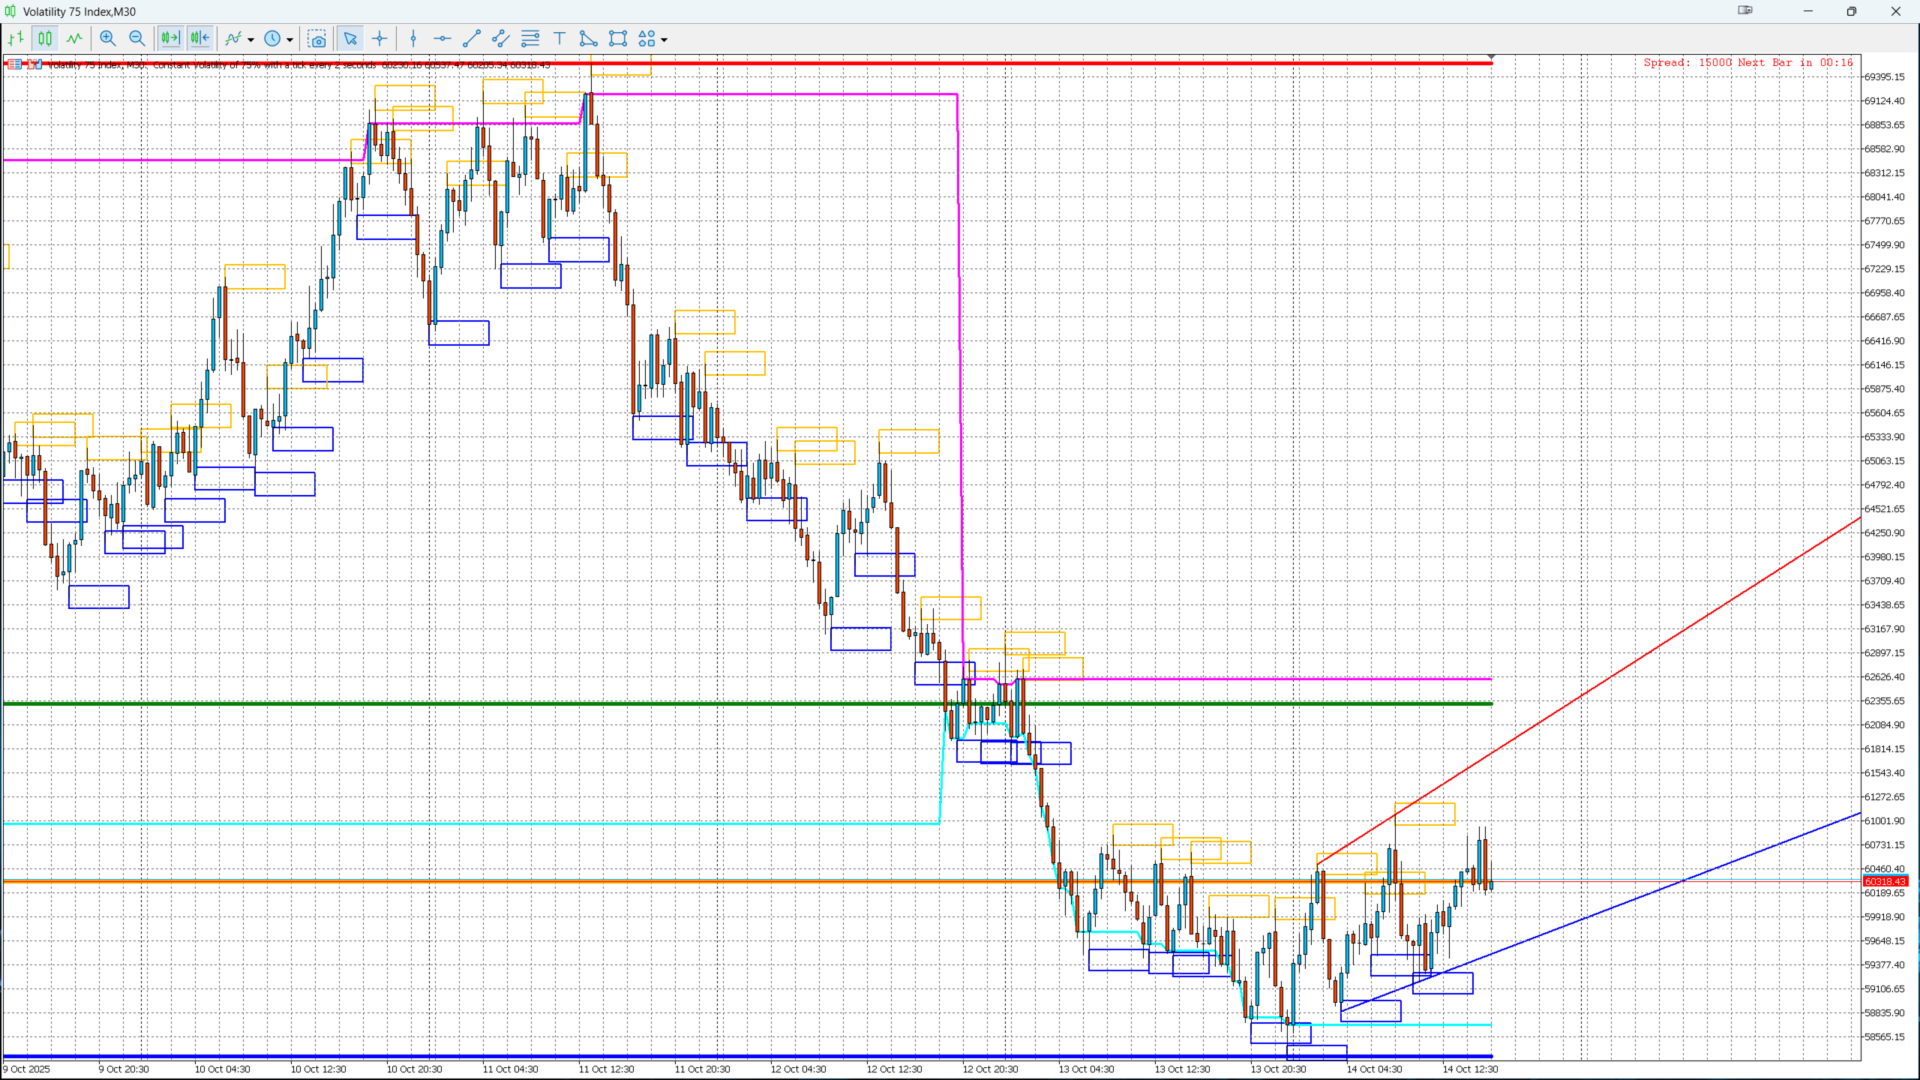
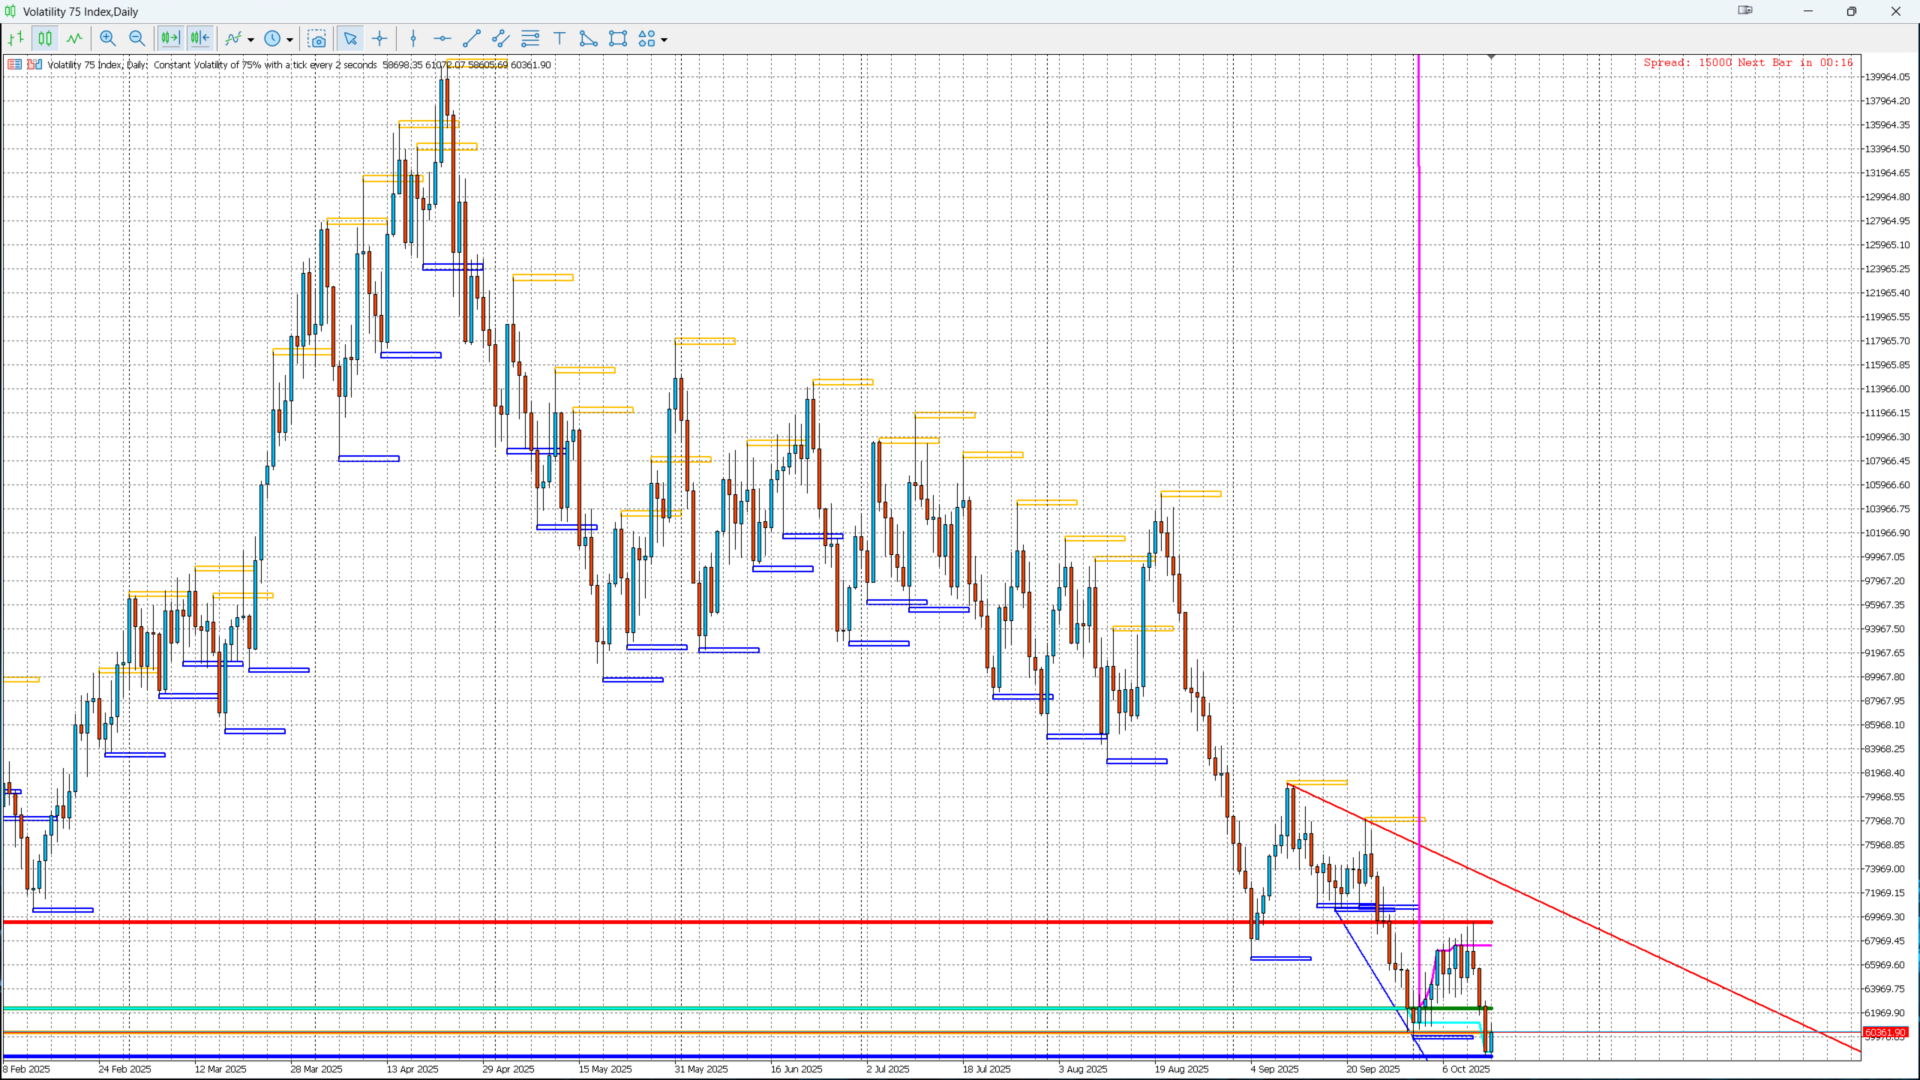
Fusion StructureBlocksAuto + MensuelOR は、市場構造(スイングの高値・安値、サポート・レジスタンスゾーン)を自動的に検出し、 月間オープンレンジ(MOR) と統合します。
プロのトレーダー向けに、 機関投資家レベルのゾーン モメンタムブレイクアウト を視覚的に識別できます。

Nom :
✅ サポート/レジスタンスゾーンの自動検出
✅月足の高値・安値・始値・終値ライン
✅ オープンレンジのブレイクゾーン表示
✅遅延なしで軽量動作
✅ すべての時間軸・通貨ペアに対応

カラー表示 :
🟥 赤 → サポートゾーン
🟦 青 → レジスタンスゾーン
🟩 緑 →月のオープン
🔴 赤 → 月の高値
🔵 青 → 月の安値

Produit :
MetaTrader 5
.

Titre: KOUAME N'da LEMISSA
📅バージョン 1.1


おすすめのプロダクト
Breakout Boxes with Volume Pressure This indicator automates the identification of key consolidation zones (Supply and Demand) based on Market Pivots and Volatility (ATR). Unlike standard support/resistance tools, this indicator provides a unique   Volume Pressure Analysis   inside every box, giving you insight into the battle between Buyers and Sellers before a breakout occurs. Key Features Automated Supply & Demand Zones:   Automatically detects significant Pivot Highs and Lows to draw dyna
インジケーター技術仕様 – Delta Profile for MetaTrader 5 Delta Profile は MetaTrader 5 用に開発されたインジケーターで、指定されたローソク足範囲内の出来高フローを詳細に分析するためのものです。異なる価格レベルにおける正の出来高(上昇に関連)と負の出来高(下降に関連)の不均衡を構造化し、可視化します。その結果、ユーザーは最も多くの取引が集中する価格帯や実際の市場不均衡が形成される領域を明確に把握できます。 以下に、本インジケーターの主要な技術特性と設定パラメータを示します。 基本コンセプト インジケーターは 価格レベル を識別し、それらを正の出来高、負の出来高、および純 Delta(正負の出来高差)に分類します。 各価格レベルは 水平バー としてチャートに表示され、市場の活動ゾーンや不均衡領域を視覚的に確認できます。 ユーザーは 分析対象ローソク足数 、 価格の丸め精度 、 最大表示レベル数 、および 表示スタイル を自由に設定できます。 主要機能 価格レベルのマッピング :設定された精度に基づき価格を丸め、対応するローソク足の
Adjustable Consecutive Fractals  looks for 2 or more fractals in one direction and sends out a on screen alert, sound alert and push notification, for strong reversal points . Adjustable Consecutive Fractals, shows the fractals on chart along with a color changing text for buy and sell signals when one or more fractals appear on one side of price. Adjustable Consecutive Fractals is based Bill Williams Fractals . The standard Bill Williams fractals are set at a non adjustable 5 bars, BUT withe th
Weis Wave Scouterは、MetaTrader 5向けに開発された革新的なインジケーターであり、WyckoffメソッドとVSA(Volume Spread Analysis)の確立された原則を組み合わせています。精度と深みを求めるトレーダー向けに設計され、累積ボリューム波の分析を通じて市場を戦略的に読み取り、トレンドの反転ポイントや継続ポイントを特定する支援を行います。 Weis Wave Scouterは、クラシック、ナイトビジョン、オーシャンブリーズといったカスタマイズ可能なカラーテーマで、上昇波と下降波を色分けしたヒストグラムで明瞭に表示します。主な機能には、ボリュームピークの検出、低アクティビティゾーン(DeadZone)の識別、およびボリュームベースの波の反転に関するカスタマイズ可能なアラートが含まれます。また、エフォート対リザルト分析、因果関係、需給バランスといったWyckoffおよびVSA理論の基本概念をサポートしています。Brick Size、Volume Scale Factor、Pivot Lookbackといったパラメータで柔軟に調整でき、あらゆるスタ
KT Liquidity Sweep Filter は、重要な流動性スイープゾーンを特定し、視覚的に強調表示するインジケーターです。これらのゾーンを明確なプライスアクションによる反発と適応型のトレンドフィルターと組み合わせることで、市場のトレンドに沿った正確な売買シグナルを生成します。 このインジケーターは、大きな流動性スイープゾーンと小さなゾーンを区別し、大きなゾーンには太い矢印、小さなゾーンには細い矢印で表示して、視認性を高めています。 大きな矢印: 主要な流動性スイープゾーンから発生する強い反転シグナルを示します。 小さな矢印: 二次的な流動性スイープゾーンからの弱めの反転シグナルを示します。 機能 トレンドに沿ったシグナル: ゴールドなどのトレンド性の強い銘柄において、トレンドに乗るための複数のエントリーポイントを提供します。 取引チャンスの増加: 強い反転と弱い反転の両方を明確に示すことで、より多くのエントリー機会を提供します。 カスタマイズ可能なトレンドフィルター: 取引対象の銘柄や時間足に合わせてシグナルを調整できます。 しきい値の調整: 主要スイープシグナルの感度を調
The new update makes this indicator a complete tool for studying, analyzing and operating probabilistic patterns. It includes: On-chart Multi-asset percentage monitor. Configurable martingales. Twenty-one pre-configured patterns, including Mhi patterns and C3. An advanced pattern editor to store up to 5 custom patterns. Backtest mode to test results with loss reports. Trend filter. Hit operational filter. Martingale Cycles option. Various types of strategies and alerts. Confluence between patter
Was: $249  Now: $99   Market Profile defines a number of day types that can help the trader to determine market behaviour. A key feature is the Value Area, representing the range of price action where 70% of trading took place. Understanding the Value Area can give traders valuable insight into market direction and establish the higher odds trade. It is an excellent addition to any system you may be using. Inspired by Jim Dalton’s book “Mind Over Markets”, this indicator is designed to suit the
WAPV Weis Wave Chart Forex
Eduardo Da Costa Custodio Santos
The Weis Wave Chart Forex for MT5 is a Price and Volume indicator. The Price and Volume reading was widely disseminated through Richard Demille Wyckoff based on the three laws created by him: Supply and Demand, Cause and Effect and Effort vs. Result. In 1900 R.Wyckoff already used the wave chart in his analyses. Many years later, around 1990, David Weis Automated R. Wyckoff's wave chart and today we bring you the evolution of David Weis' wave chart. It shows the amount of Volume and the amount o
STRICTLY FOR BOOM INDEX ONLY!!!!! Here I bring the Maximum Trend Arrows OT1.0 MT5 indicator. This indicator is made up of a combination of different trend indicators for entries and exits, for entries an orange arrow will paint on the chart below the current market and a red flag for closing of trades and it produces buy arrows only. When the orange arrow appears, it will appear along with it's sound to notify you. The 1H timeframe is recommended, don't use it anywhere else than on the 1H timefr
Delta + CVD & CVD Candles Order-flow indicator combining Delta (Ask–Bid), Cumulative Volume Delta (CVD), and a unique CVD-based synthetic candle system. Shows buy/sell pressure, volume aggressiveness, and momentum shifts with optional Delta histogram, CVD line, and CVD+Delta combined candles. Useful for scalping, intraday trading, divergence detection, and understanding buyer/seller dominance. Overview The Delta + CVD & CVD Candles Indicator combines multiple order-flow tools into one clean
Do you use volume in your reading of the market? Certainly many traders use it, and do not imagine operating without it. The Color Histogram Volume Set indicator allows the user to choose the value that he considers interesting to monitor. When you pass this you will have visual confirmation and if you want you will also have the audible alert that is given by the indicator. Of course, there are other ways to try to find a high volume, such as assessing whether the volume is above av
+++++++++++++++++++++++++++++++++++++++++++++++++++++++++++++++++++++++++++++++++++++++++++++++++ +++ Link to EURUSD Only Free Version -->  https://www.mql5.com/en/market/product/156904?source=Unknown +++++++++++++++++++++++++++++++++++++++++++++++++++++++++++++++++++++++++++++++++++++++++++++++++ Hallo Trader, This is a traditional GANN & FIBONACCI strategy based on detection of an impulsive move in the opposite direction. This is called a Breakout. At the moment of Breakout, the indicator draw
Hello My Dear Friend, im introduce about Binary Option Premium V8 it work, all currency pair 1 minute time frame, 1-5 minute expire 100% non repaint, no delay signal Alright. This indicator works on MT5 and is very easy to use. When you receive a signal from it, you wait for that candle with the signal to close and you enter your trade at the beginning of the next new candle. A red arrow means sell and a green arrow means buy. for easy identification of trade signal. Are you okay with that?  W
Hurst buy and sell
Victor Alfonso Molina Botello
Hurst Buy and Sell This innovative indicator, inspired by xAI Grok intelligence, uses the Hurst exponent to identify the nature of the market and generate buy/sell signals. The EA for this indicator (Hurst Razer PRO EA MT5) is now available, you can see it by clicking here!  https://www.mql5.com/es/market/product/153441?source=Site+Profile+Seller  If you want more signals from the indicator, change the minimum number of bars between consecutive signals. The lower the value, the more signals it
FREE
Value Chart Candlesticks
Flavio Javier Jarabeck
4.69 (13)
The idea of a Value Chart indicator was presented in the very good book I read back in 2020 , " Dynamic Trading Indicators: Winning with Value Charts and Price Action Profile ", from the authors Mark Helweg and David Stendahl. The idea is simple and the result is pure genius: Present candlestick Price analysis in a detrended way! HOW TO READ THIS INDICATOR Look for Overbought and Oversold levels. Of course, you will need to test the settings a lot to find the "correct" one for your approach. It
FREE
A simple Zig Zag indicator with added visualization of Higher High, Lower High, Higher Low, Lower Low. This indicator will be very helpful when working with support/resistance levels. The ZigZag indicator is a fundamental tool that will significantly help you navigate complex situations in the financial markets. By providing a clear visual representation of price movements and trends, it simplifies the analysis process and improves decision-making capabilities. Its role in identifying trends and
Anchored VWAP with Alert MT5
Trade The Volume Waves Single Member P.C.
5 (1)
What is the Volume Weighted Average Price (VWAP)? The volume weighted average price (VWAP) is a trading benchmark used by traders that gives the average price an instrument has traded at throughout the day, based on both volume and price.  It is important because it provides traders with insight into both the trend and value of the instrument. What is the Difference between VWAP and AVWAP? While VWAP is having as starting point the beggining of the day,week,month etc. in the AVWAP you can pla
MercariaPattern1-2-3 відстежує рух ціни, знаходить трьоххвильові структури 1-2-3 та підсвічує момент, коли сценарій підтверджується пробоєм ключового рівня. MercariaPattern1-2-3 tracks price movement, detects three-leg 1-2-3 structures and highlights the moment when the scenario is confirmed by a key level breakout. Індикатор збирає локальні свінги в компактну фігуру 0–1–2–3 , чекає підтвердженого пробою та будує стрілку входу з готовими рівнями SL/TP. The indicator combines local swings into a
Your Trend Friend
Luigi Nunes Labigalini
5 (1)
The trend is your friend! Look at the color of the indicator and trade on that direction. It does not  repaint. After each candle is closed, that's the color of the trend. You can focus on shorter faster trends or major trends, just test what's most suitable for the symbol and timeframe you trade. Simply change the "Length" parameter and the indicator will automatically adapt. You can also change the color, thickness and style of the lines. Download and give it a try! There are big movements w
ACB Breakout Arrows MT5
KEENBASE SOFTWARE SOLUTIONS
5 (1)
ACB Breakout Arrows インジケーターは、特別なブレイクアウトパターンを検出することで、市場における重要なエントリーシグナルを提供します。このインジケーターはチャートを常に監視し、一方向に勢いが定着してきた段階で、主要な値動きの直前に精度の高いエントリーシグナルを表示します。 マルチシンボル・マルチタイムフレームスキャナーはこちらから - ACB Breakout Arrows MT5 用スキャナー 主な機能 ストップロスとテイクプロフィットの水準が自動で表示されます。 すべての時間足のブレイクアウトシグナルを監視できるMTFスキャナーダッシュボードを搭載。 デイトレーダー、スイングトレーダー、スキャルパーに最適。 シグナル精度を高めるための最適化されたアルゴリズム。 損益分岐点やスキャルピングターゲットに使える特別なライン(クイックプロフィットライン)。 勝率、平均利益などのパフォーマンス分析メトリクスを表示。 リペイントなし。 トレードの確認 - 低確率のトレードを除外するために ACB Trade Filter インジケーター を使用してください。 強い買い:
SMC LIQUIDITY Advanced Institutional-Grade Smart Money and Liquidity Analysis Suite for MT5 SMC LIQUIDITY is a comprehensive institutional toolkit engineered for traders who require precise liquidity mapping, market structure intelligence, smart money concepts, and order flow awareness in a single integrated interface. It is designed for professional workflow, multi-timeframe clarity, and seamless execution in fast-moving conditions. This indicator combines several institutional methodologies in
This indicator has been developed to identify and display these trends quickly and easily, allowing you to see instantly, those currency pairs which are trending, and those which are not – and in all timeframes, with just one click. The 28 currency pairs are displayed as a fan as they sweep from strong to weak and back again, and this is why we call it the ‘currency array’. All 28 pairs are arrayed before you, giving an instant visual description of those pairs that are trending strongly, those
Precision Arrows – TPとSLを内蔵したスマートエントリーシグナル Precision Arrows は、 正確性・明瞭性・信頼性 を求めるトレーダーのために設計された高性能トレーディングインジケーターです。 高確率の買い・売りシグナルを検出し、自動的に テイクプロフィット(TP) と ストップロス(SL) のレベルを設定。 FX・株価指数・暗号資産・シンセティックインデックス など、あらゆる市場で規律的かつ一貫したトレードをサポートします。 このインジケーターは、精密なシグナル検出、インテリジェントなフィルタリング、そしてマルチタイムフレームトレンドダッシュボードを組み合わせ、あらゆる相場環境に対応する完全なトレーディングソリューションを提供します。 期間限定オファー Precision Arrows は現在、 75ドル(永久ライセンス) でご利用可能です。 (通常価格: 199.99ドル / オファー延長中) 重要: ご購入後すぐにご連絡ください。使用手順と 特別ボーナス をお送りします。 主な機能 3つのトレードモード お好みのスタイルに合わせて、 スキャルピ
Contact me for instruction, any questions! - Lifetime update free - Non-repaint - I just sell my products in Elif Kaya Profile, any other websites are stolen old versions, So no any new updates or support. Introduction Breakout Trend Scanner indicator works based on the Elliott Wave in technical analysis describes price movements in the financial market that are related to changes in trader sentiment and psychology and finds end of movement and breakout trend. The Elliott Wave pattern that is f
Daily & Composite Volume Profile   This is a professional-grade market profile tool designed for MetaTrader 5. It utilizes a   Dual-Profile System   to visualize supply, demand, and liquidity concentrations. Key Features Left Side: Daily Session Profiles Automatically identifies the start and end of every trading day. Generates a unique Volume Profile for each individual day. Allows you to see how value migrated from yesterday to today (e.g., Is today's volume higher or lower than yesterday?).
HLC bar MT5 Wyckoff
Eduardo Da Costa Custodio Santos
MT5のインジケーター「HLC_bar_MT5Wyckoff」は、取引時の分析を容易にするために作成されました。 HLCバーはRichardWyckoffによって使用され、現在「VSA」操作で広く使用されています。 Wyckoffは、High、Low、およびCloseを使用すると、グラフがはるかにクリーンになり、分析が容易になることを発見しました。 区分 "HLC_bar_MT5 Wyckoff"により、以下が可能になります。 #バーの幅を変更します。 #バーを同じ色のままにします。 #そして、同じ価格で開閉したバーを強調表示します。 色と幅は設定で簡単に変更できます インジケーターを使用するには、インジケーターをチャートにドラッグするだけです。
MT4版  |  FAQ Owl Smart Levels Indicator は、 Bill Williams の高度なフラクタル、市場の正しい波構造を構築する Valable ZigZag、エントリの正確なレベルをマークする Fibonacci レベルなどの一般的な市場分析ツールを含む 1 つのインジケーター内の完全な取引システムです。 利益を得るために市場と場所に。 戦略の詳細な説明 インジケータを操作するための指示 顧問-取引助手 プライベートユーザーチャット ->購入後に私に書いて、私はプライベートチャットにあなたを追加し、あなたはそこにすべてのボーナスをダウンロードすることができます 力はシンプルさにあります! Owl Smart Levels 取引システムは非常に使いやすいので、専門家にも、市場を勉強し始めて自分で取引戦略を選択し始めたばかりの人にも適しています。 戦略と指標に秘密の数式や計算方法が隠されているわけではなく、すべての戦略指標は公開されています。 Owl Smart Levels を使用すると、取引を開始するためのシグナルをすばやく確認し、注文を出すための
Visual Heatmap Book Analyser This indicator monitors the market liquidity and generates colors based on order patterns, quantities, and renewal activities in the book. This allows you to visualize the order flow and identify areas of high and low liquidity and activity. The indicator uses machine learning techniques to analyze the order behavior in the book, enabling it to detect patterns and trends in orders, allowing you to make informed decisions about your trading operations. The color pale
Range Directional Force Indicator – Designed for You to Optimize! The Range Directional Force Indicator is a cutting-edge tool designed to empower traders by visualizing market dynamics and directional strength. Built to offer insights into market trends and reversals, this indicator is an invaluable asset for traders seeking precision in their strategies. However, it is important to note that this indicator is not optimized, leaving room for you to tailor it to your unique trading preferences.
SMC Venom Model BPR インジケーターは、スマート マネー (SMC) コンセプトで取引するトレーダー向けのプロフェッショナル ツールです。価格チャート上の 2 つの主要なパターンを自動的に識別します。 FVG   (フェアバリューギャップ) は、3 本のローソク足の組み合わせで、最初のローソク足と 3 番目のローソク足の間にギャップがあります。ボリュームサポートのないレベル間のゾーンを形成し、価格修正につながることがよくあります。 BPR   (バランス価格範囲) は、2 つの FVG パターンの組み合わせで、「ブリッジ」を形成します。これは、価格がボリュームアクティビティの少ない動きで動くときに、ブレイクアウトしてレベルに戻るゾーンで、ローソク足の間にギャップを作成します。 これらのパターンは、大規模な市場プレーヤーと一般参加者の相互作用が発生するチャート上のボリュームと価格動向の分析に基づいて、トレーダーが主要なサポート/レジスタンス レベル、ブレイクアウト ゾーン、エントリ ポイントを識別するのに役立ちます。 インジケーターは、長方形と矢印の形でパターンを視覚
このプロダクトを購入した人は以下も購入しています
SynaptixQuant Dominance Matrix: Institutional-Grade Market State Extraction Engineered for traders who require a data-driven view of market behaviour beyond surface-level indicators. The Synaptix Quant (SQ) Dominance Matrix is not a conventional currency strength display. Behind its intentionally streamlined interface runs a sophisticated analytical architecture designed to quantify market conditions with precision. Every output is generated through layered signal processing built to identify d
これまでに、 素晴らしいバックテスト結果、 驚くべき数値を持つ ライブ口座のパフォーマンス証明 、そして あらゆる場所での統計情報 がある取引インジケーターを購入し、しかし使用後に 口座を破綻させてしまった ことは何度ありますか? シグナル単独を信用すべきではありません。そもそもなぜそれが表示されたのかを知る必要があります。そして、それこそがRelicusRoad Proの得意とすることです! ユーザーマニュアル + 戦略 + トレーニングビデオ + VIPアクセス付きプライベートグループ + モバイル版利用可能 市場の見方を変える新しい方法 RelicusRoadは、FX、先物、仮想通貨、株式、指数に対応する、 世界で最も強力で最高の取引インジケーター であり、トレーダーが口座を 成長させる ために必要なすべての情報とツールを提供します。 初心者 から 上級者 まで、 すべてのトレーダー が成功できるよう、 テクニカル分析 と 取引計画 を提供します。 これは、将来の市場を 予測する のに十分な情報を提供する 主要な取引インジケーター です。私たちは、チャート上で意味をなさない複
AriX
Temirlan Kdyrkhan
1 (4)
AriX Indicator for MT5 A powerful trend-following and signal-evaluation tool AriX is a custom MT5 indicator that combines Moving Averages and ATR-based risk/reward logic to generate clear buy/sell signals. It visualizes dynamic SL/TP levels, evaluates past trade outcomes, and displays win/loss statistics in a clean on-chart panel. Key features include: Buy/Sell signals based on MA crossovers ATR-based SL/TP1/TP2/TP3 levels with visual lines and labels Signal outcome tracking with real-time stat
ARICoin is a powerful trading companion designed to generate high-probability entry signals with dynamic TP/SL/DP levels based on volatility. Built-in performance tracking shows win/loss stats, PP1/PP2 hits, and success rates all updated live. Key Features: Buy/Sell signals with adaptive volatility bands Real-time TP/SL/DP levels based on ATR Built-in MA Filter with optional ATR/StdDev volatility Performance stats panel (Success, Profit/Loss, PP1/PP2) Alerts via popup, sound, push, or email Cust
This indicator uses support and resistance, volume and some special formula to calculate the volume to filter the candles. If the volume reaches a specific value, And at the same time, Candle breaks the support/resistance line, There would be a signal and we can enter the market. Signals appear when the current candle closes. then you can enter the trade when a new candle appears. Please don't forget to follow your money management plan. MT4 Version Support/Resistance Breakout MT4 :   https:/
Super Signal – Skyblade Edition プロ仕様のノンリペイント / ノーラグ・トレンドシグナルシステム。卓越した勝率を実現 | MT4 / MT5 対応 主な特徴: Super Signal – Skyblade Edition は、トレンド取引に特化したスマートなシグナルシステムです。マルチレイヤーのフィルターロジックを用いて、明確な方向性と実際のモメンタムに支えられた強力なトレンドのみを検出します。 このシステムは 天井や底を予測するものではありません 。次の3つの条件がすべて満たされた場合にのみシグナルを発生させます: 明確なトレンド方向 モメンタムの増加 健全なボラティリティ構造 市場セッションに基づく流動性分析と組み合わせることで、シグナルの精度とタイミングがさらに向上します。 シグナルの特性: すべての矢印シグナルは 100% 非リペイント / 遅延なし 一度出現したシグナルは固定され、点滅・消失しません チャート上の矢印、情報パネル、ポップアップ通知、音声アラート、プッシュ通知に対応 EAとの統合が可能(バッファ出力対応)、自動売買やシグナル
note: this indicator is for METATRADER4, if you want the version for METATRADER5 this is the link:  https://www.mql5.com/it/market/product/108106 TRENDMAESTRO ver 2.5 TRENDMAESTRO recognizes a new TREND from the start, he never makes mistakes. The certainty of identifying a new TREND is priceless. DESCRIPTION TRENDMAESTRO identifies a new TREND in the bud, this indicator examines the volatility, volumes and momentum to identify the moment in which there is an explosion of one or more of these da
「 Dynamic Scalper System MT5 」インジケーターは、トレンド波の中でスキャルピング取引を行う手法のために設計されています。 主要通貨ペアと金でテスト済みで、他の取引商品との互換性があります。 トレンドに沿った短期的なポジションオープンのシグナルを提供し、追加の価格変動サポートも提供します。 インジケーターの原理 大きな矢印はトレンドの方向を決定します。 トレンド波の中では、小さな矢印の形でスキャルピングシグナルを生成するアルゴリズムが機能します。 赤い矢印は強気方向、青い矢印は弱気方向です。 トレンドの方向には敏感な価格変動ラインが描かれ、小さな矢印のシグナルと連動します。 シグナルは次のように機能します。適切なタイミングでラインが現れるとエントリーシグナルが形成され、ラインが開いている間はポジションが保持され、完了すると取引が終了します。 推奨される動作時間枠はM1~H4です。 矢印は現在のローソク足に形成され、次のローソク足が開いている場合は、前のローソク足の矢印は再描画されません。 入力パラメータ Trend Wave Period - トレ
##   ONLY GOLD ##   Тiльки Золото ## **Mercaria Professional Trading Zones - Complete Guide** ## **Mercaria Professional Trading Zones - Повний посібник** ### **How Mercaria Zones Work / Як працюють зони Mercaria** **English:** Mercaria Zones is an advanced trading indicator that identifies high-probability support and resistance areas using ZigZag extremes combined with mathematical zone calculations. The indicator works on multiple timeframes simultaneously, providing a comprehensive view
無料の AUX インジケーターと EA サポ   直接ダウンロード — ここをクリック [ D.I.C.E ] The DICE Indicator Divergence in Chaos Environment は、エリオット波動理論とトレーディングカオス手法を組み合わせて使用するトレーダーのために設計された MT5 専用ツールです。価格変動の中の隠れたおよび通常のダイバージェンスを検出し、ビル・ウィリアムズが説明したカオス市場環境と同期します。 主な特徴 エリオット波動に対応したダイバージェンス検出:波動構造と調和した強気・弱気ダイバージェンスを識別。 カオス手法の統合:AO(オーサムオシレーター)と市場構造に整合。 マルチタイムフレームスキャン:異なる時間枠でダイバージェンスを分析し、トレンドの転換を確認。 視覚的アラートとオブジェクト:チャート上の矢印、ライン、マーカーで即座に識別。 市場適応読解:カオス的状況に自動適応し、ノイズを除去して有効なセットアップを維持。 ブレイクプルバックエントリー手法:シンプルなフィボナッチリトレースメントとピボットポイントを使用。 利点 ダイ
FRONTIER PIVOTS - Geometric Levels Indicator This indicator plots support and resistance levels/ranges on the chart using mathematical calculations. It helps traders identify potential price reaction zones based on geometric patterns. Main Features: Automatically calculates and displays key price levels Plots both support and resistance lines Uses daily price data for level calculation Clean visual presentation with different colors for different level types No repainting - levels remain static
Introduction to X3 Chart Pattern Scanner X3 Cherart Pattern Scanner is the non-repainting and non-lagging indicator detecting X3 chart patterns including Harmonic pattern, Elliott Wave pattern, X3 patterns, and Japanese Candlestick patterns. Historical patterns match with signal patterns. Hence, you can readily develop the solid trading strategy in your chart. More importantly, this superb pattern scanner can detect the optimal pattern of its kind. In addition, you can switch on and off individu
A tool for on-chart strategy backtesting and performance analysis. A utility for developing, debugging, and testing custom trading ideas and indicator functions. An indicator designed to quickly test trading concepts and visualize the effectiveness of different input parameters. An all-in-one sandbox for testing everything from simple crossovers to complex, multi-condition trading systems.
無料のAUXインジケーター、EAサポート、完全ガイドをご利用ください – https://www.mql5.com/en/blogs/post/763955 トレンドを見極める。パターンを読む。エントリーのタイミングを掴む。 30秒以内の3ステップ!分析不要で簡単トレード — あなたのスマートアシスタントがワークフローを簡素化します チャートの過剰な情報にもう悩まされない。 スマートバイアス検出で自信を持ってトレード。 すべての通貨、暗号資産、株式、金属、指数、あらゆる時間足に対応。 クリックして実行するだけ — それだけで十分。 スピードと明快さを求める忙しいトレーダーに最適。 TPTSyncXは、 トレンド、パターン、 ローソク足のトリガー 分析を、洗練されたインテリジェントなビジュアルシステムとしてシームレスに統合する、強力なオールインワンMetaTrader 5インジケーターです。明確さ、正確さ、スピードを求めるトレーダー向けに設計されており、プライスアクション、構造的パターン、市場タイミングツールを組み合わせて、高確率のトレードセットアップを特定するのに役立ちます。 主な
Elliot Waves Analyzer Pro calculates Elliot Waves to Help Identify Trend direction and Entry Levels. Mainly for Swing Trading Strategies. Usually one would open a Position in trend direction for Wave 3 or a Correction for Wave C . This Indicator draws Target Levels for the current and next wave. Most important Rules for Elliot Wave Analysis are verified by the Indicator.  The Pro version analyzes Multiple Timeframes and shows the Subwaves and Target-Levels.   For an Overview  " Elliot Waves Anal
Weis Wave with Alert MT5
Trade The Volume Waves Single Member P.C.
4.94 (17)
Rental/Lifetime Package Options and Privileges  Rent Monthly Six Months   Yearly/Lifetime Weis Wave with Speed with Alert+Speed Index x x x Manual  x x x Quick Set up Video x x x Blog x x x Lifetime Updates x x x Setup and Training Material x x Discord Access Channel "The SI traders"          x Rectangle Break Alert Tool      x How to trade with it:    http://www.tradethevolumewaves.com   ** If you purchase please contact me to setup your  : Training Room and  complete manual access.  Wei
The iChannels
BeeXXI Corporation
5 (2)
Ultra-fast recognition of parabolic channels (as well as linear, horizontal and wavy channels) throughout the depth of history, creating a hierarchy of channels. Required setting: Max bars in chart: Unlimited This indicator is designed primarily for algorithmic trading, but can also be used for manual trading.  This indicator will have a very active evolution in the near future and detailed descriptions on how to apply to create robots
TREND HARMONY MT5 – Multi Timeframe Trend and Phase and Pullback Level Visualizer indicator for Metatrader5 The TREND HARMONY indicator automates deep trend analysis and generates visualizations for you. Take control of your trades by eliminating uncertainty! Revolutionize your trading experience with precision and insight through the TREND HARMONY Multi Timeframe indicator – your ultimate MT5 trend visualization indicator. [  Features and Manual   | MT4 version |   All Products   ] Are you tir
[ MT4 Version ]  [ Kill Zones ]  [ SMT Divergences ] How to trade using Order Blocks:  Click here User Interface Performance:  During testing in the strategy tester, the UI may experience lag. Rest assured, this issue is specific to the testing environment and does not affect the indicator's performance in live trading. Elevate your trading strategy with the  Order Blocks ICT Multi TF  indicator, a cutting-edge tool designed to enhance your trading decisions through advanced order block analysis
Its our anniversary! To give back enjoy this 60% discount for the next week (original price $239) We have combined all of our beloved indicators the likes of: Key level order block ,   Key level supply and demand ,   Key level liquidity grab   and   Key level wedge   into one single indicator and dashboard. Whats new Dashboard : There is an easy access dashboard for all your needs. Multi-timeframe button : There is now a multi-timeframe option for Order Blocks and Supply and demand zones, maki
VWAP Scalping Pro – Advanced VWAP & Market Profile System Professional-Grade VWAP + Market Profile Technology for Precision Trading VWAP Scalping Pro is an advanced analytical tool that integrates Volume-Weighted Average Price (VWAP) analysis with professional Market Profile visualization. It provides traders with institutional-style insights into price structure, volume distribution, and session dynamics — ideal for scalping, intraday, and swing trading strategies. Key Features Triple VWAP St
Hello I Want to introduce The Forex Buy Sell Arrow Premium MT5 i recently release this premium indicator! its 1000% Non Repaint Indicator, It Work Perfectly Well,, i tested it day by day, Just mind blowing Result,  Including Powerful trend Algorithm! How It Work? well, it work market trend formula, when trend Bullish Or when trend Bearish,  Recommend Timeframe M30, H1 it work all timeframe, and all currency pair, 100% non repaint, How to take signal From Forex Buy Sell Arrow Premium Ind
The ChanLun or Chan theory is one of the most popular trading theories in China. But it seems like that it has little influence in western countries. Actually, the Chan Theory is based on a sophisticated mathematical model. The basic idea ChanLun is to simplify the bar chart by its model. With the help of ChanLun, a trader can analyze and predict the trend of future goods, stocks. In ChanLun, there are several basic elements called fractals, strokes, line segments and pivots . A trader should pa
Big Player Range
Thalles Nascimento De Carvalho
5 (3)
BigPlayerRange — MT5向け最強インジケーター BigPlayerRange は、MetaTrader 5 で日経ミニやドル先物などの取引において、 最も効果的なインジケーター と評価されています。大口投資家(機関投資家)の行動を可視化し、高精度なテクニカル分析を可能にします。 どのように機能するのか? BigPlayerRangeは、買い圧力ゾーン(緑ライン)と売り圧力ゾーン(赤ライン)を描画し、価格がその範囲を超えるとトレンド方向への動きを示唆します。 緑のライン上で終値: 買いの勢いが強く、上昇トレンドの可能性。 赤のライン下で終値: 売り圧力が優勢で、下落が予想される。 範囲内での価格: レンジ相場でブレイクを待つ段階。 主なメリット: 機関投資家ゾーンの検出: 大口のエントリーポイントを視覚化。 自動ターゲット計算: 利確ポイントを戦略的に設定。 プルバックの可能性分析: リスク管理に役立つ情報提供。 推奨の使い方: Imbalance DOM Pro と併用してゾーンブレイクを確認。 SwingVolum
Support Resistance Catcher Indicator Features and Explanation Overview: The Support Resistance Catcher is a custom MT5 indicator designed to identify and visualize supply (resistance) and demand (support) zones based on candlestick price action. It detects zones where price has reversed after rallies or drops, using wick rejections and clustering. The indicator draws horizontal rectangles for active and historical zones, with customizable colors, labels, and alerts. Key Features: 1. Zone Det
Enigma 112 Indicator - User Manual Enigma 112 Indicator Complete User Manual - Ultimate Trading Solution Introduction The Enigma 112 is a comprehensive multi-timeframe trading indicator that combines advanced technical analysis concepts including Tesla 3-6-9 Gates, Huddleston Theory, PO3 Dealing Ranges, and sophisticated risk management systems. Tesla 3-6-9 Gates Based on Nikola Tesla's vortex mathematics for precise support and resistance levels Huddleston Theory Volume-based market
VTrende Pro
Andrii Diachenko
5 (1)
VTrende Pro - MTF indicator for trend trading with a display panel for MT5 *** Videos can be translated into any language using subtitles (video language - Russian) Although the signals of the VTrende Pro indicator can be used as signals of a full-fledged trading system, it is recommended to use them in conjunction with the Bill Williams TS. VTrende Pro is an extended version of the VTrende indicator. Difference between Pro version and VTrende: - Time zones - Signal V - signal 1-2 waves -    S
インジケーターは任意のポイントから出来高を分析し、その出来高に対する市場のエグゾースト(疲労)レベルを計算します。 Meravith の主なライン: 強気出来高エグゾーストライン – 目標として機能します。 弱気出来高エグゾーストライン – 目標として機能します。 トレンドライン – 市場のトレンドを示します。市場が強気か弱気かに応じて色が変化し、トレンドサポートとして機能します。 使い方: 紫色の縦線をダブルクリックし、希望の位置に移動してください。 トレンドや調整など、あらゆるものを分析できます。インジケーターを市場の上部、下部、または重要と考える任意のポイントに移動します。良い方法は、市場がエグゾーストラインの間に位置するように Meravith を設定することです。こうすることで、追跡できる明確な目標を持つことができます。 初期のエグゾーストラインがブレイクされた場合、新しいエグゾーストラインが出現し、追加の取引可能なチャネルが形成されます。 エグゾーストに到達した後は、インジケーターの位置を変更するか、別の時間枠に切り替えて新しいエグゾーストレベルを特定できます。 トレンドラ
SYSTEM INTRODUCTION:   The Binary Options Conqueror System Is Specifically Designed For Binary Options Trading. Unlike Other Systems And Indicators That Were Adopted From Other Trading Environments For Binary Options. Little Wonder Why Many Of Such Systems Fail To Make Money . Many End Up Loosing Money For Their Users.     Forward Testing Of The System Has Shown Remarkable Results . The Results Of Forward Testing On Live Trading Account Is Consistent With The Results Obtained By Back Testing .
ChartMaster Heikin Ashi with Pivot Indicator for MT5 Take your trading to the next level with ChartMaster Heikin Ashi with Pivot Indicator , a powerful tool that combines the clarity of Heikin Ashi candles with advanced pivot-point analysis. This indicator is designed for traders who want to identify market trends, reversals, and key support/resistance zones with precision. Key Features: Heikin Ashi Visualization – Smooths out market noise for cleaner trend identification. Automatic Pivot
作者のその他のプロダクト
Nuage Trend Pro – トレンド追跡&Kijunシグナル Nuage Trend Pro は MetaTrader 5 用の高機能インジケーターで、 強い市場トレンド を素早く把握し、Kijunクロスを利用して 最適なエントリーポイント を見つけることができます。チャートを わかりやすいビジュアルマップ に変換し、 正確で自信のあるトレード をサポートします。 主な機能 自動Kijunクロス検出 :価格が基準線を横切る重要な瞬間を瞬時に表示。 動的トレンドクラウド :市場の方向に応じてチャートの色が変化。上昇は緑、下降は赤。 明確な買い/売りシグナル :エントリーポイントを素早く確認可能。 カスタマイズ可能な設定 :Kijun期間、クラウドの色、表示スタイルを戦略に合わせて調整可能。 Nuage Trend Proを選ぶ理由 シンプルで直感的なトレンド可視化 。 多用途 :すべての時間足や取引対象(FX、指数、商品)で使用可能。 初心者から上級者まで 、エントリー・エグジットの最適化に最適。 他のインジケーターや戦略との併用も容易 。
日本語 (Japonais) – Weekly Levels Pro Weekly Levels Pro – 週間主要レベル は MetaTrader 5 向けのシンプルかつ強力なインジケーターで、各取引週の最も重要な4つのレベルを自動的に表示します: 週間高値 (Weekly High) → 自然なレジスタンス 週間安値 (Weekly Low) → 自然なサポート 週間始値 (Weekly Open) → トレンドの基準点 週間終値 (Weekly Close) → 強気・弱気の指標 特徴: 新しい週の開始時に自動更新 チャート上で分かりやすく表示 主要なサポート・レジスタンスを迅速に特定 外国為替、株価指数、商品、暗号資産に対応 シンプルな設定 – 複雑な調整は不要
Pin Bar Pro v1.0 – MQL5 インジケーター 説明: Pin Bar Pro は MetaTrader 5 用のプロフェッショナルインジケーターで、 Pin Bar を自動検出します。市場反転を予測するのに便利です。 青い矢印 → 買いシグナル 赤い矢印 → 売りシグナル 特徴: Pin Bar の自動検出 カスタマイズ可能な矢印 ( Arrow_Up_Code , Arrow_Down_Code ) 垂直オフセット調整 ( Arrow_Offset_Pts ) すべてのシンボルとタイムフレームで使用可能 パラメータ: パラメータ 説明 デフォルト Arrow_Up_Code 買い矢印コード 233 Arrow_Down_Code 売り矢印コード 234 Arrow_Offset_Pts 垂直オフセット (ポイント) 10 作者: KOUAME N’DA LEMISSA バージョン: 1.0 – MQL5用
4. 日本語 (Japonais) インジケーター Monthly Levels + Pin Bar Pro 説明 Monthly Levels + Pin Bar Pro は、 月足の主要レベル(高値、安値、始値、終値) と プライスアクション反転パターン(ピンバー) の自動検出を組み合わせたインジケーターです。 テクニカルトレーダーや機関投資家向けに設計され、市場の反応ゾーンを予測し、チャート上に明確なシグナルを表示します。 主な機能 月次レベルを自動表示 :高値、安値、始値、終値。 ピンバー検出 (強気・弱気)リアルタイム。 視覚的にわかりやすい表示 :水平ライン + シグナル矢印。 ️ カスタマイズ可能 :タイムフレーム、矢印コード、サイズ、オフセット。 最適化済み :軽量、スキャルピングやスイング取引に最適。 ️ EA互換 :自動売買戦略に統合可能。 ️ 使い方 任意のタイムフレームのチャートに追加します。 月次の 高値、安値、始値、終値 が自動で表示されます。 矢印を確認: 青い矢印 → 強気ピンバー (月次サポー
6️⃣ 日本語 (Japanese) バージョン: 1.0 開発者: KOUAME N'DA LEMISSA プラットフォーム: MetaTrader 5 (MT5) タイプ: テクニカル指標 / 年間価格レベル 説明: Yearly Levels Pro v1.0はKOUAME N'DA LEMISSAによって開発され、年間の主要価格レベルを迅速に特定できる強力なインジケーターです。指定した年の 始値、最高値、最安値、終値 を自動計算し、チャート上に色付き水平線で表示します。 主な機能: High(赤)、Low(青)、Open(緑)、Close(オレンジ) Year_Shift で年を選択 全ての通貨ペア・タイムフレームに対応 リアルタイム自動更新 パラメータ: Year_Shift : 0 = 当年、1 = 前年、等 特徴: 直感的で簡単 年間のサポート/レジスタンスを特定 長期トレード分析に最適 使用のヒント: High/Lowラインでサポートとレジスタンスを確認 現在価格をOpen/Closeと比較してトレンド分析 他のインジケーターやローソク足パターンと併用
. Japanese Version (日本語) Quarterly Levels Pro v1.0 – 商業通知 製品名: Quarterly Levels Pro v1.0 開発者: KOUAME N'DA LEMISSA バージョン: 1.0 説明: Quarterly Levels Pro は KOUAME N'DA LEMISSA によって開発された MetaTrader 5 用のプロフェッショナルインジケーターで、四半期ごとの High, Low, Open, Close レベルを自動表示します。トレーダーはチャート上で重要なサポートおよびレジスタンスゾーンを明確に視覚化でき、中期取引の意思決定を容易にします。 主な機能: 四半期ごとの High, Low, Open, Close レベルを自動表示。 各レベルの色をカスタマイズ可能: High: 赤 Low: 青 Open: 緑 Close: オレンジ 線の幅を調整して視覚的に区別可能。 Quarter_Shift パラメータを使用して、 現在、前四半期、またはそれ以前の四半期 のレベルを表示可能。 MT5 のすべ
日本語 (Japonais) 説明 Multi-Timeframe Levels Pro v1.0 は、チャート上に自動的に 日足・月足・四半期・年足 の高値、安値、始値、終値を描画します。 重要なサポートやレジスタンス、ブレイクアウトゾーンを特定するのに最適です。 特徴 Daily / Monthly / Quarterly / Yearly のレベルを自動表示 高値・安値・始値・終値を色分け表示 過去の期間を分析するための Shift パラメータ FX、株式、指数、商品、暗号資産 に対応 軽量で高速、 プライスアクション、スイング、スキャルピング に最適 パラメータ DailyShift → 当日または前日 MonthlyShift → 当月または前月 QuarterlyShift → 当四半期または前四半期 YearlyShift → 当年または前年 推奨使用法 年足・四半期レベルで大きなゾーンを確認し、日足・月足レベルで短期取引に活用してください。
Commercial Description – Marubozu Pro (MT5) Description Marubozu Pro is a professional indicator for MetaTrader 5 that automatically detects Marubozu candles (bullish and bearish) directly on your chart. It helps traders identify strong market momentum where buyers or sellers take full control, by displaying clear visual arrows for buy and sell signals. This tool is designed to be simple, effective, and fast , perfect for manual trading or as a filter in automated strategies. Key Features
ETE Detector – Head & Shoulders Indicator Turn your charts into clear and actionable trading opportunities! About the Indicator The ETE Detector automatically identifies Head & Shoulders (H&S) and Inverse Head & Shoulders (IH&S) patterns — classic trend reversal formations. No more spending hours searching manually: your analysis becomes fast, accurate, and visual . What You Get Automatic detection of trend reversal patterns Colored arrows : green for buys (Inverse H&S), red for sell
Fusion Monthly Levels + PinBar + Marubozu 説明 このユニークなインジケーターは、3つの強力なテクニカル分析ツールを1つに統合しています: 月間レベル(High, Low, Open, Close) – 重要なサポート・レジスタンスゾーンを特定するため。 PinBar 検出 – 信頼性の高い反転ローソク足パターンで、価格の反発を示します。 Marubozu 検出 – 強いトレンドローソク足で、方向性のあるモメンタムを示します。 この融合により、 視覚的で包括的、かつ反応の速い 市場予測ツールを手に入れることができます。 利点 機関レベルの価格帯 + プライスアクションを組み合わせ。 明確な視覚シグナル:PinBar は青/赤の矢印、Marubozu は青/赤の四角で表示。 全ての資産で使用可能(FX、指数、暗号通貨、コモディティ、株式)。 カスタマイズ可能なパラメーター(参照期間、ヒゲのサイズ、矢印のスタイル)。 コード最適化済み、複数チャートでも遅延なし。 MetaTrader 5 完全対応。 シグナル ブルッシュ PinB
ABCD Lemissa + 月足レベル + ピンバー + マルボウズ 指標 説明 このインジケーターは、 複数の強力なツールを統合 して、市場の全体像を提供します。 ABCD Lemissa – ABCD構造 を自動検出し、 A、B、C、D のポイント、サポート/レジスタンスゾーン、買い/売り矢印を表示します。 月足レベル (Monthly Levels) – 月足ローソク足の High、Low、Open、Close レベルを表示し、重要なゾーンを特定します。 ピンバー & マルボウズ – ピンバー (反転シグナル)および マルボウズ (強トレンドローソク足)を自動検出し、カスタマイズ可能な矢印やシンボルを表示します。 このインジケーターは完全に 視覚的 で、ライン、矢印、矩形を組み合わせて、市場分析と取引判断をサポートします。 主な機能 ABCD Lemissa A、B、C、Dのポイントを自動検出 BUY および SELL シグナル矢印 X1 / X2 矩形でサポート・レジスタンスゾーンを強調 月足レベル 月足ローソク足の High、Low、Open、Close のライ
Order Block Pro (MQL5) – バージョン 1.0 作成者: KOUAME N'DA LEMISSA プラットフォーム: MetaTrader 5 説明: Order Block Pro は、チャート上の**強気および弱気のオーダーブロック(Order Blocks)**を自動で検出する高度なインジケーターです。小さな保ち合いローソク足と、その後の強いインパルスローソク足を分析することで、価格が加速する可能性のある重要なゾーンを特定します。 トレーダーに最適: 正確なエントリーとエグジットポイントを特定したい方。 動的なサポートおよびレジスタンスゾーンを把握したい方。 リスク管理と取引戦略を向上させたい方。 主な機能: 強気OB検出: 保ち合いローソク足の後、強い上昇が発生した場合、緑色の矢印で表示。 弱気OB検出: 保ち合いローソク足の後、強い下落が発生した場合、赤色の矢印で表示。 完全にカスタマイズ可能: 保ち合いローソク足の最大実体比率 ( BodyMaxRatio ) 次のローソク足の最小比率で動きを確認 ( NextCandleMinPct ) チャー
ETE Detector v4.0 (Head & Shoulders) Author: KOUAME N’DA LEMISSA Version: 4.0 Platform: MetaTrader 5 Indicator Type: Chart / Visual Trading Signals Overview The ETE Detector v4.0 is a technical indicator designed to automatically detect classic and inverse Head & Shoulders patterns (H&S) on MT5 charts. These patterns are widely used to anticipate trend reversals. With this tool, traders can: Detect sell signals (classic H&S) and buy signals (inverse H&S) with accuracy. Easily visualize patterns
Description – ETE DETECTOR POWER v5.0(ヘッド&ショルダープロ) 「ヘッド&ショルダー」パターンの自動検出 PUISSANCE DU DÉTECTEUR ETE v5.0 , トレーダーが 市場の大きな反転を事前に捉えるた めのプロ仕様ツールです。最も強力なチャートパターンの1つである ヘッド et ショルダー(H&S)と逆ヘッド&ショルダー を利用します. Description du produit (MaxObjects) 、混雑したチャートや複数時間枠でもスムーズかつ見やすく表示されます。 主な機能 リアルタイム自動検出: 通常H&S(売り) と 逆H&S(買い) Mots clés :  肩, 頭, ​​ネ ッ ク ラ イ ン 自動描画: 反転ゾーン (赤=売り、緑=買い) ACHETER/ VENDRE 循環オブジェクトプール によるスマート管理 完全カスタマイズ可能:ローソク本数、最小距離、許容差、最大パターン数、矩形スタイル、マーカーサイズ・色 トレーダーへの利点 時間節約:市場を自動分析 度:許容範囲調整
Dynamique mensuelle des plages hautes et basses v1.0 Auteur : KOUAME N'DA LEMISSA Description : L' indicateur dynamique mensuel de fourchette haute et basse affiche les niveaux mensuels clés sur votre graphique grâce à des fonctionnalités avancées de suivi dynamique. Il permet aux traders de visualiser facilement les zones de support et de résistance mensuelles, ainsi que les zones où le prix tend à dépasser ou à tester ces niveaux, offrant ainsi des opportunités de trading précises. P
月次ハイ&ロー ダイナミックレンジ + 流動性ゾーン v1.2 作成者: KOUAME N'DA LEMISSA 説明: この強力なインジケーターで市場分析を変革しましょう。特徴は以下の通りです: 主要月次レベル: 高値(High)、安値(Low)、始値(Open)、終値(Close)で、最も重要なサポート・レジスタンスゾーンを特定。 ダイナミックハイ/ロー範囲: 価格の極端な動きを自動追跡し、重要な市場変動を検出。 流動性ゾーン: 流動性が集中するエリアを示す視覚的な矩形(Buy/Sell)。ゾーンの太さや色は完全にカスタマイズ可能で、チャート上での視認性を最大化。 全ての銘柄・ブローカー対応: Forex、株式、指数、暗号通貨で完璧に動作。 主な機能: 月次のHigh、Low、Open、Closeレベルを自動検出。 極端な動きを追跡するダイナミックハイ/ロー範囲の表示。 境界線の太さや色をカスタマイズ可能な視覚的流動性ゾーン。 すべてのタイムフレームに対応。 トレードスタイルに合わせて完全にカスタマイズ可能な設定。 インジケーター設定: Ref_Timeframe: レベル計算
Japonais (Japonais / 日本語) Booster Trading Pro par exemple  : KOUAME N'DA LEMISSA . 明 Trading de rappel Pro を使って市場分析を変革しましょう。複数のLa description de la situation est : Description du produit  : Il s'agit d'un article : ダイ ナミックオープニングレンジ : Nom du produit :  ダイナミックで色分けされた長方形で潜在的な買い・売りゾーンを視覚化。 主な特徴 すべての銘柄と時間軸に対応。 ダイナミックレベルを リアルタイム 更新. 柔軟なゾーン表示のために色や太さをカスタマイズ可能。 月次レベルとダイナミック範囲を明確に表示。 MetaTrader 5 est basé sur MetaTrader 5 . トレーダーへの利点 迅速な意思決定: 重要なゾーンを素早く特定可能。 Description du produit : Nom du produit  :
Channel Ultima – Indicateur Multi-Canal Dynamique Description courte Channel Ultima est un indicateur avancé qui trace automatiquement trois canaux dynamiques du marché. Il offre une lecture claire des zones de support, de résistance et d'équilibre , idéale pour les traders techniques et structurels. Présentation détaillée Channel Ultima détecte et affiche trois canaux indépendants associés sur les pivots majeurs et mineurs du marché. Chaque canal représente une zone de pression sur le p
Carte de liquidité institutionnelle Pro Voyez ce que voient les institutions — avant tout le monde Aperçu Institutional Liquidity Map Pro est un indicateur professionnel conçu pour cartographier les zones de liquidité institutionnelle à l'aide des niveaux mensuels les plus hauts et les plus bas . Il détecte automatiquement les zones de stop-hunt , les zones de retournement potentiel et les zones d'accumulation/distribution institutionnelles . L'indicateur suit dynamiquement jusqu'à trois ni
フィルタ:
レビューなし
レビューに返信