Powerful Pivot Point Weekly

Pivot_Point_Weekly — clear, uncluttered weekly pivots for MT5

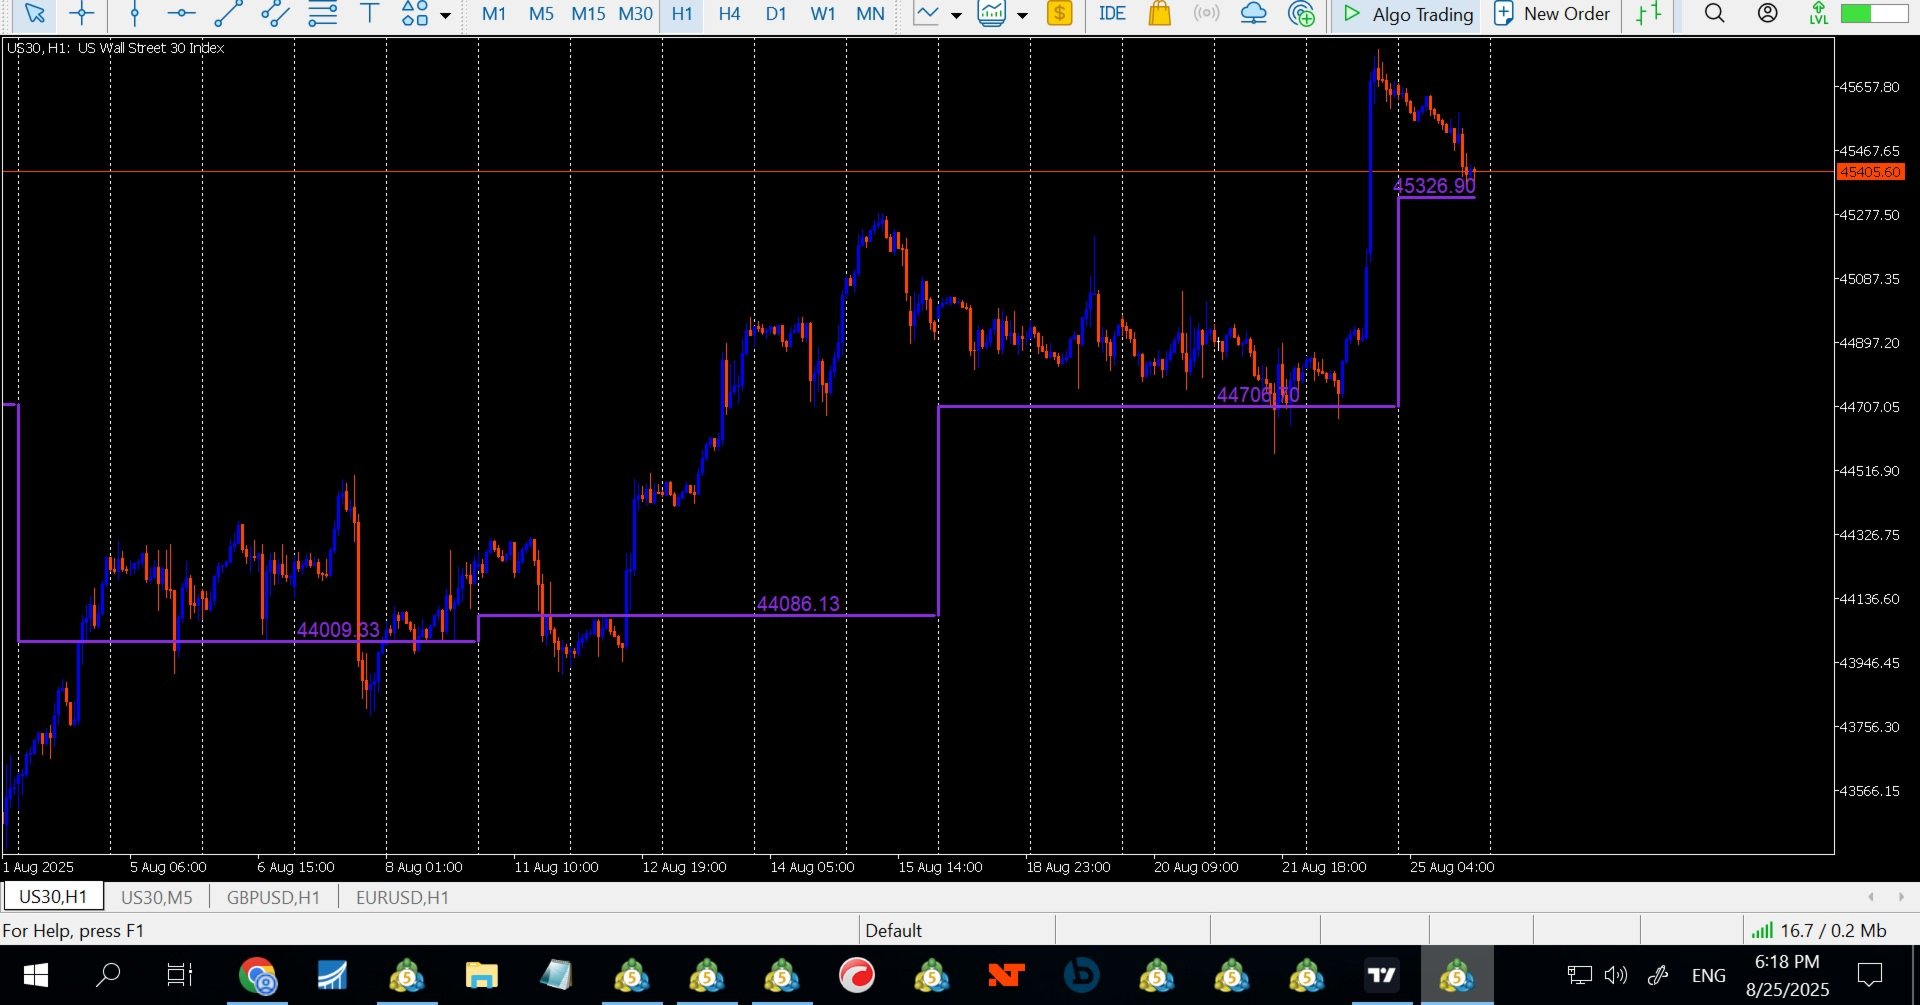
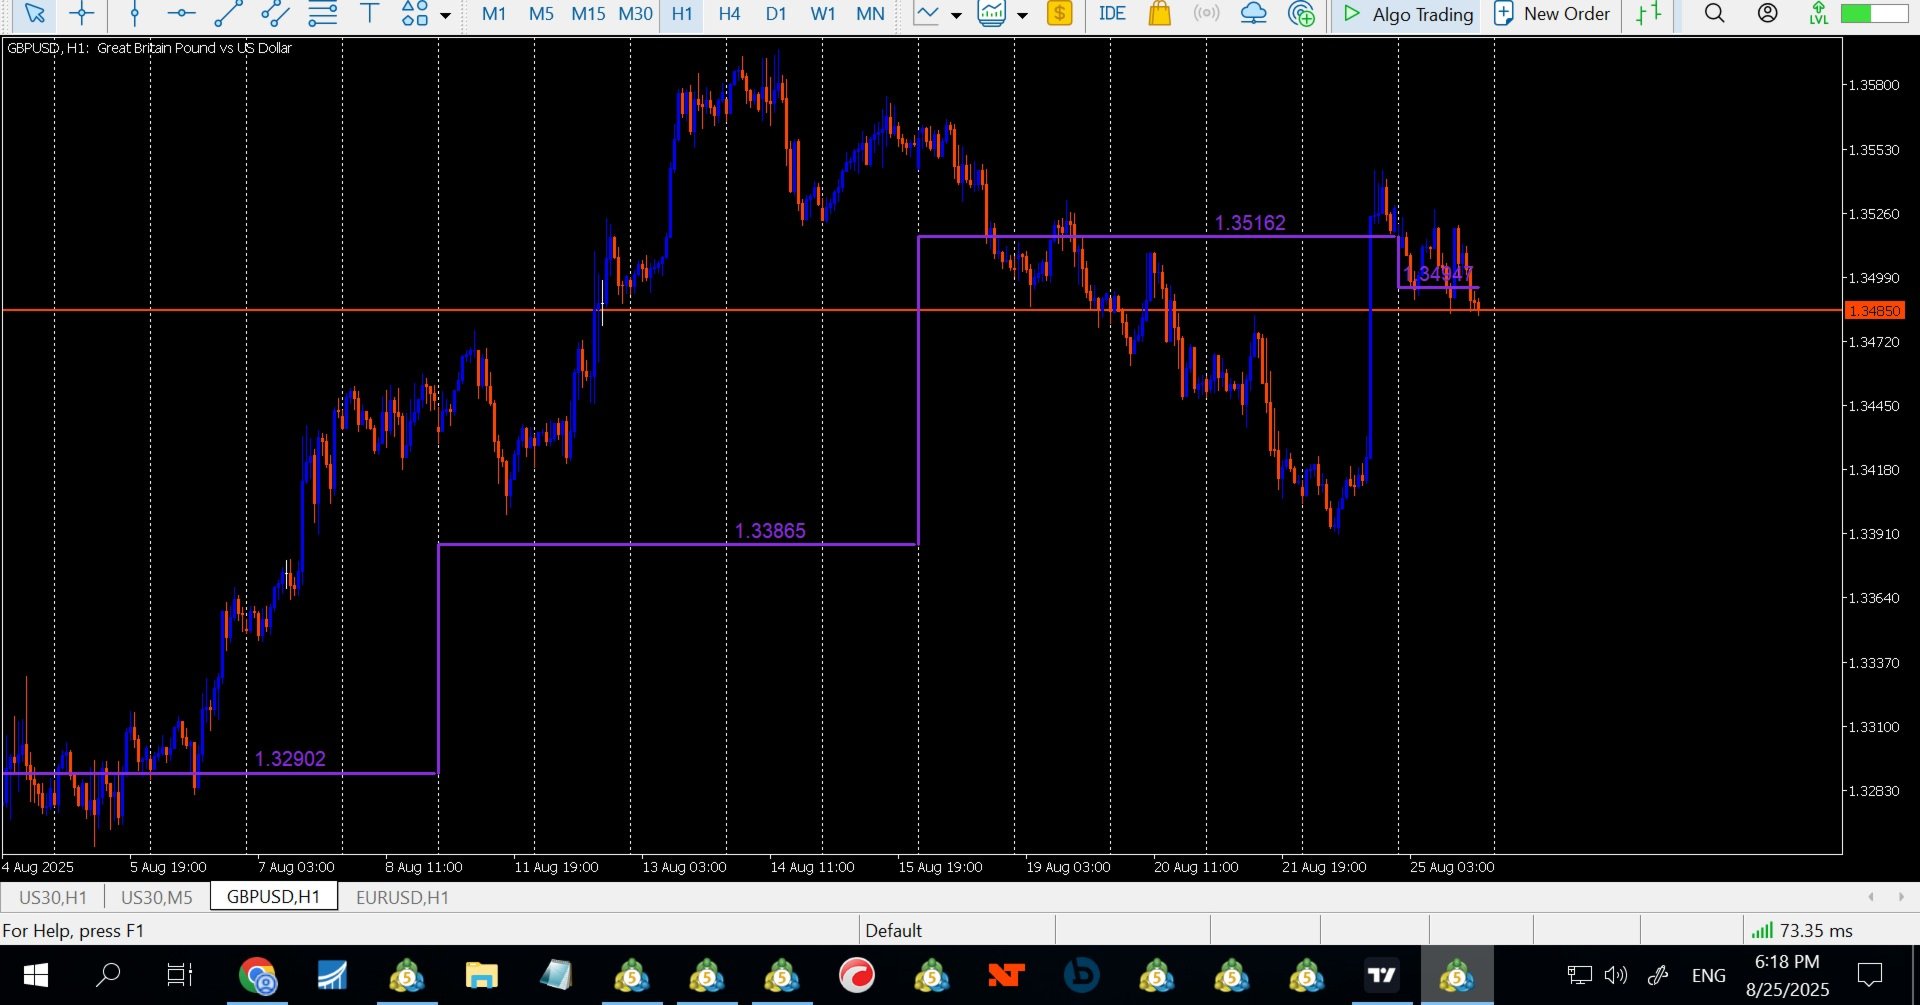
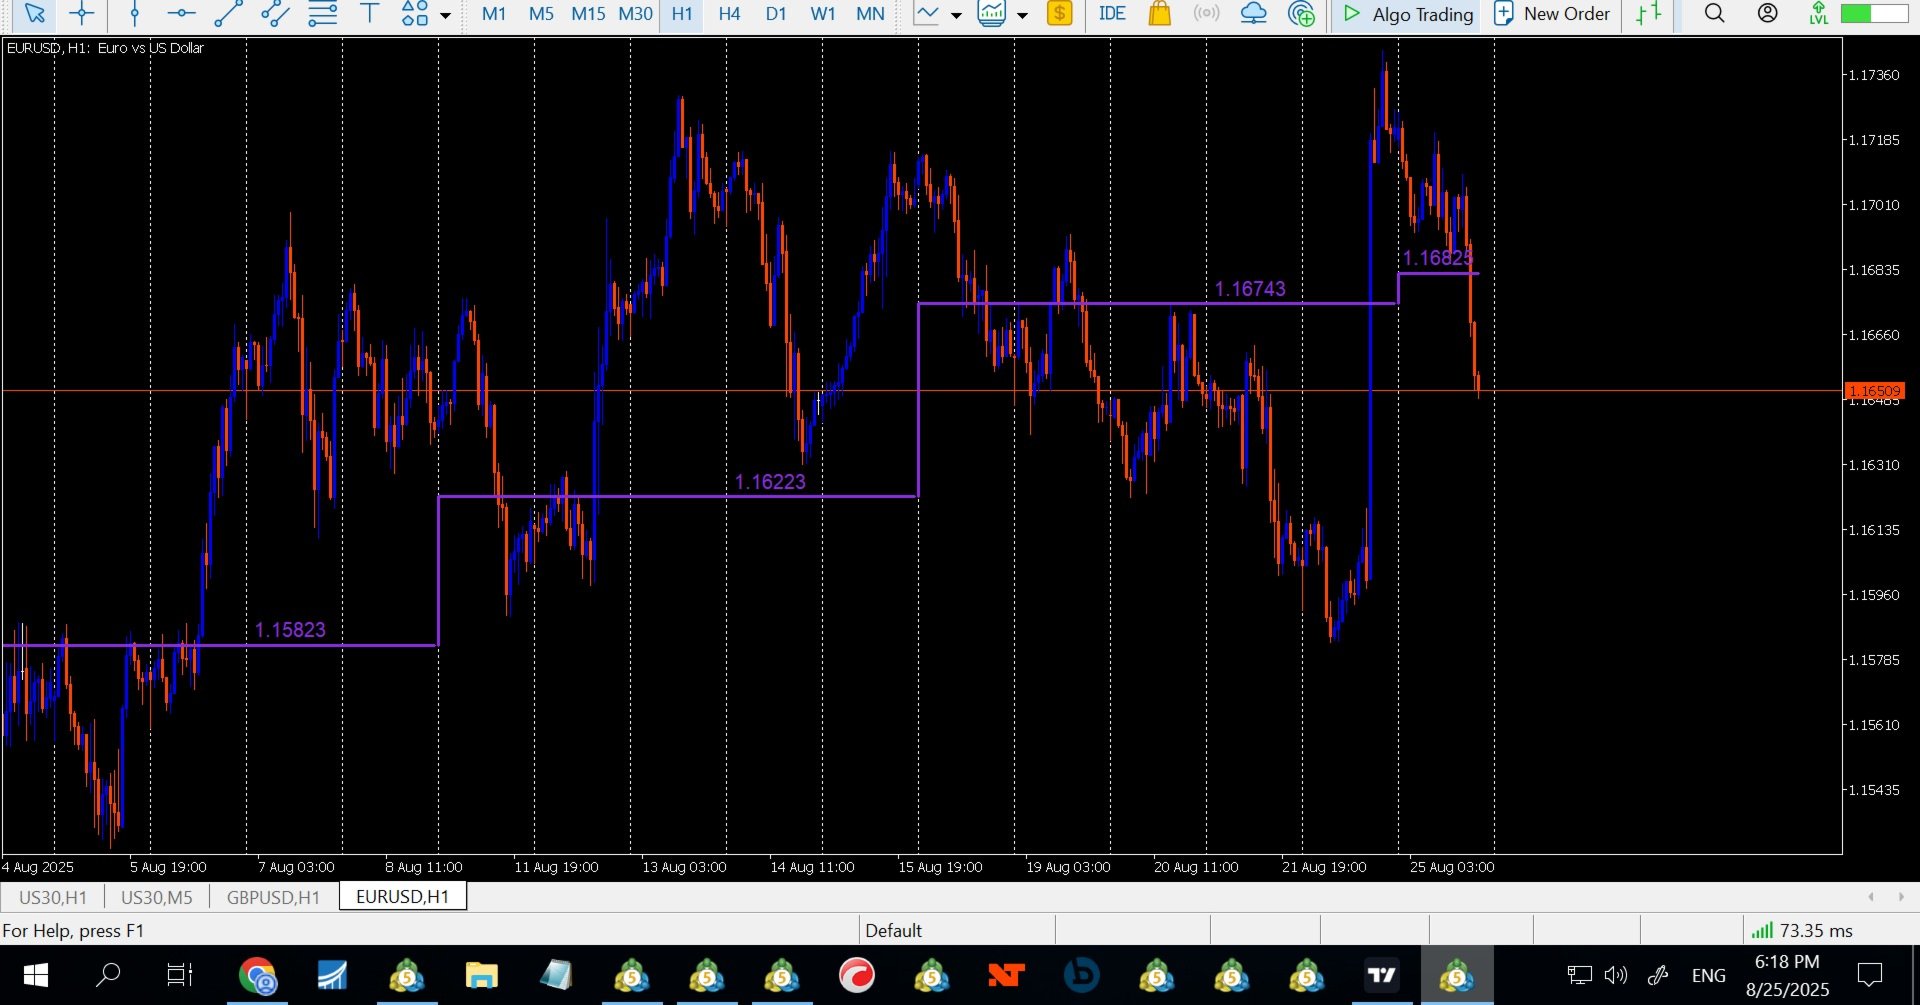
Pivot_Point_Weekly plots one thing and does it exceptionally well: the classic weekly pivot (P) calculated from the previous week’s high, low, and close. It renders each week’s pivot as a clean horizontal “step,” with short, perfectly vertical joins from week to week so you can see the regime shifts at a glance—without cluttering your chart with a forest of levels.

This indicator is intentionally minimalist: no S1/R1 ladders, no fib variations, no autoscaling circus. Just the weekly “balance price” the market respected (or rejected), displayed in a way that works on any timeframe and for any symbol you trade.

What is a weekly pivot—and why it matters

A pivot point is a simple average of price that old-school floor traders used to map out the day’s likely “balance” area. The classic formula is:

Pivot (P) = (High + Low + Close) / 3

While this calculation is typically applied to the previous day for intraday trading, many swing traders and systematic intraday traders rely on the previous week’s pivot. Weekly pivots have a few advantages:

  • Noise reduction: Weekly data smooths the random chop you often get on daily pivots.

  • Institutional rhythm: Many funds and desks rebalance and reassess on weekly cycles. Prior-week balance levels often act as “gravity.”

  • Context on lower timeframes: On M1–H1 charts, the weekly pivot acts like a slow, steady mean—great for confluence.

In practice, the weekly pivot behaves like a fair-value magnet. Price often mean-reverts toward it when stretched, or it uses it as an intrawEEK “spine” during trends.

What makes this indicator different

  • Only the essential level: Plots the previous-week classic pivot (P)—nothing else—so your eye isn’t distracted by five support/resistance tiers you don’t plan to trade.

  • Step-style rendering: Each week is a crisp horizontal segment; between weeks you get a short vertical join. The result looks like a “snake” that moves only when the underlying weekly balance changes—perfect for regime reading.

  • Time-aware starts: A Start Offset (minutes) lets you align the Monday boundary to the market you trade (e.g., indices with a Sunday micro-session). No more “half Sundays” bleeding into your week.

  • Labelled prices: Each step carries its price label above the line so you always know the exact level.

  • Broker-agnostic week separators: The indicator picks Monday opens from D1 data and draws weekly bars from W1 to compute pivots, keeping boundaries stable.

  • Ultra-light: Uses chart objects (trend lines and text) rather than heavy buffers or recalcs. It idles quietly and refreshes on a short timer or on new weekly data.

Inputs (defaults shown)

  • Weeks to draw ( InpLookbackWeeks = 52 )
    How many weekly steps to render back in time.

  • Color ( InpColor = BlueViolet )
    The line + label color. Keep it high-contrast against your chart.

  • Line & join width ( InpLineWidth = 3 )
    Thickness of both horizontals and the short vertical joins.

  • Price label font size ( InpFontSize = 10 )
    Font size for the pivot price printed above each line.

  • Price label offset (points) ( InpTextOffsetPoints = 10.0 )
    How far above the line the label sits (in symbol points).

  • Draw current week to NOW / Next Monday ( InpExtendToNextMon = false )

    • false (default): The current week’s step draws only up to “now.”

    • true: The current week’s step draws all the way to next Monday—handy for cleaner screenshots or forward planning.

  • Start offset (minutes) ( InpStartOffsetMin = 60 )
    Shifts the Monday boundary forward by N minutes.

    • Indices / CFDs with Sunday micro-sessions: 60 is a sensible default to avoid starting the week at an illiquid Sunday print.

    • FX: 0 is often fine (use broker time).

  • Auto-recheck every N seconds ( InpRebuildSecs = 3 )
    Micro-refresh cadence. Lightweight; leave it as is unless you want it slower.

Note: We removed miscellaneous “status labels” from both the code and the inputs so the user window is cleaner and clients can’t break anything by toggling non-essential switches.

Quick start

  1. Attach the indicator to any chart and timeframe (it’s timeframe-agnostic).

  2. If you trade US30/US100/US500 or cash indices, keep Start Offset = 60 to ignore the thin Sunday (broker-time dependent).

  3. If you trade FX, set Start Offset = 0 unless your broker’s “Monday” opens awkwardly early.

  4. Decide whether you want the current week’s line to run to now (default) or to next Monday (aesthetics/screenshots).

  5. Keep the default BlueViolet, width 3 unless your theme demands otherwise.

You’ll see a ladder of horizontal steps—each the prior week’s pivot—with tight vertical hops between them. The price label sits just above each step.

How to use the weekly pivot in practice

Think of the weekly pivot as both context and actionable level.

1) Mean reversion “back to fair value”

  • When price stretches far from the weekly P and momentum stalls (e.g., lower-timeframe divergence, exhaustion wicks), a rotation back toward P is common.

  • Entries: look for confirmation on your chosen lower timeframe (e.g., M15/M5 structure break) in the direction of the move back to P.

  • Exits: partial near P, trail the rest in case it “overshoots and hugs.”

2) Trend alignment (use P as a spine)

  • In strong directional weeks, price may ride one side of P.

  • Use the pivot as a dynamic bias filter: bias long above P, short below P—but demand structure confirmation; don’t use P alone.

3) Pullback-to-pivot continuation

  • In uptrends: watch for a pullback to P that holds and flips back up—often a high-R multiple entry.

  • In downtrends: mirror logic from above.

4) Opening drive / weekly reprice

  • Monday–Tuesday often see a decisive push away from last week’s balance.

  • If the new week blasts through P and holds, don’t fight it; treat P as broken structure, and look for continuation trades in the break direction.

5) Confluence with other structure

  • Weekly P + HTF levels (prior weekly high/low), VWAP, session opens, or round numbers strengthens the zone.

  • One clean level + one clean trigger > three noisy indicators.

Pro tip: Use the vertical joins as mental “regime switches.” Large vertical hops from week to week signal a meaningful shift in weekly balance—be slower fading those.

Why weekly instead of daily pivots?

  • Cleaner signal: Daily pivots are popular but can be very reactive (and noisy) in fast markets. Weekly pivots update less often and reveal the bigger mean.

  • Fewer fake-outs: Weekly pivots aren’t whipsawed by a single unexpected news candle the way daily pivots can be.

  • Better for swing and structured intraday: If you plan trades over multiple sessions, weekly pivots give you a durable backbone.

If you love daily pivots, keep them—but add the weekly P for higher-timeframe context. Many traders find the combo reduces overtrading and improves target selection.

Settings playbook by market

  • US indices (cash CFDs): Start Offset = 60 (or 90) often lines the “Monday start” with the meaningful cash-session handoff on your broker.

  • FX majors: Start Offset = 0 . If your broker’s Monday D1 candle includes a tiny Sunday sliver that skews your week, try 30–60.

  • Crypto: Because markets run 24/7, weekly boundaries matter even more. Keep Offset = 0 ; use the weekly P as your “week spine.”

Risk and trade management ideas

  • Stops: Don’t hide stops on the pivot. Place them beyond the structure you’re trading (e.g., above a swing high if shorting a failure to reclaim P).

  • Targets: For mean-revert trades, P itself is a rational first target. In trend trades, P can be the entry or add-on trigger rather than the target.

  • Sizing: Weekly pivots are HTF levels—give your trades breathing room or drop to a lower timeframe for precision entries.

  • News: Weekly pivots survive most single data releases, but major macro events (CPI, NFP, FOMC, central bank) can reset behavior around the pivot. Have a rule.

Common mistakes to avoid

  • Treating P as a wall: The pivot is not a brick wall. It’s a balance estimate. Price often travels through it, pauses, then chooses a side.

  • Ignoring context: Always ask, “Are we trending or balancing?” The same level behaves differently in each regime.

  • Overfitting offsets: Use Start Offset to fix obvious boundary issues, not to cherry-pick a perfect backtest.

  • Stacking indicators: Simplicity is the edge here. One clean level + clear price action usually beats five conflicting tools.

Installation & usage notes (MT5)

  1. Copy Pivot_Point_Weekly.mq5 to MQL5/Indicators/ and compile.

  2. Drag Pivot_Point_Weekly from the Navigator onto any chart.

  3. Configure Start Offset for your symbol type (60 for indices, 0 for FX is a good baseline).

  4. Set Extend to Next Monday to true if you want a full-length current week line for screenshots; otherwise leave at false.

  5. Keep Lookback = 52 unless you need fewer steps for visual clarity.

The indicator self-updates on a short timer and on new weekly bars. It’s extremely light; you can run it on your main workspace without lag.

Under the hood (for the curious)

  • Weekly pivot values come from W1 data: P = (H + L + C) / 3 using the previous week’s OHLC.

  • Weekly boundaries (the step start/stop) are aligned via D1 Mondays, then shifted by your Start Offset (minutes) to suit instruments with off-hours trading or Sunday micro-sessions.

  • Steps are drawn as trend objects (no rays), joins are perfectly vertical (both points at the same timestamp), and labels are text objects placed just above each step with your chosen offset.

Example workflows

  • Scalper who respects HTF: Trade your usual M1–M5 triggers, but check: are we above or below weekly P? Fade trades against P only with exceptional structure; otherwise, let P be your “risk-on/off” switch.

  • Intraday mean-revert: When price stretches away from P during London/NY and stalls, hunt reversions into P. Exit partial at P; keep a runner for an overshoot.

  • Swing alignment: On H4/D1, if price reclaims P early in the week and the vertical join shows a sizable upward shift from last week, set a bullish bias until proven otherwise.

FAQ

Does it repaint?
No. Each weekly pivot is fixed once the prior week closes. The current week’s line length grows with time (if you set “to now”), but the value for that week does not change once it’s defined.

Why don’t you draw S1/R1 etc.?
Clarity. Many traders only use the weekly P for context and a single actionable level. If you want a full ladder, you can stack a separate S/R indicator on top—but most find the chart cleaner (and decision-making faster) with just P.

My broker’s “Monday” seems odd. What should I do?
Use Start Offset. If your Monday begins on a Sunday micro-session, add 30–90 minutes so the first “Monday” time slice lines up with the deeper-liquidity open. The default 60 suits many index CFDs.

What if I want screenshots without the line cutting off mid-week?
Set Extend to Next Monday = true. That draws the current step forward to the next Monday boundary (great for product cards or documentation).

A few trading tips

  • Combine the weekly pivot with last week’s high/low. When P sits near that range mid-point, expect balance; when the new week opens far from P, expect reprice toward it (or a strong hold away from it).

  • Use time-of-day/session. A reclaim of P during the NY cash session carries different weight than a reclaim at 2 a.m. your broker time.

  • Keep a journal of how your instrument behaves relative to P. Every market has quirks. Some hug the weekly pivot for hours; others treat it as a launchpad.

  • Risk first. Pivots are tools, not guarantees. Size modestly and let structure, not hope, decide your exit.


Pivot_Point_Weekly gives you the weekly market “fair value” in the cleanest possible way: one level per week, drawn as an easy-to-read step, labeled, and aligned to sensible week boundaries.


Рекомендуем также
Overview Harmonic Patterns MT5 is a technical analysis indicator designed for the MetaTrader 5 platform. It identifies and displays harmonic price patterns, such as Butterfly, Cypher, Crab, Bat, Shark, and Gartley, in both bullish and bearish directions. The indicator calculates key price levels, including entry, stop loss, and three take-profit levels, to assist traders in analyzing market movements. Visual elements and customizable alerts enhance usability on the chart. Features Detects six ha
Версия MT4   |   FAQ Индикатор Owl Smart Levels – это полноценная торговая система внутри одного индикатора, которая включает в себя такие популярные инструменты анализа рынка как усовершенствованные фракталы Билла Вильямса , Valable ZigZag, который строит правильную волновую структуру рынка, а также  уровни Фибоначчи, которые   отмечают точные уровни входа в рынок и места взятия прибыли. Подробное описание стратегии Инструкция по работе с индикатором Советник-помошник в торговле Owl Helper При
Market Trend Indicator Analog 2025, Хосе Мария Молина Санчес molinatrader67@gmail.com | Версия 1.00 Введение Market Trend Indicator Analog — это продвинутый индикатор, разработанный для измерения силы и направления тренда на рынке в режиме реального времени. В отличие от традиционных осцилляторов, этот индикатор использует адаптивную систему фильтрации, которая динамически реагирует на условия рынка, предоставляя точное аналоговое представление в диапазоне от -100 до +100. Его диза
Это, пожалуй, самый полный индикатор автоматического распознавания гармонического ценообразования, который вы можете найти для платформы MetaTrader. Он обнаруживает 19 различных паттернов, воспринимает проекции Фибоначчи так же серьезно, как и вы, отображает зону потенциального разворота (PRZ) и находит подходящие уровни стоп-лосс и тейк-профит. [ Руководство по установке | Руководство по обновлению | Устранение неполадок | FAQ | Все продукты ] Он обнаруживает 19 различных гармонических ценов
Premium level - это уникальный индикатор с точностью правильных прогнозов  более 80%!  Данный индикатор тестировался более двух месяцев лучшими Специалистами в области Трейдинга!  Индикатор авторский такого вы больше не где не найдете!  По скриншотах можете сами увидеть точностью данного инструмента!  1 отлично подходит для торговли бинарными опционами со временем экспирации на 1 свечу. 2 работает на всех валютных парах, акциях, сырье, криптовалютах Инструкция: Как только появляется красная стре
Noize Absorption Index - is the manual trading system that measures the difference of pressure between bears forces and bulls forces. Green line - is a noize free index that showing curent situation. Zero value of index shows totally choppy/flat market.Values above zero level shows how powerfull bullish wave is and values below zero measures bearish forces.Up arrow appears on bearish market when it's ready to reverse, dn arrow appears on weak bullish market, as a result of reverse expectation.
Индикатор определяет и отображает на графике паттерн М. Гартли "Бабочка". Выделение паттерна производится по вершинам индикатора ZigZag (включен в ресурсы, не требует допопнительной установки). В момент распознавания паттерна выводится сообщение во всплывающем окне, отправляются оповещения на мобильное устройство и электронный почтовый ящик. Схема паттерна и параметры волн приведены на скриншоте. Параметры, заданные в индикаторе по умолчанию, являются демонстрационными для увеличения количества
The RSI Divergence + FVG Signal indicator combines Relative Strength Index (RSI) Divergence with Fair Value Gap (FVG) detection to generate high-probability buy and sell signals based on both momentum shifts and institutional imbalance zones. Core Features: RSI Divergence Detection : Identifies both regular and hidden bullish/bearish divergences between price and RSI. Divergences indicate potential trend reversals or continuation. FVG Zone Recognition : Detects Fair Value Gaps (imbalances caused
Auto Optimized RSI   — это умный и простой в использовании стрелочный индикатор, созданный для точной торговли. Он автоматически определяет наиболее эффективные уровни покупки и продажи по RSI для выбранного символа и таймфрейма, используя симуляции на основе исторических данных. Индикатор может использоваться как самостоятельная торговая система, так и как часть вашей существующей стратегии. Особенно полезен для внутридневной торговли. В отличие от классических индикаторов RSI, которые использу
Terra Infinity — индикатор флета. Эта улучшенная версия индикатора CalcFlat имеет три дополнительные линии, значительно повышающие его эффективность. В отличие от своего предшественника с двумя статическими уровнями, Terra Infinity добавляет три динамические линии над основной гистограммой, которые интерпретируются следующим образом: базовая сигнальная линия, минимальная сигнальная линия, максимальная сигнальная линия. Эти линии формируются с помощью дополнительного параметра Avg, представляю
Mine Farm is one of the most classic and time-tested scalping strategies based on the breakdown of strong price levels. Mine Farm is the author's modification of the system for determining entry and exit points into the market... Mine Farm - is the combination of great potential with reliability and safety. Why Mine Farm?! - each order has a short dynamic Stop Loss - the advisor does not use any risky methods (averaging, martingale, grid, locking, etc.) - the advisor tries to get the most
Устали от построения линий поддержки и сопротивления? Сопротивление поддержки - это мульти-таймфреймовый индикатор, который автоматически обнаруживает и отображает линии поддержки и сопротивления на графике с очень интересным поворотом: поскольку ценовые уровни тестируются с течением времени и его важность возрастает, линии становятся более толстыми и темными. [ Руководство по установке | Руководство по обновлению | Устранение неполадок | FAQ | Все продукты ] Повысьте технический анализ в одноч
Добро пожаловать в индикатор распознавания Ultimate Harmonic Patterns Этот индикатор обнаруживает паттерн Гартли, паттерн Летучая мышь и паттерн Сайфер на основе HH и LL ценовой структуры и уровней Фибоначчи, и когда определенные уровни Фибоначчи встречаются, индикатор показывает паттерн на графике, Этот индикатор представляет собой комбинацию трех других моих индикаторов, которые обнаруживают сложные паттерны. Функции : Усовершенствованный алгоритм обнаружения паттерна с высокой точностью. Обна
Free automatic Fibonacci is an indicator that automatically plots a Fibonacci retracement based on the number of bars you select on the BarsToScan setting in the indicator. The Fibonacci is automatically updated in real time as new highest and lowest values appears amongst the selected bars. You can select which level values to be displayed in the indicator settings. You can also select the color of the levels thus enabling the trader to be able to attach the indicator several times with differe
FREE
Harmonic Pattern Suite Pro Introduction Harmonic Pattern Suite Pro is an indicator designed to identify and display harmonic structures on the chart based on X-A-B-C-D sequences. Its purpose is to present pattern formations that meet geometric and proportional criteria, providing a clear visual representation directly on the chart. The indicator automates the detection process, removing the need for manual measurement of ratios and allowing the user to review the structural configuration withou
FREE
МТФ-индикатор уровней поддержки и сопротивления, построенных на экстремумах индикаторов Advanced ZigZag Dynamic и/или Extended Fractals с отключаемым ценовым значением в виде меток. Для режима МТФ можно выбрать все более старшие ТФ. По умолчанию уровни строятся на основе точек индикатора "Зигзаг", можно также использовать для построения точки индикатора Фракталов совместно с Зигзагом или вместо него. Для упрощения работы и экономии процессорного времени расчёт происходит один раз на каждом баре
**   All Symbols   x   All Timeframes   scan just by pressing scanner button ** Discount: The price is $50$, But now it is just $39, Limited time offer is active. *** Contact me  to send you instruction and add you in "Trend Reversal group" for sharing or seeing experiences with other users. Introduction: Trendlines are the most famous technical analysis in trading . Trendlines continually form on the charts of markets across all the different timeframes providing huge opportunities for traders
Weis Wave Scouter
Jean Carlos Martins Roso
Откройте для себя силу продвинутого анализа объема с Weis Wave Scouter — революционным индикатором для MetaTrader 5, который сочетает проверенные временем принципы метода Вайкоффа и анализа объема VSA (Volume Spread Analysis). Разработанный для трейдеров, стремящихся к точности и глубине в своих операциях, этот индикатор предлагает тактическое чтение рынка через анализ кумулятивных волн объема, помогая выявлять ключевые точки разворота и продолжения тренда. Weis Wave Scouter имеет четкий визуаль
TradePilotmt5
Hossein Khalil Alishir
TradePilot Expert Advisor (EA) for MetaTrader 5 TradePilot is a professional and user-friendly Expert Advisor (EA) for MetaTrader 5 (MT5) . It simplifies automated trading , risk management , and trade execution with a smart trading panel . Perfect for beginners and experienced traders looking for a reliable trade manager EA with automated lot size calculation and smart position management. Key Advantages User-Friendly Trading Panel: Customizable panel with buttons and hotkeys for fast ex
STRICTLY FOR BOOM INDEX ONLY!!!!! Here I bring the Maximum Trend Arrows OT1.0 MT5 indicator. This indicator is made up of a combination of different trend indicators for entries and exits, for entries an orange arrow will paint on the chart below the current market and a red flag for closing of trades and it produces buy arrows only. When the orange arrow appears, it will appear along with it's sound to notify you. The 1H timeframe is recommended, don't use it anywhere else than on the 1H timefr
Усовершенствованная Мультитаймфреймовая версия скользящей средней Хала (Hull Moving Average - HMA). Особенности Две линии индикатора Халла разных таймфреймов на одном графике. Линия HMA старшего таймфрейма определяет тренд, а линия HMA текущего таймфрейма - краткосрочные ценовые движения. Графическая панель с данными индикатора HMA на всех таймфреймах одновременно. Если на каком-либо таймфрейме HMA переключил свое направление, на панели отображается вопросительный или восклицательный знак с текс
Unlock the power of Fibonacci with our advanced indicator! This tool precisely plots Fibonacci levels based on the previous day's high and low, identifying the next day's key support and resistance levels. Perfect for day trading and swing trading, it has consistently generated weekly profits for me. Elevate your trading strategy and seize profitable opportunities with ease. NOTE: In the Input section make sure the draw labels are set to "True" so you can see each levels.
The   Fibonacci Confluence Toolkit   is a technical analysis tool designed to help traders identify potential price reversal zones by combining key market signals and patterns. It highlights areas of interest where significant price action or reactions are anticipated, automatically applies Fibonacci retracement levels to outline potential pullback zones, and detects engulfing candle patterns. Its unique strength lies in its reliance solely on price patterns, eliminating the need for user-define
Smart Stochastic Divergence Detector Description: The Smart Stochastic Divergence Detector is a professional tool that automatically identifies Bullish & Bearish Divergences on your chart using the Stochastic Oscillator . It helps traders detect early reversals , hidden momentum changes , and trend continuation signals without the need for manual analysis. Whether you trade Forex, Indices, Stocks, or Crypto , this tool provides clear divergence signals with arrows and trendlines – allowin
Key level wedge MT5
Presley Annais Tatenda Meck
The   Key level wedge MT5   indicator automatically draws rising wedge pattern and falling wedge pattern for you on the chart. This pattern is really good when used as a confirmation entry at key support & resistance, supply & demand and reversal zones. Advantages  The   Key level wedge MT5   block DOES NOT RE-PAINT, giving you confidence when a signal appears and also helps when looking back.  The   Key level wedge MT5   includes an on/off button on the chart to easily keep the charts clean
MSnR Lines
Pierre Paul Amoussou
MSnR Lines - это пользовательский индикатор, предназначенный для отображения уровней поддержки и сопротивления на графике. Эти уровни основаны на теории малайзийской поддержки и сопротивления, которая определяет уровни не как области, а как конкретные ценовые уровни, происходящие из пиков и впадин линейного графика. Особенности: Три типа уровней: A-Level, V-Level и уровень разрыва. Индикация свежести для уровней: свежие уровни более значимы, чем незаполненные уровни. Настраиваемый цвет и стиль д
Do you, like me, like to trade with the trend? Then this indicator will help you! Rainbow Trend is a trend indicator, which uses several Moving Averages on the chart. It measures different trend strenght zones for different periods: very long term, long term, mid term, short term and very short term. Each zone has its color, and it is possible to have sound alert when the prices leaves a zone and enters another. Its configuration is very simple. If you find any bug or have any suggestions, conta
ATrend
Zaha Feiz
4.82 (17)
ATREND: Как это работает и как его использовать Как это работает Индикатор "ATREND" для платформы MT5 разработан для предоставления трейдерам надежных сигналов на покупку и продажу с использованием комбинации методов технического анализа. Этот индикатор в первую очередь использует среднюю истинную амплитуду (ATR) для измерения волатильности, наряду с алгоритмами обнаружения тренда для выявления потенциальных движений рынка. Оставьте сообщение после покупки и получите специальный бонусный подаро
##   ONLY GOLD ##   Тiльки Золото ## **Mercaria Professional Trading Zones - Complete Guide** ## **Mercaria Professional Trading Zones - Повний посібник** ### **How Mercaria Zones Work / Як працюють зони Mercaria** **English:** Mercaria Zones is an advanced trading indicator that identifies high-probability support and resistance areas using ZigZag extremes combined with mathematical zone calculations. The indicator works on multiple timeframes simultaneously, providing a comprehensive view
Индикатор предназначен помогать в принятии решения выбора направления торговли (бай или селл). Представляет собой сканер истории, ищущий совпадения текущего паттерна (комбинации нескольких текущих баров) с историческими данными в процентном соотношении по относительному вертикальному положению свечей относительно друг друга, размеров каждой свечи, размеров тела свечи и теней свечи. На истории найденные совпадения обозначаются вертикальными линиями на свече начала искомого паттерна. После каждого
С этим продуктом покупают
Каждый покупатель этого индикатора получает дополнительно Бесплатно: Авторскую утилиту "Bomber Utility", которая автоматически сопровождает каждю торговую операцию, устанавливает уровни Стоп Лосс и Тейк профит и закрывает сделки согласно правилам этой стратегии, Сет-файлы для настройки этого индикатора на различных активах, Сет-файлы для настройки Bomber Utility в режимы: "Минимум Риска", "Взвешенный Риск" и "Стратегия Выжидания", Пошаговый видео-мануал, который поможет вам быстро установить, на
SynaptixQuant Dominance Matrix: Institutional-Grade Market State Extraction Engineered for traders who require a data-driven view of market behaviour beyond surface-level indicators. The Synaptix Quant (SQ) Dominance Matrix is not a conventional currency strength display. Behind its intentionally streamlined interface runs a sophisticated analytical architecture designed to quantify market conditions with precision. Every output is generated through layered signal processing built to identify d
Представляю Вам отличный технический индикатор GRABBER, который работает, как готовая торговая стратегия "Все включено"! В одном программном коде интегрированы мощные инструменты для технического анализа рынка, торговые сигналы (стрелки), функции алертов и Push уведомлений.  Каждый покупатель этого индикатора получает дополнительно БЕСПЛАТНО:  Grabber Утилиту для автоматического управления открытыми ордерами, Пошаговый видео-мануал : как установить, настроить и торговать, Авторские сет-файлы дл
Quantum TrendPulse
Bogdan Ion Puscasu
5 (19)
Представляем   Quantum TrendPulse   , совершенный торговый инструмент, который объединяет мощь   SuperTrend   ,   RSI   и   Stochastic   в один комплексный индикатор, чтобы максимизировать ваш торговый потенциал. Разработанный для трейдеров, которые ищут точность и эффективность, этот индикатор помогает вам уверенно определять рыночные тренды, сдвиги импульса и оптимальные точки входа и выхода. Основные характеристики: Интеграция SuperTrend:   легко следуйте преобладающим рыночным тенденциям и п
Прежде всего стоит подчеркнуть, что этот Торговый Инструмент является Неперерисовывающимся Нерепейнтинговым Индикатором, что делает его идеальным для профессиональной торговли. Онлайн-курс, руководство пользователя и демонстрация. Индикатор Концепций Умного Действия Цены - очень мощный инструмент как для новичков, так и для опытных трейдеров. Он объединяет более 20 полезных индикаторов в одном, комбинируя передовые торговые идеи, такие как анализ Inner Circle Trader и стратегии торговли концеп
Купите TREND PRO сейчас и получите ещё один усовершенствованный трендовый индикатор бесплатно Для получения напишите в личные сообщения. ИНСТРУКЦИЯ RUS  -   INSTRUCTIONS  ENG    -    VERSION MT4   Основные функции: Точные сигналы на вход БЕЗ ПЕРЕРИСОВКИ! Если сигнал появился, он остается актуальным! Это важное отличие от индикаторов с перерисовкой, которые могут предоставить сигнал, а затем изменить его, что может привести к потере средств на депозите. Теперь вы сможете входить в рынок с больш
Топовый индикатор МТ5, дающий сигналы для входа в сделки без перерисовки! Идеальные точки входа в сделки для  валют, крипты, металлов, акций, индексов !  Смотрите  видео  (6:22) с примером отработки всего одного сигнала, окупившего индикатор. Версия индикатора для MT4 Преимущества индикатора Сигналы на вход без перерисовки Если сигнал появился, он никуда НЕ исчезает! В отличие от индикаторов с перерисовкой, которые ведут к потере депозита, потому что могут показать сигнал, а потом убрать его. Б
Сколько раз вы покупали торговый индикатор с отличными бэк-тестами, подтверждением производительности на реальном счете с фантастическими цифрами и статистикой повсюду , но после использования в итоге сливали свой счет? Не стоит доверять только сигналу, необходимо знать, почему он появился в первую очередь, и это то, что RelicusRoad Pro делает лучше всего! Руководство пользователя + Стратегии + Обучающие видео + Приватная группа с VIP доступом + Доступна мобильная версия Новый взгляд на рынок
Quantum Trend Sniper
Bogdan Ion Puscasu
4.74 (53)
Представляем       Индикатор Quantum Trend Sniper   , инновационный индикатор MQL5, который меняет способ определения разворотов тренда и торговли ими! Разработан командой опытных трейдеров со стажем торговли более 13 лет,       Снайперский индикатор Quantum Trend       разработан, чтобы вывести ваше торговое путешествие на новые высоты благодаря инновационному способу определения разворотов тренда с чрезвычайно высокой точностью. ***Купите индикатор Quantum Trend Sniper и получите индикатор Qu
Индикатор Trend Forecaster использует уникальный авторский алгоритм для определения точек входа в сделку по пробойной стратегии. Индикатор определяет ценовые скопления и анализирует движение цены возле уровней и показывает сигнал, когда цена пробивает уровень. Индикатор Trend Forecaster подходит для любых финансовых активов: валюты (Форекс), металлы, акции, индексы, криптовалюты. Также индикатор можно настроить для работы на любых тайм-фреймах, однако в качестве рабочего тайм-фрейма все же реком
ARIScalp is a powerful trading companion designed to generate high-probability entry signals with dynamic TP/SL/DP levels based on volatility. Built-in performance tracking shows win/loss stats, PP1/PP2 hits, and success rates all updated live. Key Features: Buy/Sell signals with adaptive volatility bands Real-time TP/SL/DP levels based on ATR Built-in MA Filter with optional ATR/StdDev volatility Performance stats panel (Success, Profit/Loss, PP1/PP2) Alerts via popup, sound, push, or email Cus
Лучшее решение для новичка или трейдера-эксперта! Этот индикатор является уникальным, высококачественным и доступным торговым инструментом, поскольку мы включили в него ряд собственных функций и новую формулу. С помощью всего лишь ОДНОГО графика вы можете определить силу валюты для 28 пар Форекс! Представьте, как улучшится ваша торговля, потому что вы сможете точно определить точку запуска нового тренда или возможность скальпирования? Руководство пользователя:   нажмите здесь Это первый, ори
Shock Pullback
Suleiman Alhawamdah
5 (1)
Проще говоря, вы можете начать торговлю, когда рядом с текущей свечой начинают появляться белые цифры — так называемые «пипсы». Белые «пипсы» указывают на то, что сделка на покупку или продажу в данный момент активна и движется в правильном направлении, что обозначается их белым цветом. Когда движение белых пипсов прекращается и превращается в статичный зелёный цвет, это сигнализирует об окончании текущего импульса. Зелёный цвет цифр представляет собой общий заработанный профит в «пипсах», незав
ИНСТРУКЦИЯ RUS   -    INSTRUCTIONS  ENG    -   VERSION MT4    Основные функции: Отображения активных зон продавцов и покупателей! Индикатор отображает все правильные первые импульсные уровни/зоны для покупок и продаж. При активации этих уровней/зон, где начинается поиск точек входа, уровни изменяют цвет и заливаются определенными цветами. Также появляются стрелки для более интуитивного восприятия ситуации. LOGIC AI - Отображения зон (кружки) поиска точек входа при активации шаблона   Для улучшен
AriX
Temirlan Kdyrkhan
1 (4)
AriX Indicator for MT5 A powerful trend-following and signal-evaluation tool AriX is a custom MT5 indicator that combines Moving Averages and ATR-based risk/reward logic to generate clear buy/sell signals. It visualizes dynamic SL/TP levels, evaluates past trade outcomes, and displays win/loss statistics in a clean on-chart panel. Key features include: Buy/Sell signals based on MA crossovers ATR-based SL/TP1/TP2/TP3 levels with visual lines and labels Signal outcome tracking with real-time stat
Step into the world of Forex trading with confidence, clarity, and precision using Gold Indicator a next-generation tool engineered to take your trading performance to the next level. Whether you’re a seasoned professional or just beginning your journey in the currency markets, Gold Indicator equips you with powerful insights and help you trade smarter, not harder. Built on the proven synergy of three advanced indicators, Gold Indicator focuses exclusively on medium and long-term trends elimina
ARICoin is a powerful trading companion designed to generate high-probability entry signals with dynamic TP/SL/DP levels based on volatility. Built-in performance tracking shows win/loss stats, PP1/PP2 hits, and success rates all updated live. Key Features: Buy/Sell signals with adaptive volatility bands Real-time TP/SL/DP levels based on ATR Built-in MA Filter with optional ATR/StdDev volatility Performance stats panel (Success, Profit/Loss, PP1/PP2) Alerts via popup, sound, push, or email Cust
Представляем       Quantum Breakout PRO   , новаторский индикатор MQL5, который меняет ваш способ торговли в зонах прорыва! Разработан командой опытных трейдеров со стажем торговли более 13 лет,       Квантовый прорыв PRO       разработан, чтобы поднять ваше торговое путешествие к новым высотам с его инновационной и динамичной стратегией зоны прорыва. Quantum Breakout Indicator покажет вам сигнальные стрелки на зонах прорыва с 5 целевыми зонами прибыли и предложением стоп-лосса на основе поля
Этот индикатор является уникальным, качественным и доступным инструментом для торговли, включающим в себя наши собственные разработки и новую формулу. В обновленной версии появилась возможность отображать зоны двух таймфреймов. Это означает, что вам будут доступны зоны не только на старшем ТФ, а сразу с двух таймфреймов - таймфрейма графика и старшего: отображение вложенных зон. Обновление обязательно понравится всем трейдерам, торгующим по зонам спроса и предложения. Важная информация Для макс
Следующее поколение автоматизированных зон спроса и предложения. Новый инновационный алгоритм, работающий на любом графике. Все зоны создаются динамически в соответствии с ценовым действием рынка. ДВА ТИПА СИГНАЛОВ --> 1) ПРИ ПОПАДАНИИ ЦЕНЫ В ЗОНУ 2) ПРИ ФОРМИРОВАНИИ НОВОЙ ЗОНЫ Вы не получите еще один бесполезный индикатор. Вы получаете полную торговую стратегию с проверенными результатами.     Новые особенности:     Оповещения, когда цена достигает зоны спроса/предложения     Оповещения
Berma Bands
Muhammad Elbermawi
5 (7)
Индикатор Berma Bands (BBs) является ценным инструментом для трейдеров, стремящихся определить и извлечь выгоду из рыночных тенденций. Анализируя взаимосвязь между ценой и BBs, трейдеры могут определить, находится ли рынок в фазе тренда или диапазона. Посетите [ Блог Berma Home ], чтобы узнать больше. Berma Bands состоят из трех отдельных линий: Upper Berma Band, Middle Berma Band и Lower Berma Band. Эти линии наносятся вокруг цены, создавая визуальное представление движения цены относительно об
Профессиональный мульти-таймфреймовый скальпинг-индикатор с мобильными уведомлениями в реальном времени, умными зонами покупки/продажи и ежедневной статистикой сигналов. Разработан для дейтрейдеров и скальперов, которым нужна точность. Обзор Этот индикатор создан для дейтрейдеров и скальперов , ценящих точность, скорость и ясность. Он объединяет мульти-таймфреймовый анализ с интеллектуальной фильтрацией сигналов, предоставляя торговые возможности с высокой вероятностью успеха. С уведомлениями в
ОПИСАНИЕ ICSM (Impulse-Correction SCOB Mapper) - это индикатор, который анализирует движение цены и определяет действительные импульсы, коррекции и SCOB (ордер блок на одну свечу). Это мощный инструмент, который можно использовать с любым типом технического анализа, так как он гибкий, информативный, прост в использовании и существенно улучшает понимание трейдером наиболее ликвидных зон интереса. НАСТРОЙКИ Общие | Визуальные Цветовая тема - определяет цветовую тему ICSM. SCOB | Визуальные
Trend Trading - это индикатор, предназначенный для получения максимальной прибыли от трендов, происходящих на рынке, путем определения времени отката и прорыва. Он находит торговые возможности, анализируя, что делает цена во время установленных тенденций. [ Руководство по установке | Руководство по обновлению | Устранение неполадок | FAQ | Все продукты ] Торгуйте на финансовых рынках с уверенностью и эффективностью Прибыль от устоявшихся тенденций без проволочек Признать прибыльные откаты, пр
Spike Detector Rider – Intelligent Trading in Volatile Markets Introduction The Spike Detector Rider  is an advanced system for MetaTrader 5 designed to detect explosive price movements in high-volatility assets such as synthetic indices and commodities. It combines volatility filters, trend analysis, and automated risk management to provide intelligent trade confirmations. After purchase, please send me a private message via MQL5 to receive the installation manual and setup instructions. Asset
Индикатор Volume Spread Analysis основан на оригинальном методе Volume Spread Analysis. Он был разработан для быстрого и легкого распознавания паттернов VSA. Несмотря на то, что индикатор выглядит очень просто, это самый сложный инструмент из всех, которые мы когда-либо создавали. Это действительно мощный аналитический инструмент, который генерирует очень надежные торговые сигналы. Поскольку он очень удобен и понятен, он подходит для любого типа трейдера, независимо от его опыта.
Лучшее решение для новичка или трейдера-эксперта! Этот индикатор является уникальным, высококачественным и доступным торговым инструментом, поскольку мы включили в него ряд собственных функций и секретную формулу. Всего на ОДНОМ графике он выдает алерты по всем 28 валютным парам. Представьте, как улучшится ваша торговля, ведь вы сможете точно определить точку запуска нового тренда или возможность скальпирования! Построенный на новых базовых алгоритмах, он позволяет еще проще определять и подт
MetaForecast M5
Vahidreza Heidar Gholami
5 (3)
MetaForecast предсказывает и визуализирует будущее любого рынка на основе гармонии в данных о ценах. Хотя рынок не всегда предсказуем, если существует узнаваемый паттерн в ценах, то MetaForecast способен предсказать будущее с наибольшей точностью. По сравнению с другими аналогичными продуктами, MetaForecast способен генерировать более точные результаты, анализируя тренды на рынке. Входные параметры Past size (Размер прошлых данных) Указывает количество баров, которые MetaForecast использует для
Stargogs Spike Catcher
Lorenzo Edward Beukes
4.5 (8)
Stargogs Spike Catcher V4.0 This Indicator is Developed To milk the BOOM and CRASH indices . Now Also work on weltrade for PAIN and GAIN indices. Send me Message if you need any help with the indicator.  CHECK OUT THE STARGOGS SPIKE CATCHER EA/ROBOT V3: CLICK HERE ALSO CHECK OUT SECOND TO NONEFX SPIKE CATCHER:   CLICK HERE STARGOGS SPIKE CATCHER V4.0 WHATS NEW! Brand New Strategy. This is the Indicator you need for 2025. New Trend Filter to minimize losses and maximize profits. New Trendline th
Super Signal – Skyblade Edition Профессиональная система трендовых сигналов без перерисовки и без задержек с исключительным процентом выигрышей | Для MT4 / MT5 Основные характеристики: Super Signal – Skyblade Edition — это интеллектуальная система сигналов, специально разработанная для трендовой торговли. Она использует многоуровневую фильтрацию, чтобы выявлять только сильные направленные движения, подкреплённые реальным рыночным импульсом. Данный индикатор   не пытается предсказать вершины или
Другие продукты этого автора
Volume at Price (VAP) VAP is a right-anchored Volume Profile Heatmap for MetaTrader 5 designed for clean, fast, and stable execution on any chart. It shows where trading activity clustered, not just when—so you can read balance/imbalance, spot value migration, and plan trades with precise references: VAH, VAL, and POC . What VAP shows Heatmap Profile (tick-volume): A compact, right-anchored histogram that scales with the chart. Value Area (~70%) in Gold Non-Value in White Soft shadow gradient
Tired of losing money? Neuro_Inverted_Panel_EA is your solution — the ultimate manual trading panel for those ready to embrace inverted psychology! Simply attach the EA to your chart, set the maximum daily loss you're willing to accept (for smart risk control), and trade as you normally would — but without watching your "Toolbox" for open trades . This panel turns your typical losing habits into a winning strategy by flipping your decisions upside down — literally. Once attached, the panel displ
ARTIFICIAL INTELLIGENCE INVESTMENT TOOL. ATTACH TO THE CHART, LEAVE AND FORGET. VPS HIGHLY RECOMMENDED-INVESTMENT SYSTEM. (MQL5 VPS) RR_EA is an investment-grade swing trading EA with a built-in Artificial Intelligence decision engine. It has been specifically engineered to trade the US30(Dow Jones) and NASDAQ-100 index market. The internal AI trading logic is fully automated — no manual intervention is required after setup. The only input from the user is the lot size they wish to trade (based
MP TPO Heatmap — Market Profile (TPO) with VAH/VAL/POC/IB Market Profile is a way to visualize how price accepts or rejects value within a session. Instead of averaging, it counts how often price traded at each level during equal-time “brackets.” The result is a distribution you can read at a glance: thick areas = acceptance; thin edges = rejection. This indicator implements a TPO-based Market Profile with clean session lines (POC, VAH, VAL, IBH, IBL) and a fast, two-tone heatmap cloud that high
Inverted_Chart_EA Utility Expert Advisor Inverted_Chart_EA creates and maintains a mirror-inverted chart of any symbol and timeframe. It automatically generates a custom instrument (e.g. US30_INV ) and keeps its price history updated in real time, with bars mirrored around a chosen pivot. This utility gives traders a new way to analyze the market from a different perspective by flipping the chart upside down. Why use an inverted chart? Highlight hidden patterns – price formations that look ordin
Фильтр:
Нет отзывов
Ответ на отзыв