Multi Timeframe RSI Kinvest
- Indicators
- Version: 1.1
- Activations: 5
Multi-Timeframe RSI Indicator
Unleash the Power of Multi-Timeframe Analysis with Our Intuitive RSI Indicator!
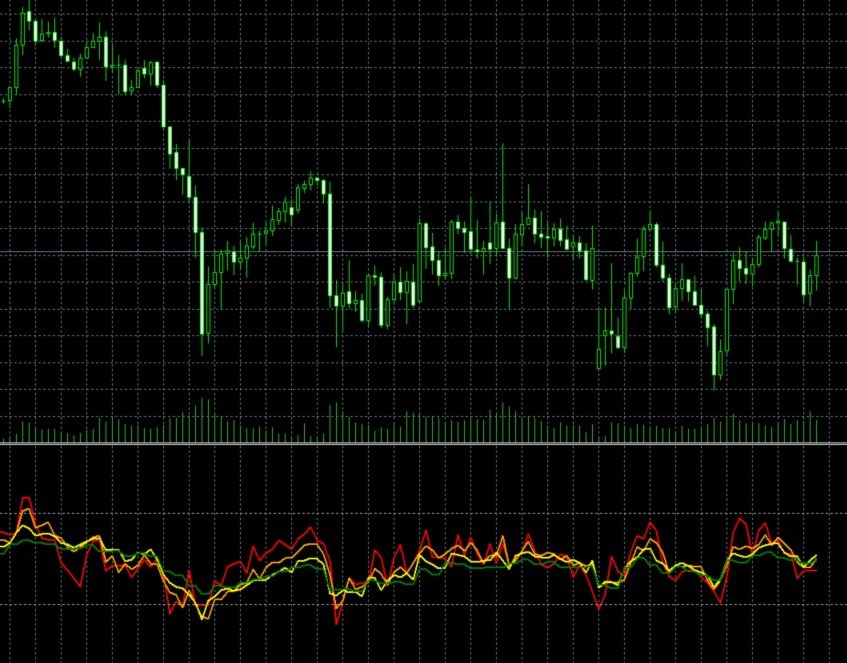
Gain a comprehensive perspective on market momentum across various timeframes, all on a single chart. Our Multi-Timeframe RSI Indicator allows you to track the Relative Strength Index (RSI) with a consistent period across five customizable timeframes, empowering you to make more informed trading decisions.
Key Features:
-
Simultaneous Multi-Timeframe View: Monitor RSI for up to five different timeframes concurrently on one chart, eliminating the need to switch between windows.
-
Customizable Timeframes: Define your preferred timeframes to suit your trading strategy, from M1 to MN.
-
Unified RSI Period: Maintain a consistent RSI calculation period across all selected timeframes for direct comparison.
-
Clear Visual Representation: Easily identify overbought/oversold conditions and momentum shifts across multiple market cycles.
-
Enhanced Decision Making: Spot divergences and convergences between timeframes, providing deeper insights into market trends.
-
User-Friendly Interface: Simple and intuitive setup for immediate use.
Why Choose Our Multi-Timeframe RSI?
This indicator is an invaluable tool for traders seeking to improve their market analysis. By providing a holistic view of RSI across various timeframes, you can better understand the underlying strength or weakness of an asset and anticipate potential price movements. Whether you're a day trader, swing trader, or long-term investor, this indicator will significantly enhance your analytical capabilities