Multi Timeframe RSI Kinvest
- 지표
- 버전: 1.1
- 활성화: 5
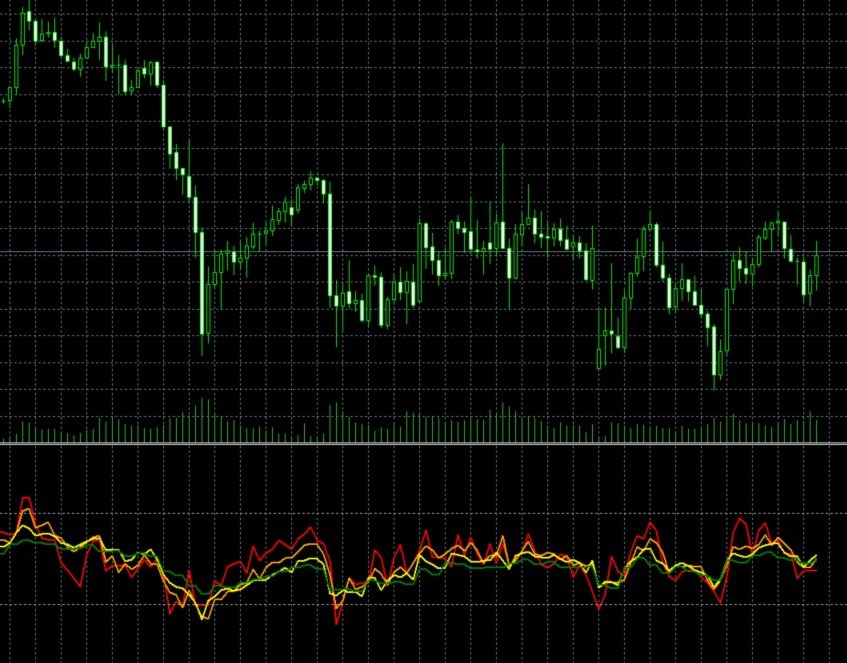
다중 시간 프레임 RSI 지표
직관적인 RSI 지표로 다중 시간 프레임 분석의 힘을 발휘하십시오!
단일 차트에서 다양한 시간 프레임에 걸쳐 시장 모멘텀에 대한 포괄적인 관점을 얻으십시오. 당사의 다중 시간 프레임 RSI 지표를 사용하면 5개의 사용자 지정 가능한 시간 프레임에서 일관된 기간으로 상대 강도 지수(RSI)를 추적하여 보다 정보에 입각한 거래 결정을 내릴 수 있습니다.
주요 특징:
-
동시 다중 시간 프레임 보기: 단일 차트에서 최대 5개의 다른 시간 프레임에 대한 RSI를 동시에 모니터링하여 창 전환의 필요성을 없앱니다.
-
사용자 지정 가능한 시간 프레임: M1에서 MN까지 거래 전략에 맞게 선호하는 시간 프레임을 정의합니다.
-
통합 RSI 기간: 직접 비교를 위해 선택한 모든 시간 프레임에서 일관된 RSI 계산 기간을 유지합니다.
-
명확한 시각적 표현: 여러 시장 주기에서 과매수/과매도 조건 및 모멘텀 변화를 쉽게 식별합니다.
-
향상된 의사 결정: 시간 프레임 간의 발산 및 수렴을 찾아 시장 추세에 대한 더 깊은 통찰력을 제공합니다.
-
사용자 친화적인 인터페이스: 즉시 사용할 수 있는 간단하고 직관적인 설정.
왜 우리의 다중 시간 프레임 RSI를 선택해야 할까요?
이 지표는 시장 분석을 개선하려는 트레이더에게 귀중한 도구입니다. 다양한 시간 프레인에서 RSI에 대한 전체적인 보기를 제공함으로써 자산의 근본적인 강점 또는 약점을 더 잘 이해하고 잠재적인 가격 움직임을 예측할 수 있습니다. 당신이 데이 트레이더, 스윙 트레이더 또는 장기 투자자이든 관계없이 이 지표는 당신의 분석 능력을 크게 향상시킬 것입니다.