Multi Timeframe RSI Kinvest

マルチタイムフレームRSIインジケーター

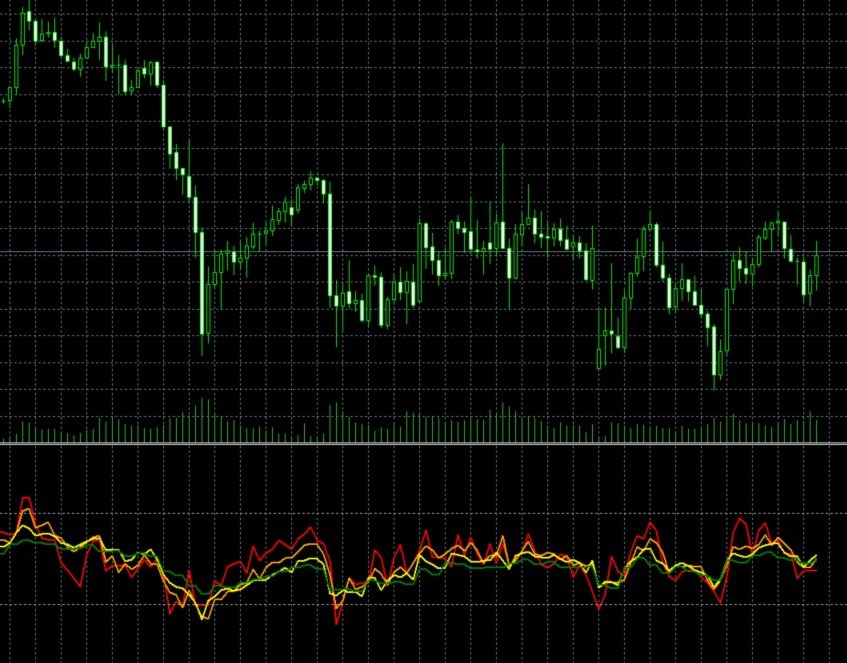
直感的なRSIインジケーターでマルチタイムフレーム分析の力を解き放ちましょう!

単一のチャート上で、さまざまな時間枠における市場の勢いを包括的に把握できます。当社のマルチタイムフレームRSIインジケーターを使用すると、5つのカスタマイズ可能な時間枠で一貫した期間で相対力指数(RSI)を追跡でき、より情報に基づいた取引決定を下すことができます。

主な機能:

  • 同時マルチタイムフレーム表示: 最大5つの異なる時間枠のRSIを単一のチャートで同時に監視でき、ウィンドウを切り替える必要がありません。

  • カスタマイズ可能な時間枠: M1からMNまで、取引戦略に合わせて好みの時間枠を定義できます。

  • 統一されたRSI期間: 選択したすべての時間枠で一貫したRSI計算期間を維持し、直接比較を可能にします。

  • 明確な視覚表現: 複数の市場サイクルにおける買われすぎ/売られすぎの状況と勢いの変化を簡単に識別できます。

  • 強化された意思決定: 時間枠間のダイバージェンスとコンバージェンスを発見し、市場トレンドに関するより深い洞察を提供します。

  • ユーザーフレンドリーなインターフェース: すぐに使えるシンプルで直感的な設定。

なぜ当社のマルチタイムフレームRSIを選ぶのか?

このインジケーターは、市場分析を改善しようとしているトレーダーにとって非常に貴重なツールです。さまざまな時間枠にわたるRSIの全体像を提供することで、資産の根底にある強みや弱みをよりよく理解し、潜在的な価格変動を予測できます。デイトレーダー、スイングトレーダー、長期投資家を問わず、このインジケーターは分析能力を大幅に向上させます。


おすすめのプロダクト
革新的な MT5 インジケーター、DARWIN Assistant   をご紹介します。これは、トレーディングを成功させる世界への究極のゲートウェイです。精度と専門知識に基づいて設計された DARWIN Assistant   は、RSI、ストキャスティクス、CCI、トレンドなどの高度なテクニカル指標をすべての時間枠にわたって活用する特別な戦略に基づいて動作します。この最先端のインジケーターはエントリーのための最も正確なシグナルを提供し、比類のない自信を持って市場をナビゲートできるようにするため、並外れた取引体験に備えてください。 DARWIN Assistant   を使用すると、最も収益性の高い取引機会を検出するために細心の注意を払って調整された、重要な指標の包括的な分析にアクセスできるようになります。不確実性に別れを告げ、情報に基づいた意思決定の新時代を迎えましょう。 RSI、ストキャスティクス、CCI、トレンドを DARWIN Assistant   内でシームレスに統合することでその力を解き放ち、これまでにないほど市場のダイナミクスを鮮明に描きます。 DARWIN As
Supply and Demand Monster
Tsog Erdene Borjigon Enkhkhudulmur
Supply and demand zones are at the heart of   supply and demand trading . These zones are areas that show  liquidity at a specific price.  The supply zone is also called the distribution zone, while the demand zone is called the accumulation zone.   Our indicator automatically draw supply and demand zones in Metatrader 5. It give opportunity to understand trading zone and avoiding risk.
稼ぎと研究のためのツール。 トレーディングシグナルと戦略の中核は、価格予測パターンを形成するための著者のアルゴリズムに基づいています。どんな楽器にも使えます! MA「九尾の狐」に基づく制御システムが追加され、市場、機器、および作業期間に合わせて信号を可能な限り正確に更新および調整します。 対象:すべての市場のすべての商品(例外があります)。 対象者:ヘッジファンド、ファンドおよび資産運用会社、投資運用会社、投機家、投資家および利害関係者。 .................................................................................................................................................................................
https://youtu.be/JJanqcNzLGM ,  https://youtu.be/l70MIHaQQa4 ,  https://youtu.be/pg0oiT5_8y0   Automated Supply and Demand Trading Edge MT5. These videos demonstrate how we apply the supply and demand system to our latest trading review and market analysis Enhance your Trading Strategy with the Supply and Demand Trading Edge MT5. Gain a competitive market advantage with the Supply and Demand Trading Edge MT5 indicator, a powerful tool that combines MACD signals with supply and demand zones. By
Divergent Stochastic Filter II Catch Reversals Early, Filter Noise, Trade with Confidence The Edge: Why This Stochastic is Different  Every trader knows the Stochastic oscillator. But knowing when to trust its signals, that's the real challenge. The Divergent Stochastic Filter II transforms this classic indicator into a precision reversal detection system by adding critical elements: divergence intelligence, signal filtering and exhaustion detection.  While standard Stochastic oscillators fire s
Limitless MT5 is a universal indicator suitable for every beginner and experienced trader. works on all currency pairs, cryptocurrencies, raw stocks Limitless MT5 - already configured and does not require additional configuration And now the main thing Why Limitless MT5? 1 complete lack of redrawing 2 two years of testing by the best specialists in trading 3 the accuracy of correct signals exceeds 80% 4 performed well in trading during news releases Trading rules 1 buy signal - the ap
SuperSmooth WMA Trading System Pro は、低品質なエントリーを排除するために設計されたルールベースのトレーディングシステムです。本システムは単一のインジケーターに依存せず、トレンド方向、モメンタム、市場構造、そして上位足の方向性が完全に一致した場合のみシグナルを生成します。 各エントリーは4つの独立したフィルターによって厳格に確認されます。いずれか一つでも条件が一致しない場合、シグナルは表示されません。これにより、レンジ相場や不安定な局面での無駄なトレードを大幅に削減します。 チャート上にはロングエントリー、ショートエントリー、ロングイグジット、ショートイグジットの矢印が表示され、さらにローソク足の色によって現在の市場状態を瞬時に把握できます。緑は上昇コンフルエンス、赤は下降コンフルエンス、灰色はレンジ状態を示します。 すべての通貨ペア、指数、商品、暗号資産、および全時間足に対応しています。
A scalping indicator based on mathematical patterns, which on average gives signals with relatively small SL, and also occasionally helps to catch big moves in the markets (more information in the video) This indicator has three main types of notifications: The first type warns of a possible/upcoming signal on the next bar The second type indicates the presence of a ready signal to enter the market/open a position The third type is for SL and TP levels - you will be notified every time price re
The indicator is designed to work on any trading platform. The program is based on proprietary algorithms and W.D.Ganna's mathematics, allowing you to calculate target levels of price movement based on three points with the highest degree of certainty. It is a great tool for stock trading. The indicator has three buttons: NEW - call up a triangle for calculation. DEL - delete the selected triangle. DELS - completely remove all constructions. The probability of achieving the goals is more than 80
Manyal trading system, CovEchoTrend Robot, focuses on reliability and flexibility. By employing statistical analysis methods to study the relationships between the base indicator and market patterns, the system enables a deeper understanding of market processes. Intelligent pattern analysis: The application of statistical data processing helps identify key trend reversal points more accurately, signaling significant market shifts. Informed decision-making is based on the intersection of indicato
Based on the trading model/strategy/system of gold double-position hedging and arbitrage launched by Goodtrade Brokers, problems encountered in daily operations: 1. Account B immediately places an order immediately following account A. 2: After account A places an order, account B will automatically copy the stop loss and take profit. 3: Account A closes the position of Account B and closes the position at the same time. 4: When account B closes the position, account A also closes the position.
RBreaker Gold Indicatorsは、金先物の短期日内取引戦略であり、トレンドフォローと日内反転の2つの取引手法を組み合わせたものです。トレンド相場での利益を捉えるだけでなく、相場が反転した際には迅速に利確し、その流れに沿ってポジションを反転させることができます。 この戦略は、アメリカの雑誌『Futures Truth』において、15年連続で最も収益性の高い取引戦略トップ10に選ばれた実績を持ち、非常に長いライフサイクルを誇り、現在も国内外で広く使用・研究されています。 本インディケーターは、2026年の金先物の値動きに対応し、14日間のATR指標に基づいて、ブレイクアウト係数A、観察係数B、リバーサル係数Rをより合理的な値で定義しています。非常に優れたインディケーターであり、安定的な年間収益を実現しています。ぜひおすすめします〜
Engulfing with EMAs Indicator Unlock the power of advanced candlestick pattern detection with the Engulfing with EMAs Indicator , a cutting-edge tool designed for MetaTrader 5. This futuristic indicator combines the precision of engulfing pattern analysis with the trend-following strength of Exponential Moving Averages (EMA 21 and EMA 50), empowering traders to identify high-probability setups across all currency pairs and timeframes. Key Features: Comprehensive Engulfing Detection : Detects b
Forex Relative Performance indicator This indicator calculates the relative strength of major currencies against the US dollar. The basic idea behind this indicator is "to buy strong currency and to sell weak currency". This indicator allows you to quickly identify the best forex pair to trade according to your trading style (Intraday, Scalping, Swing, or Long Term)
Justo mini indice
Pedro Augusto Escoque Marin
Este indicador calcula e exibe no gráfico o preço justo do mini índice (WIN) com base em dados fundamentais do mercado. Além disso, ele traça automaticamente linhas de suporte e resistência percentuais , ajudando você a visualizar zonas importantes de preço. É como ter uma régua financeira no gráfico, mostrando onde o preço "deveria estar", de forma objetiva, considerando o cenário macroeconômico! O indicador usa uma fórmula de precificação de contratos futuros baseada em: O preço à vista do Ib
AIS MT5 INDICATOR 5 ALL INCLLUSIVE SET GUIDE CHAPTER 1  IMPORTANT INFORMATION <1> THIS INDICATOR IS ONE OF THE SERIES OF NEW AIS INDICATORS AIS MT5 INDICATOR 1 =ADVANCED CLASSIC= AIS MT5 INDICATOR 2 =MULTIFRAMES= AIS MT5 INDICATOR 3 =LINES= AIS MT5 INDICATOR 4 =MARKET PROFILES= AIS MT5 INDICATOR 5 =ALL INCLUSIVE SET CHAPTER 2 GENERAL FEATURES OF THE SERIES <1> AIS MT5 INDICATOR 1 =ADVANCED CLASSIC= < DEVELOPMENT PAUSED >     DISPLAYS MAIN TIME POINTS AND PRICE LEVELS OF THE CHART      SUCH
==================================================================== SMC Pro v6.1 APEX AI — XAUUSD Gold Empire MetaTrader 5 Indicator · Smart Money Concepts · Predictive Intelligence Engine ==================================================================== SMC Pro v6.1 APEX AI is a professional Smart Money Concepts indicator system built exclusively for XAUUSD (Gold) on MetaTrader 5. It combines the complete SMC framework — Order Blocks, Liquidity sweeps, Fair Value Gaps, Break of Structure,
The indicator is a gold mine that works with the MACDI strategy with alert supported by AI it working on gold 5m time frame with 92% win the stratige take 15 pip tp and 15 stop 1:1 follow us on telegram : t.me/tuq98 youtube : youtube.com/ssfx1 green color its buy with alert red color its sell with alert this indicator is one from top 10 in greece and one from top 5 in iraq
AlphaGain AI – 次世代AIによるエリートトレーディング精度 AlphaGain AIは、MetaTrader 5向けに設計された高性能エキスパートアドバイザー(EA)で、AIと過去10年以上のデータを活用し、マーケット環境に応じた自動適応戦略で正確なシグナルを提供します。 主な特徴: AIコア:ローソク足パターン、ボラティリティゾーン、モメンタムロジックを解析; 10年以上のヒストリカルデータで学習; 高度なエントリー/エグジットロジック:SL/TP、トレーリングストップ、ブレイクイーブン、ボラティリティに応じたTP; 資金保護:ドローダウン制限、エクイティガード、最大スプレッドフィルター、取引時間制限; 完全自動運用:人間の介入不要; 低レイテンシー対応:ECN環境に最適化。 推奨設定: 通貨ペア:EUR/USD 時間足:15分(M15) 最低残高:100ドル アカウントタイプ:ECNまたはRaw Spread レバレッジ:1:100以上 AlphaGain AIを選ぶ理由: 簡単導入:.ex5ファイル、.set設定、PDFガイド付属;
Jita Indicator Pro MT5 | All Timeframes Professional Trend Agreement System – Premium Edition ($500) What Is Jita Indicator Pro? Jita Indicator Pro is a structured trend-confirmation system designed for serious traders who value precision, alignment, and controlled signal behavior. It combines: Advanced band-based trend direction logic ATR-driven structural trigger engine Dual-confirmation agreement system Locked history update design This indicator prints signals only when multiple conditions
HAWA GOLD MT5 Advanced trading indicator with realistic pre-defined entry and exit levels with almost 80% win rate.  The system focuses only  Small and Steady Profits . It uses fixed stop loss for every signal to keep money management in place.  As compare to other available indicators in market, HAWA gold has unique feature of displaying total profit and loss in terms of points where 1PIP=10points and Minimum profit is 10 pips. Its smart and advanced algorithm detects trend and trend strength
Currency Index Watcher is a simple and user-friendly tool for whoever wish to trade Forex using currencies indexes. Currency Index Watcher is configurable and usable directly from the panel. Indexes of 8 custom currencies EUR, USD, GBP, JPY, CHF, AUD, CAD, NZD (default) Any 3-chars symbol from your market watch could be used (BTC = bitcoin, RUB = ruble, CNH = yuan etc ...) : double click the symbol label  Ability to select which currencies and made-of pairs will be analyzed : check/uncheck wante
http://www.tradepositive.lat ALGO Smart Flow Structure Indicator The ALGO Smart Flow Structure Indicator is designed for serious traders who use objective Market structure. Forget noise and slow indicators; this tool provides you with a crystal-clear, unambiguous view of structural breakouts across all timeframes. Based on the rigorous rules of the ALGO Smart Flow methodology, the indicator filters out internal structure and only shows you the Major Structural Points (Swing Points) , ensuri
FREE
MercariaPattern1-2-3 відстежує рух ціни, знаходить трьоххвильові структури 1-2-3 та підсвічує момент, коли сценарій підтверджується пробоєм ключового рівня. MercariaPattern1-2-3 tracks price movement, detects three-leg 1-2-3 structures and highlights the moment when the scenario is confirmed by a key level breakout. Індикатор збирає локальні свінги в компактну фігуру 0–1–2–3 , чекає підтвердженого пробою та будує стрілку входу з готовими рівнями SL/TP. The indicator combines local swings into a
Carte de liquidité institutionnelle Pro Voyez ce que voient les institutions — avant tout le monde Aperçu Institutional Liquidity Map Pro est un indicateur professionnel conçu pour cartographier les zones de liquidité institutionnelle à l'aide des niveaux mensuels les plus hauts et les plus bas . Il détecte automatiquement les zones de stop-hunt , les zones de retournement potentiel et les zones d'accumulation/distribution institutionnelles . L'indicateur suit dynamiquement jusqu'à trois ni
MTFC (Multi Timeframe Chart) – See 2 Timeframes on ONE Chart! "Trade Smarter, Not Harder – Eliminate Timeframe Switching Forever!" Imagine having the power to see any higher timeframe (M5, M15, H1, H4, D1, MN1, etc.) directly on your current chart.   No more flipping between charts, no more guesswork—just   pure trading clarity   in one place. That’s exactly what the   MTFC Indicator   delivers! 1. The Problem It Solves As traders, we know   context is king . But constantly switching between c
Main Features AI Decision Engine Integration Connect MetaTrader 5 to an external Artificial Intelligence trading engine through a local API. This allows integration with advanced AI models, machine learning systems, and custom trading logic developed outside MetaTrader. The Expert Advisor acts as a bridge between the trading platform and the external AI engine. Real-Time Market Data Streaming The EA continuously sends market data to the AI engine including: • Price action • Candle statistics •
Uranus STO expert is developed on the basis of a deep mathematical analysis, using the popular indicators: Stochastic, WPR, ATR, RSI. The Expert is optimized for EURUSD trading . The expert analyzes past periods, comparing them to the current period. According to the degree of probability and market behavior, the expert places orders at levels calculated for the best result. The strategy also features a permeability tool: Impact Bar. It works as a probability filter. The range of the Band is fro
FX TradeMeta Pro — Professional Signal Indicator Overview An integrated indicator designed for professional traders, combining multiple advanced algorithms into one powerful tool to deliver precise entry and exit signals across all pairs and timeframes. Key Features Non-Repainting Signals All signals are calculated only on closed candles, ensuring they never change after appearing. Dynamic Tracking System An adaptive trailing line that automatically adjusts to market volatility, clearly showi
Gioteen Volatility Index (GVI) - your ultimate solution to overcoming market unpredictability and maximizing trading opportunities. This revolutionary indicator helps you in lowering your losing trades due to choppy market movements. The GVI is designed to measure market volatility, providing you with valuable insights to identify the most favorable trading prospects. Its intuitive interface consists of a dynamic red line representing the volatility index, accompanied by blue line that indicate
このプロダクトを購入した人は以下も購入しています
ARICoin is a powerful trading companion designed to generate high-probability entry signals with dynamic TP/SL/DP levels based on volatility. Built-in performance tracking shows win/loss stats, PP1/PP2 hits, and success rates all updated live. Key Features: Buy/Sell signals with adaptive volatility bands Real-time TP/SL/DP levels based on ATR Built-in MA Filter with optional ATR/StdDev volatility Performance stats panel (Success, Profit/Loss, PP1/PP2) Alerts via popup, sound, push, or email Cust
CGE Trading Suite
Carl Gustav Johan Ekstrom
5 (2)
Institutional-Grade Analytics for MT5 C GE Trading Suite delivers the analytical edge typically reserved for professional trading desks. The platform integrates a full suite of analytical tools into one seamless workflow: dynamic grid mapping, liquidity behavior analysis, ECM, trend lines, MIDAS, trade cycles, and directional channel projections. Together, these provide a unified view of market structure and momentum. Directional clarity is further enhanced by the capital flow index, which meas
AriX
Temirlan Kdyrkhan
1 (4)
AriX Indicator for MT5 A powerful trend-following and signal-evaluation tool AriX is a custom MT5 indicator that combines Moving Averages and ATR-based risk/reward logic to generate clear buy/sell signals. It visualizes dynamic SL/TP levels, evaluates past trade outcomes, and displays win/loss statistics in a clean on-chart panel. Key features include: Buy/Sell signals based on MA crossovers ATR-based SL/TP1/TP2/TP3 levels with visual lines and labels Signal outcome tracking with real-time stat
A tool for on-chart strategy backtesting and performance analysis. A utility for developing, debugging, and testing custom trading ideas and indicator functions. An indicator designed to quickly test trading concepts and visualize the effectiveness of different input parameters. An all-in-one sandbox for testing everything from simple crossovers to complex, multi-condition trading systems.
IVISTscalp5
Vadym Zhukovskyi
5 (6)
iVISTscalp5 — 時間ベースの市場予測システム iVISTscalp5は一般的なインジケーターではありません。 MetaTrader 5向けの時間ベースの予測システムであり、 市場がいつ動く可能性が高いかを特定します。 ⸻ 特徴  • 正確なタイミング  • BUY / SELL予測  • 平均利益の可能性  • 週間予測  • 120以上の金融商品 ⸻ コンセプト 市場は価格だけでなく時間によっても動く ⸻ iVISTscalp5 — 時間による優位性 iVISTscalp5インジケーターをご紹介します。このインジケーターは、トレーディングにおいて独自でありながら効果的です。時間データに基づくこのインジケーターは、多年にわたる経験と金融市場の深い分析の結果です。iVISTscalp5インジケーターは、手動トレーディングにとって優れたツールです。便利さ、簡単さ、可視化 - すべての複雑さが内部に隠されています。私たちは、iVISTscalp5インジケーターの設定と使用を最大限に簡素化しました。このインジケーターは、MT5ターミナルにあるすべての金融商品
ARIScalp is a powerful trading companion designed to generate high-probability entry signals with dynamic TP/SL/DP levels based on volatility. Built-in performance tracking shows win/loss stats, PP1/PP2 hits, and success rates all updated live. Key Features: Buy/Sell signals with adaptive volatility bands Real-time TP/SL/DP levels based on ATR Built-in MA Filter with optional ATR/StdDev volatility Performance stats panel (Success, Profit/Loss, PP1/PP2) Alerts via popup, sound, push, or email Cus
Recommended TimeFrame >= H1. 100% Non Repainted at any moment.  Use it carefully, only with Trend Direction. Trading Usage: 2 Variants: as Range System or as BreakOut System (Both Only With Trend Direction)::: (Always use StopLoss for minimise Risk); [1] as Range System: (Recommended) in UP TREND:  - BUY in Blue Line , then if price goes down by 50 points (on H1) open Second BUY.   Close in any Profit you wish: TrailingStop(45 points) or Close when Price touches upper Gold Line. in DOWN TREND
The Expert Advisor and the video are attached in the Discussion tab . The robot applies only one order and strictly follows the signals to evaluate the indicator efficiency. Pan PrizMA CD Phase is an option based on the Pan PrizMA indicator. Details (in Russian). Averaging by a quadric-quartic polynomial increases the smoothness of lines, adds momentum and rhythm. Extrapolation by the sinusoid function near a constant allows adjusting the delay or lead of signals. The value of the phase - wave s
Классификатор силы тренда. Показания на истории не меняет. Изменяется классификация только незакрытого бара. По идее подобен полной системе ASCTrend, сигнальный модуль которой, точнее его аппроксимация в несколько "урезанном" виде, есть в свободном доступе, а также в терминале как сигнальный индикатор SilverTrend . Точной копией системы ASCTrend не является. Работает на всех инструментах и всех временных диапазонах. Индикатор использует несколько некоррелируемых между собой алгоритмов для класси
FFx Universal Strength Meter PRO is more than a basic strength meter. Instead of limiting the calculation to price, it can be based on any of the 19 integrated strength modes + 9 timeframes. With the FFx USM, you are able to define any period for any combination of timeframes. For example, you can set the dashboard for the last 10 candles for M15-H1-H4… Full flexibility! Very easy to interpret... It gives a great idea about which currency is weak and which is strong, so you can find the best pai
The FFx Universal MTF alerter shows on a single chart all the timeframes (M1 to Monthly) with their own status for the chosen indicator. 9 indicators mode (MACD-RSI-Stochastic-MA-ADX-Ichimoku-Candles-CCI-PSAR). Each can be applied multiple times on the same chart with different settings. Very easy to interpret. Confirm your BUY entries when most of the timeframes are showing green color. And confirm your SELL entries when most of the timeframes are showing red color. 2 Alert Options : input to s
The FFx Watcher PRO is a dashboard displaying on a single chart the current direction of up to 15 standard indicators and up to 21 timeframes. It has 2 different modes: Watcher mode: Multi Indicators User is able to select up to 15 indicators to be displayed User is able to select up to 21 timeframes to be displayed Watcher mode: Multi Pairs User is able to select any number of pairs/symbols User is able to select up to 21 timeframes to be displayed This mode uses one of the standard indicators
FFx Patterns Alerter gives trade suggestions with Entry, Target 1, Target 2 and StopLoss .... for any of the selected patterns (PinBar, Engulfing, InsideBar, OutsideBar) Below are the different options available: Multiple instances can be applied on the same chart to monitor different patterns Entry suggestion - pips to be added over the break for the entry 3 different options to calculate the SL - by pips, by ATR multiplier or at the pattern High/Low 3 different options to calculate the 2 TPs -
MetaTrader 4 version available here : https://www.mql5.com/en/market/product/24881 FFx Basket Scanner is a global tool scanning all pairs and all timeframes over up to five indicators among the 16 available. You will clearly see which currencies to avoid trading and which ones to focus on. Once a currency goes into an extreme zone (e.g. 20/80%), you can trade the whole basket with great confidence. Another way to use it is to look at two currencies (weak vs strong) to find the best single pairs
MetaTrader 4 version available here: https://www.mql5.com/en/market/product/25793 FFx Pivot SR Suite PRO is a complete suite for support and resistance levels. Support and Resistance are the most used levels in all kinds of trading. Can be used to find reversal trend, to set targets and stop, etc. The indicator is fully flexible directly from the chart 4 periods to choose for the calculation: 4Hours, Daily, Weekly and Monthly 4 formulas to choose for the calculation: Classic, Camarilla, Fibonac
ClassicSBA
Umri Azkia Zulkarnaen
this indicator very simple and easy if you understand and agree with setup and rule basic teknical sba you can cek in link : please cek my youtube channel for detail chanel : an for detail info  contact me  basicly setup buy (long) for this indicator is Magenta- blue and green candle or magenta - green  and green candlestik and for setup sell (short) is Black - yellow - and red candle or black - red  and red candlestik
this indicator is a Spike detector indicator, it is specially designed to trade Boom 1000, Boom 500, Crash 1000 and Crash 500 We recommend using it on Deriv Boom and Crash indices only Its setting is intuitive, familiar, easy to use it has notification functions; audible notifications and push notifications. this tool is simple to use, easy to handle This update is based on different strategies for spikes
Trend and Signals MT5  indicator scans  30 trading Instruments (Forex, Metals and Indices).     It uses special algorithm on the  current market   based on   Pure Price Action   and display the overall trend and signal on the dashboard. When signals are produced the indicator sends alert and notification. Strategy for Signals This indicator uses the daily timeframe to determine the direction of the trend. The hourly timeframe is used to identify possible entries. Main trend and is determined by
This indicator is based on a mathematical formula and an ANN combined, designed to make a model(using previous prices) of the most recent market condition (any chart*) in order to use the model as a forecasting tool. *This indicator can operate on any chart/timeframe, but it's suggested you use multiple timeframes for each trade because this method relies solely on the time factor, you can not use this indicator to predict price volatility, but if it's fit correctly it will show you when the nex
This indicator is based on the crossing of two Moving Average with the RSI It is intended for scalpers Specially designed for Boom and Crash syhtetic indices from Binary.com/Deriv.com It is easy to use and intuitive. We recommend its use on M1 and is equipped with three types of notification Email alert Sound notification Push notification these parameters can be activated and deactivated.
This indicator is a scalping indicator intended solely for the Boom and Crash indices of the Deriv Limited market It supports Boom 500, Boom 1000, Crash 500 and Crash 1000 Not repaint and no bug The settings are intuitive and easy to use The product activation number is 20 The Time Frame used depends on the user If you are an aggressive scalper then just use M1 For long trades use M15 If you are conservative use M5 Please contact me for more details of its use
The Recuroid indicator shows very good entry points. Just look at the screenshots, then download the free version and look in the strategy tester and see for yourself. The system is based on two key algorithms. The first algorithm (managed) creates a system of balanced transition from the buy zone to the sell zone and vice versa, draws arrows and lines, and forms entries. The second algorithm (managing) corrects the initial data for the first algorithm (managed) by measuring virtual windows, t
Live broadcast of the indicator on YouTube. Please click on the link below for more credibility. There are also videos of the indicator that you can watch. Note that the broadcast is late, do not rely on it. Only a review of the indicator is only a review of the indicator’s accuracy, which does not lose almost and the profit rate reaches 95%. I will work with great accuracy on the CRASH coin 1000 INDICES
Tatino Super Signals is Non Repaint Indicator for Binary Option trading and Forex trading. Recommendations: Timeframe: All timeframes. For best results we recommend using it on M1, M5 and M15 timeframes. Currency pairs: All Pairs Account type: All Type Broker time: Any Brokers : Alls Binary Trading : Expired 1 Candle Buffer Buy=1, Sell=0, Entry Next Candle Recommended Forex trading stop loss : 15 pips Recommended  Forex tradingTake profit levels : 15 pips Specifications: Does not repaint   Pa
Magicx
Hasan Abdulhussein
The indicator places a buy or sell signal when the conditions of the strategy it was designed with are met. The strategy is guaranteed, strong, and has been tested for 9 years. The indicator is for binary options and can be converted into a bot by linking it to MT2Trading, where it sends the signal to this platform. This platform automatically opens a trade on the trading platform you are using, whether it is Pocket Option, IQ Option, or any other binary options platforms. The entry is on the n
バイナリーオプションのインジケーターです。移動平均シグナル確認を使用して巻き込みローソク足を計算します。緑の買い矢印と赤の売り矢印がチャートに表示されます。 複数のペア(EUR/USD、EUR/JPY、USD/JPY...など)の3分足チャートと5分足チャートでテストされています。 EUR/JPY OTC や EUR/USD OTC などの Pocketoption OTC 市場でも機能します。 初心者向け、 マーチンゲールを使用している場合、推奨される設定は次のとおりです。 初期投資: $1.00 マーチンゲール乗数: 2.5 マーチンゲールステップ: 5 エキスパートトレーダーにとって、 マーチンゲールを使用する場合、初期投資はリスク管理戦略に従って決定されます。ただし、2.5 マルチプライヤーを強くお勧めし、ステップは 5 に維持します。 インジケーターはおそらく 5 番目のステップに到達しないでしょうが、インジケーターが売買できる余地をある程度与える必要があります。 添付のスクリーンショットをご覧ください。そして  ご質問がございましたら、お気軽にお問い合わせくだ
CBT Quantum Maverick 高効率バイナリーオプション取引システム CBT Quantum Maverickは、高いパフォーマンスとシンプルさを追求するトレーダー向けに設計されたバイナリーオプション取引システムです。カスタマイズの必要がなく、最適化された状態で使用を開始できます。シグナルに従うだけで、少しの練習でマスターできます。 主な特徴: シグナルの精度: 現在のローソク足を基に次のローソク足の取引シグナルを生成し、頻繁な再描画がありません。 多様な市場対応: バイナリーオプション取引に特化し、さまざまなブローカーや資産クラスに対応しています。 対応可能: Deriv Synthetic Charts :すべてのタイムフレームで使用可能。 OTCチャート :Quotex、PocketOption、Binomo、Stockity、IQOption、Exnova、OlympTrade、Deriv、Binolla、Homebrokerなどのブローカーに対応。MT5へのインポートは最初の1週間無料、その後は有料サービス。 FX、仮想通貨、商品市場 :幅広い資産利用が可能
Introducing to your attention an innovative expert advisor created specifically for the most juicy and volatility    currency     basket: GBPUSD, XAUUSD and EURJPY. This system is designed using the main features of this market's movement, making it an ideal choice for dynamic trading on high-trending and medium-volatile pairs.   The signals are focused on minimizing trading risks, aiming to reduce losses to a minimum. Main features ESignals is designed to show open and close arrows at the beg
I'll keep it Short and to the point.  Let Your Backtest Results Speak for Themselves. After much deliberation, we’ve decided to release the foundational logic behind our process for public use. This isn’t about changing the way you trade—because we know that’s unique to you. The best ways to enter a position? Those have always been confidential ! What we can share is the first of three essential steps we use before entering any trade. This tool is designed to keep you on the right side of the m
This strategy focuses on identifying and following clear market trends by filtering out noise and short-term fluctuations. Using advanced algorithms, it highlights significant upward and downward movements, enabling traders to make data-driven decisions. The indicator is designed for simplicity and precision, ideal for traders who prefer a systematic approach to trend trading. Whether you're a beginner or an experienced trader, this tool helps you stay aligned with the dominant market direction
作者のその他のプロダクト
マルチタイムフレーム移動平均線インジケーター マルチタイムフレーム移動平均線インジケーターで、市場のトレンドをより深く理解しましょう。この強力なMQL5ツールを使用すると、5つの異なる時間足の移動平均線を1つのチャートに同時に表示できます。複数のインジケーターをワークスペースに表示することなく、さまざまな視点から価格のダイナミクスに関する包括的な洞察を得ることができます。 主な機能: マルチタイムフレーム分析: 1つのチャートに、異なる時間足(例:M15、H1、H4、D1、W1)から最大5つの移動平均線を表示します。 カスタマイズ可能な期間: 表示されるすべての線に対して、希望する移動平均線の期間を簡単に設定できます。 多様なMAタイプ: 単純移動平均 (SMA)、指数移動平均 (EMA)、平滑化移動平均 (SMMA)、線形加重移動平均 (LWMA) など、幅広い移動平均線タイプから選択できます。 調整可能な時間足: 監視したい任意の5つの時間足を選択でき、比類のない柔軟性を提供します。 クリーンな視覚化: 複数のトレンドの視点を一目で確認でき、時間足間の合致点や乖離を特定するのに役立
MQL5用の 季節分解インジケーター は、金融時系列データ内の基底トレンドと季節パターンを特定および分析するために設計された強力なツールです。価格の動きをその中核的な構成要素に分解することで、このインジケーターは市場のダイナミクスをより明確に示し、より情報に基づいた取引決定を可能にします。 主な機能: トレンドライン: 短期的な変動を平滑化し、市場の長期的な方向を明確に視覚化します。 季節ライン: 日次、週次、月次サイクルなど、定期的な間隔で発生する繰り返しのパターンを強調表示します。 カスタマイズ可能な期間: ユーザーは、特定の金融商品や取引戦略に合わせて分解を調整するために、 トレンド期間 と 季節期間 の両方を定義できます。この柔軟性により、さまざまな時間枠と市場行動にわたる分析が可能です。 市場洞察の向上: 予測可能な季節的影響を基底トレンドの動きから分離することで、価格行動のより深い理解を得ることができます。 このインジケーターは、テクニカル分析を改善し、周期的なパターンを取引戦略に組み込みたいトレーダーにとって非常に貴重な資産です。
移動平均線内蔵型RSIインジケーター このインジケーターは、相対力指数(RSI)とその内蔵された移動平均線を組み合わせ、市場の勢いをより明確かつ動的に表示します。誤ったシグナルを発しやすい標準的なRSIとは異なり、この強化版は、トレーダーがより高い確信を持ってトレンドを確認し、潜在的な反転を特定するのに役立ちます。 主な特徴: 統合された移動平均線: インジケーターは、RSIライン上にカスタマイズ可能な移動平均線を直接プロットします。これにより、トレンドの変化を簡単に特定し、シグナルを確認できます。 早期シグナル検出: RSIとその移動平均線のクロスオーバーを観察することで、トレーダーは標準のRSI単体よりも早く潜在的なエントリーおよびエグジットポイントを見つけることができます。 カスタマイズ可能なパラメーター: RSI期間、移動平均線期間、移動平均線の種類(SMA, EMAなど)、および適用価格を取引戦略に合わせて調整できます。 アラート機能: クロスオーバーイベント、買われすぎ/売られすぎの状況、またはRSIラインが特定のレベルを突破した際に通知を受け取ります。 ユーザーフレンドリ
シグナル付き移動平均線傾斜 この革新的なインジケーターは、単純な移動平均線を超え、その傾斜の動的で強力な分析を提供します。移動平均線の傾斜を計算して表示するだけでなく、その傾斜の移動平均も表示し、トレンドの変化や勢いの転換に非常に効果的なシグナルを作成します。この二重レイヤー分析は、トレーダーがノイズを除外し、真のトレンドの強さと潜在的な反転をより高い精度で特定するのに役立ちます。 主な特徴: 二重レイヤー分析: このインジケーターは、主要な移動平均線の傾斜と、その傾斜の二次移動平均線をプロットします。これにより、より滑らかで信頼性の高いシグナルが提供されます。 早期トレンド変化検出: 傾斜線が正から負(またはその逆)に変化することは、トレンド変化の強力な早期警告です。傾斜とその移動平均線のクロスオーバーは、優れたエントリー/エグジットシグナルを提供します。 カスタマイズ可能なパラメーター: 主要な移動平均線と、傾斜の二次移動平均線の両方の期間と種類を、特定の取引スタイルに合わせて調整できます。 視覚的な明瞭さ: インジケーターは、別のサブウィンドウに表示され、ゼロラインがあるため、正
マルチタイムフレームとカスタマイズ可能な設定を備えた移動平均線 移動平均線は、あらゆるトレーダーにとって不可欠なツールです。当社の高度な 移動平均線 インジケーターは、標準的なものを超越し、比類のない柔軟性と制御を提供します。このインジケーターを使用すると、任意の時間枠の移動平均線を現在のチャートに表示でき、独自の視点を提供し、見逃していたかもしれないトレンドを発見するのに役立ちます。 主な特徴: マルチタイムフレーム機能: 任意の時間枠(例:H4、日足、週足)の移動平均線を現在のチャートに直接表示できます。 カスタマイズ可能な設定: 移動平均線の 期間 、 シフト 、および タイプ (SMA、EMA、SMMA、LWMA)を簡単に調整して、特定の取引戦略に合わせることができます。 直感的なインターフェース: このインジケーターは、ユーザーフレンドリーで設定が簡単になるように設計されています。 当社の多機能移動平均線インジケーターを使用して、取引分析を強化し、市場のより明確な視点を手に入れましょう。
フィルタ:
レビューなし
レビューに返信