Watch the Market tutorial videos on YouTube
How to buy а trading robot or an indicator
Run your EA on
virtual hosting
virtual hosting
Test аn indicator/trading robot before buying
Want to earn in the Market?
How to present a product for a sell-through
Expert Advisors and Indicators for MetaTrader 5 - 26

Drawdown Guardian Pro (v2.8) - Your Comprehensive Account Protector for MT5! Protect your capital from unforeseen risks and catastrophic losses! "Drawdown Guardian Pro" is a powerful and flexible proactive risk management tool for MetaTrader 5. It continuously analyzes your account's status and automatically applies configured safety measures when critical drawdown limits, equity levels are reached, or when trading occurs outside allowed times. An indispensable assistant for controlling automat

Breakout Momentum is an automated scalper for EURUSD. Its strategy takes advantage of "false breakout", "breakout", and "raids on liquidity" above and below current marketplace prices. It is effective in both raging and trending markets. It shows promising results during backtesting using "every tick based on real tick" mode. it is also proving itself on a real account.
Where does it work the best? The default parameters are optimized to suit the best EURUSD H1.
It is recommended to use 0.1

the indicator uses multiple time frames to analyze for the best buying entries in boom 1000. it is tailored to help trade on boom spikes only. the indicator has two arrows; red and blue ones. the formation of the red arrow indicates that you should be ready for a blue arrow which is a buy entry signal. the indicator does not offer exit points. always collect 30 pips i.e if you entered a trade at 10230.200 you can exit at 10260.200 with SL at 10 pips i.e at 10220.200. if you observe that rule and
FREE

BOOM AND CRASH PRO SPIKER This indicator is specifically designed for all boom and crash indices. The indicator targets buy spike signals for boom indices and sell spike signals for crash indices. The indicator contains optimized trend filters to target buy spikes in an uptrend and sell spikes in a downtrend. The indicator also adds a grid signal to recover some loss of the first signal. The indicator also provides exit signals for delayed spikes which can help with risk management. Also, it an
FREE

According to Bill Williams' trading strategy described in the book "Trading Chaos: Maximize Profits with Proven Technical Techniques" the indicator displays the following items in a price chart: 1.Bearish and bullish divergent bars: Bearish divergent bar is colored in red or pink (red is a stronger signal). Bullish divergent bar is colored in blue or light blue color (blue is a stronger signal). 2. "Angulation" formation with deviation speed evaluation. 3. The level for placing a pending order (

FollowAndReverse EA is an advanced trading robot designed to automatically trade using the Follow and Reverse strategy. It opens buy or sell orders and reverses positions when price reaches a specified distance, with customizable Take Profit and lot management . Features: Smart Lot Management: Supports multiplication or linear lot increase after each trade. Equity Profit Target: Resets lot size automatically after reaching the specified profit. Flexible Symbol Support: Works on Forex, Gold, US30
FREE

Indicator: Currency Strength Meter Pro Market Breadth Visualization Pros: Instead of looking at cluttered charts, this indicator displays data in a clean "Dashboard" format. Traders can instantly scan and know which pairs are the strongest or weakest. Benefits: Saves time checking individual charts and helps make faster trading decisions on pair selection. Auto-Ranking & Sorting Pros: Features a "Horizontal Ranking" mode which automatically sorts pairs from "Strongest" to "Weakest". Benefits: Al
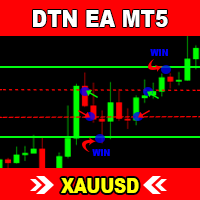
DTN EA MT5 is a fully automated Expert Advisor after research and development in a long time. It uses TREND to open orders, and uses HEDGING STRATEGY to protect your balance. So this stragety will reduce risk, protect your profit and your balance. It's only suitable with XAUUSD (GOLD) chart.
Indicator parameters Type Of First Order - BUY or SELL - The EA will open the first Order with BUY or SELL type. Magic Number - default is 168. Remember change Magic Number before running. The EA will use

Outperform traditional strategies: effective mean reversion for savvy traders Unique indicator that implements a professional and quantitative approach to mean reversion trading. It capitalizes on the fact that the price diverts and returns to the mean in a predictable and measurable fashion, which allows for clear entry and exit rules that vastly outperform non-quantitative trading strategies. [ Installation Guide | Update Guide | Troubleshooting | FAQ | All Products ]
Clear trading signals Am

Prism Scalper Basic v16.0 Prism Scalper Basic v16.0 is a sophisticated MetaTrader Expert Advisor designed for high-frequency scalping across multiple markets, including Forex, Gold, and Cryptocurrency. This trading system employs a proven mean reversion strategy to maximize profit potential while maintaining strict risk management protocols. Key Features Single Strategy Focus: Specialized mean reversion system for clear and consistent performance. Multi-Asset Optimization: Automatically ada
FREE

Ninja Master: Powering Traders & Investors Worldwide. Ninja Master is an advanced and adaptable Gold Expert Advisor developed exclusively for Gold on the 5-minute timeframe . It is a complete trading solution that performs a range of tasks, including following the trend , analyzing the chart , smart TP system , and smart filters . It does not use neural learning or AI — instead, it uses an adaptable smart algorithm designed for traders who prioritize capital protection and steady growth . Create

TIME WIZARD : Mastering The Time Smart Pending Order Assistant
MT4 Version : https://www.mql5.com/en/market/product/136790 MT5 Version : https://www.mql5.com/en/market/product/136791 Blogs : https://www.mql5.com/en/blogs/post/761446
"Time Wizard" is an Expert Advisor (EA) designed specifically for traders who want to take advantage of high volatility approaching market open or news release. This EA automatically places Pending Orders (Buy Stop, Sell Stop, Buy Limit, Sell Limit) according to t

KT Stochastic Alerts is a personal implementation of the Stochastic oscillator that provide signals and alerts based on six custom events: Bullish Crossover: When Stochastic main line cross above the signal line. Bearish Crossover: When Stochastic main line cross below the signal line. When Stochastic enter in an overbought zone. When Stochastic exit from an overbought zone. When Stochastic enter in an oversold zone. When Stochastic exit from an oversold zone.
Features
A perfect choice for tra

KT Price Border creates a three-band price envelope that identifies potential swing high and low areas in the market. These levels can also be used as dynamic market support and resistance. The mid-band can also be used to identify the trend direction. As a result, it also functions as a trend-following indicator. In addition, its ease of use and more straightforward conveyance of trade signals significantly benefit new traders.
Features
It works well on most of the Forex currency pairs. It wo

Volatix AI: Product Description
Harness the explosive power of gold's volatility with Volatix AI , the ultimate scalping solution engineered for the XAUUSD M5 chart. Are you tired of EAs that break down during rapid price swings and high-volatility events? Our revolutionary system is built to thrive in chaos, using a sophisticated neural network to turn market volatility into your greatest advantage. At the heart of Volatix AI is its advanced neural network, supercharged by direct integration

Elevate your trading precision with the Fibonacci Killer Alert MT5, a powerful indicator that harnesses Fibonacci retracement levels to deliver precise entry signals for forex, stocks, crypto, and commodities markets. Celebrated in trading communities like Forex Factory and Reddit’s r/Forex, and praised in discussions on Investopedia and TradingView for its accuracy in pinpointing trend reversals and continuations, this indicator is a favorite among traders seeking high-probability setups. Users
Moving Average Multicurrency Scanner Dashboard MT5 is a powerful trading tool designed to monitor multiple currency pairs and timeframes using customizable moving averages. It organizes signals in a grid format, displaying each symbol’s status across timeframes from M1 to MN1. Traders can enable or disable specific timeframes to align with their strategies. You can find the MT4 version here: Moving Average Multicurrency Scanner MT4 For detailed documentation click here: Documentation Key Featur

Enhance your trading accuracy with the SSL Channel Indicator MT5 , a dynamic tool designed to visualize price trend dynamics through the innovative Semaphore Signal Level (SSL) approach. Rooted in technical analysis concepts popularized in trading communities like MQL5 and Forex Factory, this indicator uses two 10-period simple moving averages (SMAs)—one for highs and one for lows—to form a responsive price envelope. Renowned for its simplicity and effectiveness in identifying trend changes, it’

Among the top indicators offered here on the market in terms of value for money.
I recommend you to read the product's blog (manual) from start to end so that it is clear from the beginning what the indicator offers. This supply and demand zone indicator draws the zones on the chart and sends alerts when the price has reached or broken a zone. It has support for one nested zones (zones on one other time frame than the current) which will also be drawn on the chart and involve alerts. It i

A utility for automatically setting breakeven levels, transfers trades to breakeven when passing a given distance . Allows you to minimize risks. Created by a professional trader for traders. Utility works with any market orders opened manually by a trader or using advisors. Can filter trades by magic number. The utility can work with any number of orders simultaneously. MT4 version https://www.mql5.com/ru/market/product/57076 WHAT THE UTILITY CAN DO: install virtulnoe levels b

Download the new version and get access to the Professional version.
Special offer for a limited time!
Trade Assistant for MT5
Key Features Trade Execution & Order Management Intelligent Order Execution Panel – Quickly place market, pending, and snipe orders . Dynamic Lot Size Calculation – Adjusts lot size based on risk percentage or predefined amount . Partial Take Profit (TP) and Stop Loss (SL) – Secure profits and minimize losses systematically.
Risk Management &
FREE

This EA is a private edition developed for traders who are part of our advanced testing and support program.
It offers early access to selected configurations and system updates that will later be integrated into the main public release.
Only users who have previously communicated with our team and received confirmation should proceed with the purchase.
The EA operates using our latest optimization logic and is intended for professional traders who understand the importance of running control
Mega Spikes Max is a specialized indicator for Boom and Crash synthetic indices that generates trading signals with automatic alert notifications. Features The indicator analyzes market conditions using proprietary algorithms and displays buy/sell arrows directly on the chart. It works specifically with Boom and Crash indices on M5 timeframe. Signal generation combines multiple technical analysis methods to identify potential trading opportunities. The system provides two TP levels and SL calcu

Full implementation of Directional Movement System for trading, originally developed by Welles Wilder, with modifications to improve profitability, to reduce the number of unfavorable signals, and with Stop Loss lines.
No re-paint
Features
Buy/sell signals displayed on the chart Stop levels visually indicated on the chart Profit-taking points presented in the indicator window Exit points for unfavorable positions presented in the indicator window Signal confirmation through high/low swing cros

The Inside Bar pattern is a very well known candlestick formation used widely by traders all over the world and in any marketplace. This approach is very simple and adds a little confirmation candle, so it adds a third past candlestick to the count to confirm the direction of the move (upward or downward). Obviously, there is no power on this candlestick formation if the trader has no context on what it is happening on the market he/she is operating, so this is not magic, this "radar" is only a
FREE

RSI Robot Easy This fully configurable robot has the purpose of executing orders using the RSI indicator as a base. It is possible to choose whether the entries will happen when entering the overbought areas and / or when leaving the oversold area. It is possible to configure stoploss and takeprofit, as well as the maximum number of orders at a time.
Aurélio Machado.
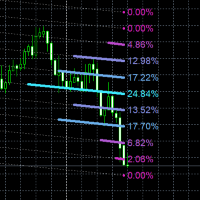
The Linear Regression Volume Profile indicator combines linear regression analysis with volume distribution profiling to create a sophisticated market structure visualization tool. The foundation begins with linear regression calculation across a specified number of historical bars, computing both the slope (tilt) and y-intercept values that define the trend line's trajectory through price action. This regression line serves as the central axis around which volume distribution is analyzed, autom

The indicator displays volume profiles based on the nesting principle. Profiles periods are pre-set so that each subsequent profile has a length twice as long as the length of the previous profile. In addition to profiles, the indicator displays volume clusters sorted by color, depending on the volume they contain.
Indicator operation features The indicator works on typical timeframes from M5 to MN, but for calculations uses historical data from smaller timeframes: M1 - for timeframes from M5
FREE

This wonderful tool works on any pair producing alerts whenever the market enters the overbought and oversold zones of the market. The signals come as BUY or SELL but it does not necessarily mean you should go on and execute order, but that you should begin to study the chart for potential reversal. For advanced signal tools check out some of our premium tools like Dual Impulse.
FREE

Phoenix Candlestick Pattern Monitor (MT5)
Real-time candlestick pattern detection and monitoring tool for MetaTrader 5. Automatically identifies classic candlestick patterns across multiple symbols and displays comprehensive pattern statistics through a visual dashboard.
Overview
Phoenix Candlestick Pattern Monitor detects and tracks Doji, Hammer, Shooting Star, Bullish Engulfing, Bearish Engulfing, Morning Star, Evening Star, Three White Soldiers, and Three Black Crows patterns. The system
FREE

Do you like Meta Trader? Nice, me too. Have you missed one or more features that could exist in it? Me too. Annoyed by this, I decided to create the Trade Panel. This tool has two versions: Lite and Pro. It is literally magical! It expands, and a lot, the possibilities of your Meta Trader! It ceases to be a good program and becomes excellent! Do you doubt? It is okay. Buy and see for yourself ;) One warning: you will love it! Lite version (free): https://www.mql5.com/en/market/product/40410 A

Projective SR - Real-Time Projected Support and Resistance Projective SR is an advanced indicator that automatically detects key support and resistance points on the chart and projects them diagonally and dynamically into the future , anticipating potential areas where the price might react. Unlike traditional indicators that only show static, fixed levels, Projective SR analyzes price geometry , identifies the most relevant pivots, and draws sloping lines that adapt to market movement. These li
FREE

This Expert Advisor (EA) combines trend analysis with a breakout strategy to identify trading opportunities in gold. The EA first determines the prevailing market trend using key trendlines. In an uptrend, it focuses on the nearest resistance level, anticipating a breakout through it. Similarly, in a downtrend, it targets the closest support level, preparing for a breakout below. The strategy is designed to align trades with market momentum, following predefined conditions for breakout scenarios

Volume Profile Flex - POC, VAH and VAL with Price Level Display
Volume Profile Flex is a flexible and performance-optimized Volume Profile indicator designed to help traders identify important price levels based on traded volume rather than time.
The indicator provides a clear view of market acceptance areas, price rejection zones, and the most actively traded price levels directly on the chart. Main Features:
The indicator automatically calculates and displays key Volume Profile levels within
FREE

I present you the settings and parameters of the Nagara bot, an ultramodern tool for working in the Forex market. This bot uses advanced capital management technologies and market analysis to determine the trends and make reasonable trading decisions. In addition, it is equipped with a flexible control and protection system for each position.
Currency pairs for trading: Eurusd, USDJPY, GBPUSD, AUDUSD, USDCAD, USDSHF, NZDUSD, EURJPY, GBPJPY, EURGBP, AUDJPY, EURAUD, EURCHF, AUDNZD, NZDJPY, G

Night Swimmer is a powerful night scalping EA: Experience night trading with Night Swimmer EA, an advance scalping system designed for low-volatile market conditions. it is important to use this EA with caution and only risk an amount you are comfortable with. We encourage you to backtest the EA with real ticks modelling and experiment with the settings to find the ones that work best for you. Before entrusting real funds to this EA, conduct forward testing to thoroughly grasp its behavior. Thi
FREE
UT Bot with Alerts The UT Bot Alerts Indicator for MetaTrader 5 is a versatile trading tool that generates buy and sell signals based on ATR-based trailing stop logic. It displays signals with arrows, draws an entry price line, and includes a candle countdown timer. The indicator offers customizable alerts (pop-up, email, push notifications) and a text label showing signal details. Users can adjust ATR sensitivity, label positions, and timer settings, making it suitable for various markets and
FREE

This indicator converted from 5 min Buy and Sell Range Filter - guikroth version on TradingView Popularity of the Range Filter
The Range Filter is a very popular and effective indicator in its own right, with adjustments to the few simple settings it is possible to use the Range Filter for helping filter price movement, whether helping to determine trend direction or ranges, to timing breakout or even reversal entries. Its practical versatility makes it ideal for integrating it's signals into a

Gold Scalper Pro PSAR ADX Dashboard MT5 Professional Multi-Timeframe Trading Indicator with Advanced Signal Detection Overview The Parabolic SAR V3 + ADX is a sophisticated technical analysis indicator that combines the trend-following capabilities of the Parabolic Stop and Reverse (PSAR) with the momentum strength measurement of the Average Directional Index (ADX). This enhanced version features pair-specific optimization, a multi-language alert system, and a comprehensive multi-timeframe dashb
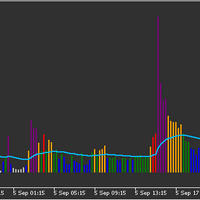
Volume indicator judging level of volume per bar accordingly to Volume Spread Analysis rules. It allows either to set static volume levels or dynamic ones based on ratio comparable to Moving Average. Bars are coloured based on ratio or static levels, visually presenting level of Volume (low, average, high, ultra high). Release Notes - Fixed and optimised calculations of Session Average Volume
- added predefined settings for time to calculate Session Average for EU and US markets
FREE

Smart Liquidity Hunter PRO Smart Liquidity Hunter PRO is an automated trading system that analyzes price movements across two timeframes to identify potential trading opportunities. The EA monitors for price extensions beyond recent highs and lows on a higher timeframe, then confirms entries using price gap patterns on a lower timeframe. How It Works The strategy begins by establishing market direction on a higher timeframe using either market structure analysis or moving average indicators. Wh

Short Description:
FTMO Protector PRO MT5 is an EA designed to protect your funded account by managing risk and ensuring compliance with the Prop Firm's trading rules. This EA automatically monitors equity levels, closes trades when profit targets or drawdown limits are reached, and provides a visual display of key account metrics. EA w orks with all different Prop Firm service providers.
Overview:
FTMO Protector PRO MT5 is an Drawdown Safeguard Expert Advisor meticulously crafted for trade

ICT Silver Bullet CRT EA: Master the Market's True Rhythm Are you an ICT student who understands the power of timing and liquidity, but struggles to be present for every high-probability setup? Do you want to automate the precision of the "Silver Bullet" strategy to ensure you never miss an opportunity? Introducing the ICT Silver Bullet CRT EA , the ultimate tool for traders who think in terms of liquidity, market structure, and fair value. This Expert Advisor was meticulously programmed to repl
FREE

A simple but very effective and highly customizable Expert Advisor based on "Silver Bullet" strategy, invented by the famous ICT trader. The strategy is based on entering a trade on the first FVG (Fair Value Gap, or Imbalance), formed in a certain time period with increased volatility, also called a KillZone. Due to high volatility during KillZone, this FVG has a high probability of working out, which allows you to make high-quality and profitable trades with a high Risk to Reward ratio. MT4 ver

This is the technical document for GTB (Grid Trader Brazil) for the Market version. It details the strategic operation and the complete dictionary of available parameters. https://c.mql5.com/31/1716/default_en_set__1.set DEFAULT ENGLISH SET!
Technical Manual: GTB v2.1 (Market Version) 1. Strategy & Architecture GTB (Grid Trader Brazil) is an automated trading system that operates directly on the MetaTrader 5 terminal. It manages order execution, risk control, and technical analysis autonomousl
FREE

What is SMC Market Structure Pro? SMC Market Structure Pro is an automated trading Expert Advisor for MetaTrader 5 , developed based on Smart Money Concept (SMC) and market structure analysis . The EA is designed to help traders follow the natural flow of the market , focusing on price structure instead of indicators or lagging signals. How Does the EA Work? The EA analyzes market structure changes using pure price action: Detects higher highs & higher lows for bullish structure Detects l
FREE

Introducing FusionTrader, an advanced algorithm meticulously optimized for trading GBPUSD on the M5 chart, utilizing both pending orders and market execution. Our EA takes the complexity out of trading, analyzing the market and entering based on various factors and indicators, including RSI, moving averages, and candlestick patterns. The FusionTrader algorithm meticulously analyzes every tick in the market to try and pinpoint the optimal initial entry point. By combining multiple confluences,
FREE
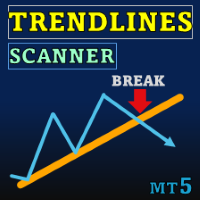
Special offer : ALL TOOLS , just $35 each! New tools will be $30 for the first week or the first 3 purchases ! Trading Tools Channel on MQL5 : Join my MQL5 channel to update the latest news from me The Trendlines with Breaks Scanner is a state-of-the-art trading tool designed to help traders identify critical trends and detect breakouts in real time. With automatically generated pivot-point-based trendlines, this indicator empowers traders to seize trading opportunities with precis

IMPORTANT: Before proceeding with backtests and launching the robot, make sure to set the Lot_plus value to "true" instead of "false" to enable automatic lot calculation. It is also crucial to adjust the Cut_loss to 54 instead of 1 to optimize risk management. DESCRIPTION: GridBreakout is an automated trading robot specialized in trading the GBP/USD forex pair. Utilizing a grid technique, it is designed to capitalize on market breakouts, offering a dynamic and responsive strategy to market movem
FREE
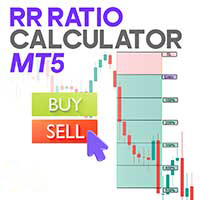
Risk Reward Ratio Calculator Indicator for MT5
The Risk Reward Ratio (R/R) Calculator is a valuable tool designed to help traders set Take Profit (TP) and Stop Loss (SL) levels directly on the chart while instantly analyzing the risk-to-reward ratio of each trade. This indicator comes with an intuitive management panel that allows easy adjustment of all levels, along with a movable information box that clearly displays the Take Profit, Entry Point, and Stop Loss values. Traders can place these
FREE

VM Breakout BB: Probability-Based Breakout Indicator with Bollinger Bands
VM Breakout BB is a breakout detection indicator based on Bollinger Bands combined with statistical probability analysis (Z-score and the normal cumulative distribution function, CDF) and smart confirmation filters such as RSI, ADX, and Volume SMA. The indicator aims to deliver signals with a clear statistical basis, reduce noise, and confirm breakouts that have a higher probability of success. Signal logic Buy: price cl
FREE

Introduction The "Ultimate Retest" Indicator stands as the pinnacle of technical analysis made specially for support/resistance or supply/demand traders. By utilizing advanced mathematical computations, this indicator can swiftly and accurately identify the most powerful support and resistance levels where the big players are putting their huge orders and give traders a chance to enter the on the level retest with impeccable timing, thereby enhancing their decision-making and trading outcomes.
FREE

Big Candle Break Out is an expert advisor that uses a simple and effective trading strategy based on significant changes in volatility. The EA identifies support and resistance levels on the chart and looks for a candle that breaks through one of these levels with at least x volume. This can signal a shift in the market’s direction and provide a potential trading opportunity. The EA can trade both long and short positions depending on the direction of the break out and this expert has three mon
FREE

Neon Trade — a cutting-edge trading solution that opens the door to your financial freedom and the highest level of trading I aimed to create a unique trading solution capable of meeting the needs of any trader, regardless of their goals or tasks. The core idea was to combine machine learning with advanced trading techniques in a way that maximizes the benefits of their synergy. The system is suitable both for rapidly growing small accounts within 1–2 months and for long-term, multi-year invest

Stochastic Scalper — MT5 Expert Advisor (by iXOpay) Stochastic Scalper is a MetaTrader 5 Expert Advisor that trades using Stochastic Oscillator signals.
Its logic combines configurable entries, additional multi-timeframe confirmations, and flexible risk management.
The goal is to provide a robust testing and optimization tool adaptable to different instruments. Technical tool. Not financial advice. Test on demo before live. How it works
Primary entry: configurable %K and %D (default M5).
Confi
FREE

Boom and crash Gold Miner v2 trend histogram which works in conjunction with the indicator above that has arrows as shown in the video. PLEASE Note: That the top indicator and the bottom indicator are two separate indicators. the top indicator is https://www.mql5.com/en/market/product/98066 the bottom one is free. which is the histogram at the bottom. the trend histogram trading tool that helps to easy detect the trend blue color indicates an uptrend. Orange color is a down trend.
FREE

SAM Waves PRO – Professional Signal Indicator for Day Trading SAM Waves PRO is the extended version of the popular SAM Waves indicator, designed specifically for disciplined intraday Forex traders. It includes real-time notifications via push, email, and sound alerts, ensuring you never miss a qualified trading signal. Backtested on over 5.5 years of historical data, the strategy has achieved a consistent win rate above 60 percent when traded using a fixed stop loss and take profit between 20 an
Ekom Spike Detector
Navigate the volatile world of Boom and Crash indices with the Ekom Spike Detector Indicator. This powerful tool detects explosive price movements, providing traders with precise buy and sell signals 24/7.
Key Features:
Spike Detection : Identify high-probability spike patterns in real-time Clear Visual Signals : Displays clear buy and sell arrows on the chart for easy decision-making Customizable : Easily switch from either Boom based on individuals choice Reliable : Te
FREE
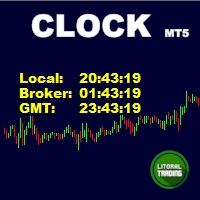
Simple indicator that draws the market hours on chart (broker, local and GMT). Functions: Horizontal distance - from border. Vertical distance - from border. Color - text color. Font - text font. Size - text size. Corner - which chart corner will be drawn. Show seconds - show or hide seconds. Draw as background - candles front or back. Label local - text before local time. Label broker - text before broker time. Label GMT - text before GMT time. Separator - separator between label and time Objec
FREE

Monarch Scalper Elite Launch price $149, after 10 sales it goes up to $249 Monarch Scalper Elite is an expert advisor designed to apply a trading logic based on breakout and potential reversal conditions. The system incorporates volatility filtering and session-based operation so that trades are executed only under user-defined conditions. The EA does not use martingale or grid techniques. All trades follow the risk parameters specified by the user. System Features 1. Volatility Engine The EA in
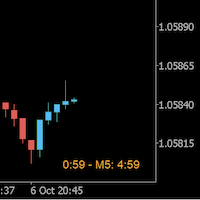
Always wanted to know when the M5 candle closes when you are in M1 ? This indicator allow to display a candle timer (countdown) on the current time frame as well as any higher time frame you have configured for this time frame. So this is easy now to see when the H4 candle closes when you are in H1.
Congifuration Label position, size, color HFT time frame per time frame Any questions or comments, send me a direct message here https://www.mql5.com/en/users/mvonline
FREE

Fractals Dynamic Fractals Dynamic – is a modified free fractal indicator by Bill Williams, in which you can manually set the number of bars on the left and right, thereby building unique patterns on the chart. Now all trading strategies based on or based on the Fractals Dynamic indicator will have an additional signal.
In addition, fractals can act as support and resistance levels. And in some trading strategies, show liquidity levels. For this purpose, levels were introduced in this version
FREE

本指标 基于 Zigzag 基础上... 增加了: 1.增加了箭头指示,使图表更鲜明 2.增加了价格显示,使大家更清楚的看清价格. 3.增加了报警等设置,可以支持邮件发送 原指标特性: 1.基本的波段指标构型. 2.最近的2个ZIGZAG点不具有稳定性,随着行情而改变,(就是网友所说的未来函数) 3.原指标适合分析历史拐点,波段特性,对于价格波动有一定的指导性.
Zigzag的使用方法一 丈量一段行情的起点和终点 (1)用ZigZag标注的折点作为起点和终点之后,行情的走势方向就被确立了(空头趋势); (2)根据道氏理论的逻辑,行情会按照波峰浪谷的锯齿形运行,行情确立之后会走回撤行情,回撤的过程中ZigZag会再次形成折点,就是回撤点; (3)在回撤点选择机会进场,等待行情再次启动,止损可以放到回撤的高点。 一套交易系统基本的框架就建立起来了。 Zigzag的使用方法二 作为画趋势线的连接点 趋势线是很常见的技术指标,在技术分析中被广泛地使用。 但一直以来趋势线在实战中都存在一个BUG,那就是难以保证划线的一致性。 在图表上有很多的高低点,到底该连接哪一个呢?不同的书上画趋势线的方法
FREE

Move TP & SL One Click Manager MT5 is a trading utility script that allows you to quickly move Take Profit (TP) and Stop Loss (SL) for active positions and pending orders with a single click. Script Modes The script supports two working modes: Pips Mode: Set TP and SL based on a fixed pip distance from the order open price. Price Mode: Set TP and SL directly at a specified price level. Order Selection You can choose which orders will be modified: all orders, active positions only, or pending ord
FREE

The balance of supply and demand is a simple and effective market analysis method. The supply and demand diagram can show you in advance, even before the trend reversal, where the supply ends and the demand is already emerging, where the demand ends and the supply is emerging, while substantially increasing the probability of making a deal in the right direction and with a high profit factor.
Indicator signals The indicator uses the price/volume values to generate signals: ED – excess demand. E

LIMITED TIME SALE - 30% OFF!
WAS $50 - NOW JUST $35! A symmetrical triangle chart pattern represents a period of contraction & consolidation before the price is forced to breakout to the upside or breakdown. A breakdown from the lower trendline marks the start of a new bearish trend, while a breakout from the upper trendline indicates the start of a new bullish trend. MT4 Version Available Here: https://www.mql5.com/en/market/product/68709/ This indicator identifies these patterns and

Expret: The Ultimate Recovery Zone Strategy Expert Advisor for MT5 Revolutionize Your Trading with Expret Expret is a cutting-edge Expert Advisor (EA) designed for MetaTrader 5, leveraging the powerful Recovery Zone strategy to maximize your trading potential. Whether you're a novice trader or a seasoned professional, Expret offers unparalleled customization and control to adapt to your unique trading style.
Key Features: 1. Advanced Recovery Zone Strategy: Expret employs a sophisticated Recov
FREE
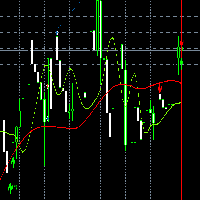
Who does not want to predict markets prices? This indicator gives you more confidence to take position. It gives you alerts with a pourcentage of chance that next candle could be bearish or bullish. Of course we can not predict future but we can try.... You can adjust pourcentage in order to get more precise filter. Do not hesitate to contact me for informations.
Level Box Tool is a powerful and user-friendly custom indicator designed for traders who utilize technical analysis tools like rectangles and trend lines to identify key support, resistance, and price zones. This tool simplifies and speeds up the process of marking chart levels, offering both visual clarity and precision with its fully customizable panel, and now includes price-cross alerts — so you’ll never miss a key level again. MT4 Version - https://www.mql5.com/en/market/product/136009/ Jo
FREE

Enhance your trading analysis with the Haiken Ashi MT5 indicator. This powerful tool transforms standard price data into smoother, trend-following candlesticks, making it easier to identify market trends and potential reversal points. Key Features: Clear Trend Identification: Visually distinguish between uptrends and downtrends with distinct candle colors. Reduced Noise: Filter out price fluctuations, providing a clearer view of underlying market movements. Early Trend Detection: Anticipate
FREE
The MetaTrader Market is a unique store of trading robots and technical indicators.
Read the MQL5.community User Memo to learn more about the unique services that we offer to traders: copying trading signals, custom applications developed by freelancers, automatic payments via the Payment System and the MQL5 Cloud Network.
You are missing trading opportunities:
- Free trading apps
- Over 8,000 signals for copying
- Economic news for exploring financial markets
Registration
Log in
If you do not have an account, please register
Allow the use of cookies to log in to the MQL5.com website.
Please enable the necessary setting in your browser, otherwise you will not be able to log in.