YY Multi Waves MT5
- Indicators
- Version: 1.0
- Activations: 8
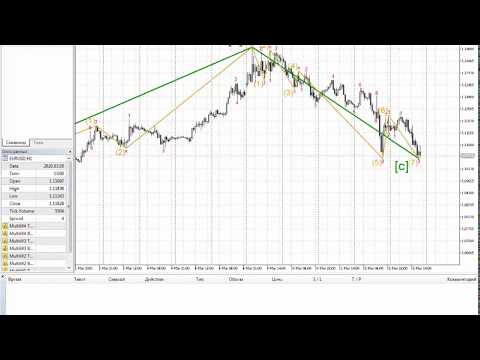
This indicator displays the wave structure of the market in the form several wave levels nested in each other. For each of these levels an automatic preliminary (draft) marking of waves in Elliott's style (123..., ABC... etc.) is created. This markup is completely automatic and absolutely univocal. The indicator is especially useful for beginner wave analysts, because among all the possible versions for wave marking, it allows you to immediately take the most adequate version as a basis, which in the future requires only some (usually small) improvements. For experienced wave analysts, this indicator will also be interesting, because it allows to compare its readings with their own vision of the market wave situation.
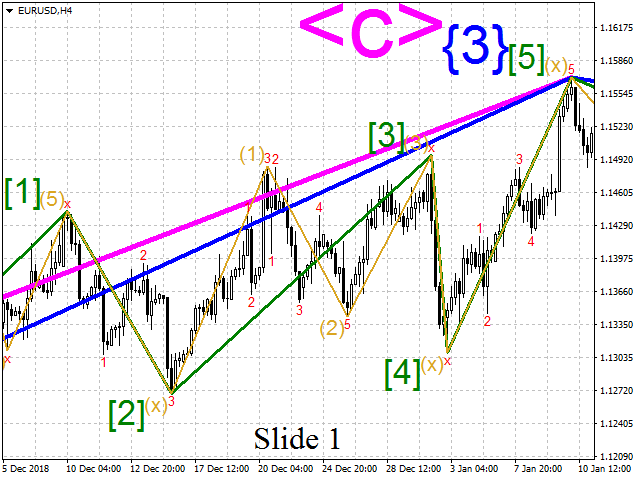
The general appearance of the indicator is shown on slides 1 and 2. Intotal, the indicator can display from one to four wave levels on the screen. Each of these levels has its own designation: from W1 (for the most minor) to W4 (for the most major). Each level is displayed in its own color in the form of lines and / or markings.
The most minor wave level W1 is built on the basis of the zero level, which is denoted as W0. The Mono Waves indicator is used as a zero wave level. This indicator is not part of the Multi Waves indicator, but if desired, it can be downloaded for free in the Market. Please note: the Multi Waves indicator for the wave level W0 only labels its waves (shown in slide 1 in red), and its wave line does not draw. If there is still a need to draw this line, then you should download the Mono Waves indicator (using the free link above) and install it on the chart together with the Multi Waves indicator (and with the same parameter values as Multi Waves).
Each next (major) wave level is built on the basis of the previous (minor) wave level according to the procedure below (see the section entitled "Z‑like and T‑like structures"). For example, the level W2 is built on the basis of the wave level W1.
Parameters
The indicator has the following main parameters:
- Base Mono W0 line: Channel Width in Points – zero wave level: channel width in points;
- Base Mono W0 line: Channel Width in Percents – zero wave level: channel width in percents;
- Draw MultiWave lines – how many wave levels to display;
- Show W0 labels – show (or not) wave marking for zero wave level;
- Show W1 – what to show for the first wave level: only its line, or only its marking, or both, or not show anything;
- Show W2 – analogically, to what to show for the second wave level;
- Show W3 – same for third level;
- Show W4 – same for the fourth.
The first two parameters are used to adjust the zero (base) wave level. Since the Mono Waves indicator (the link to which is given above) is used as this zero level, these two parameters are factually the settings for this indicator.
In addition to the specified parameters, there are also parameters: for choosing the color, as well as the thickness and line style for each of the wave levels W1 – W4.
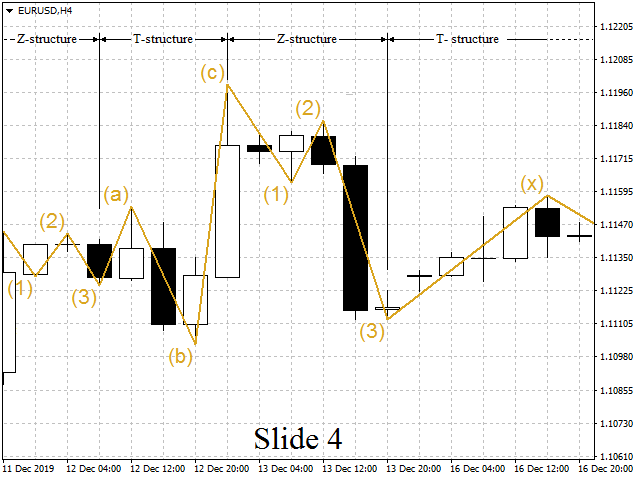
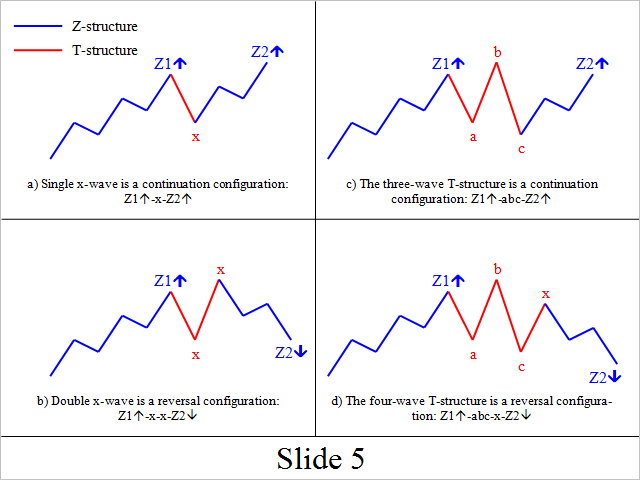
Z‑like and T‑like structures
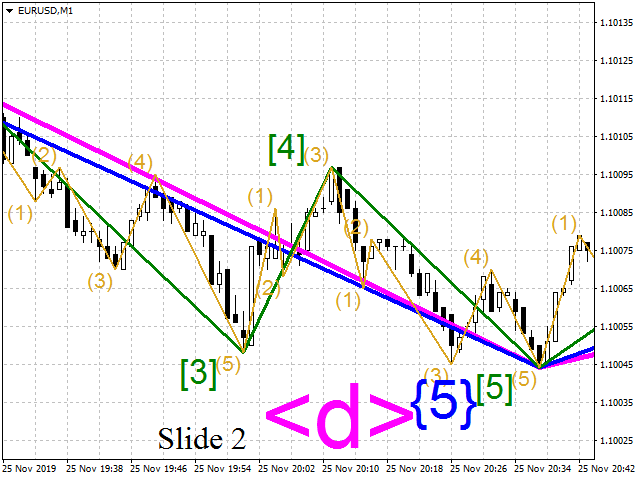
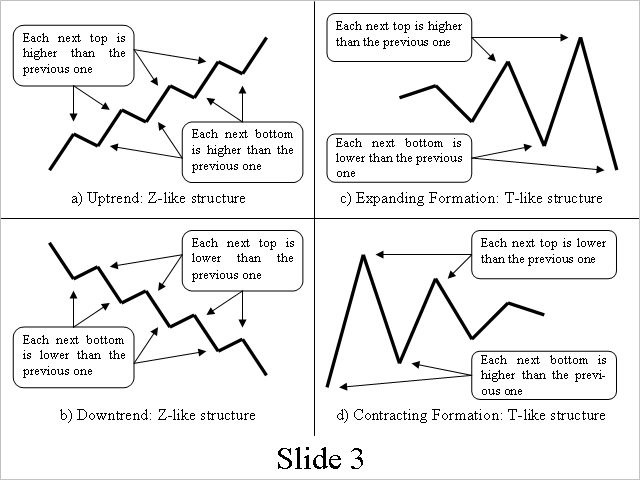
In order to understand the principle of operation of this indicator, should first recall one of the classic definitions of a trend. For the up trend: “Each next top is higher than the previous top, and each next bottom is also higher than the previous bottom” (see slide 3a). For a trend down, this definition will be the opposite: “Each next top is lower than the previous top, and each next bottom is also lower than the previous bottom” (see slide 3b).
And if you slightly change the first of these definitions, for example, this way: "Each next top is higher than the previous top, and each next bottom is lower (and not higher) than the previous bottom". What will happen then? This will be some expanding formation (see slide 3c). This figure, undoubtedly, refers to one of the variants of the sideways trend (i.e., it does not refers to the upward or downward trend).
Now we will slightly change ... (see continued description on the Comments tab).


I like it. Gives me more confidence while trading.