Watch the Market tutorial videos on YouTube
How to buy а trading robot or an indicator
Run your EA on
virtual hosting
virtual hosting
Test аn indicator/trading robot before buying
Want to earn in the Market?
How to present a product for a sell-through
Expert Advisors and Indicators for MetaTrader 5 - 107
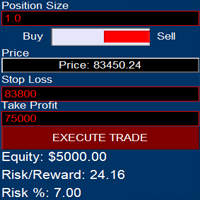
The SmartTrader Panel is a powerful and intuitive trading panel designed to streamline trade execution and risk management in MetaTrader. With its sleek and user-friendly interface, traders can quickly manage their positions, calculate risk metrics, and execute trades with precision. Key Features: One-Click Trading: Easily place Buy or Sell orders with a single click.
Risk Management: Automatically calculates risk percentage, risk-reward ratio, and potential profit/loss.
Customizable Trad
FREE

Introducing Steady Runner NP EA (Free Version): Precision Trading for GBPUSD M5 What is Steady Runner NP EA?
Steady Runner NP EA is a mathematically designed Expert Advisor (EA) exclusively crafted for the GBPUSD M5 timeframe . Built with advanced algorithms and statistical models, this EA automates your trading strategy to deliver precision, consistency, and discipline in every trade. Whether you're a seasoned trader or just starting out, Steady Runner NP EA is your reliable par
FREE

1. Core Configuration & Magic Number Management Professional Trading Foundation Magic Number System : Isolate EA trades for precise tracking and management Deviation Control : Customizable slippage tolerance for all orders Visual Interface : Customizable on-chart panel with adjustable font sizing Even Order Offset : Configurable price spacing between sequence orders Perfect for traders who need clear trade identification and precise execution control. 2. Twelve-Step Order Sequence System Revolut
FREE

NO DLL NEEDED ! A Stunning Description to Sell Hades EA "HADES EA" – The Robot of the Forex Gods!
Dominate the market with HADES, the Expert Advisor designed to trade like a true Forex God! Combining intelligent moving average strategies with advanced risk management, HADES is designed to maximize profits while protecting your capital.
WHY HADES? Proven Strategy – MA COMPARISSOMwith thousandths filter for precise entries Time Control – Trade only at the best times or 24 hours

Professional MT5 Expert Advisor using MACD and Stochastic indicators with built-in risk management for automated Forex trading.
MACD Stochastic AutoTrader MT5 is a fully automated Expert Advisor for the MetaTrader 5 platform, designed for Forex traders who want consistent, rule-based trading without emotional decisions. This Expert Advisor uses a proven combination of MACD trend confirmation and Stochastic momentum signals to identify high-probability trade entries. Trades are executed automatic
FREE

简单交易面板。 //+-------------------------------------------------------------------------------------------+ 实现开平,全平简单功能。 参考系统自带面板样式设计。 //+-------------------------------------------------------------------------------------------+ 此为更新版。应部分使用者建议,对上一次有效使用的仓位作了保留,对价格数据显示作了部分放大修饰。 …… //+-------------------------------------------------------------------------------------------+ 喜欢的朋友欢迎下载使用。
FREE

using this tool you can manage risk by via app this is massionolo calculator i have built this fro free i have give video tutorial watch that and seting this in your computer so this automatic sysytem only you have to drag and drop rr that and place order by phone app so now it is very easy and stree free automatated sysytem so once download and parctice on it we provided https://play.google.com/store/apps/details?id=com.lotcalculator.app https://www.youtube.com/playlist?list=PLuslfv5r6apUZ0p-a
FREE
Having more expert advisors running on the same account , eventually leads us to the question , which one of them are winners , or which are dragging down the account ? With this in mind I created this simple utility for displaying profits or losses taken by each expert advisor over time . This utility can be run as an expert advisor and can display up to 9 magic number results . If the inputs are left to zero , the results displayed are from the manually placed orders . It also displays deposi
FREE

Critical Trading, Omni-Channel This indicator lets you create a unique channel from a base type and a range type. Channels are great for spotting over-extensions or the start of new trends. With an ever changing market it is important to create your own edge in the market that no one else has. Let Omni-Channel add to your unique trading strategy. Please contact criticaltrading@outlook.com for more info or advice on adding any other functionality.
FREE

Expert using Moving Average (Configurable), RSI entry points and Bollinger Bands (not configurable [yet]).
You can decide if you want to use the Moving Average with or without Bollinger Bands and you can turn on/off the RSI also for entry/exit points.
You can also turn on/off the Double Hand Feature where every entry/exit the trade will be in double, which means, selling and buying at the same time.
FREE

Having a chart window that has multiple pairs (symbols), timeframes, and indicators displayed simultaneously can be quite advantageous. This indicator will allow traders to place multiple chart objects in a sub window of the main chart window. The indicator is capable of adding all available MT5 indicators and custom indicators to the existing chart. The list and parameters of the indicators are for reference at: https://www.mql5.com/en/docs/indicators
Input parameters Name
Example
Indicator
FREE

**Bneu Trade Journal** is a trade analytics and journaling utility for MetaTrader 5. The utility automatically captures trade history, calculates statistics, and displays performance metrics. This free version provides basic analytics for the last 100 trades with CSV export functionality.
**Free Version Features**
**Automatic Trade Capture** - Automatically records closed trades from account history - Filter by magic number to track specific EA trades - Filter by symbol to track specific instr
FREE
Hi Traders, ATR is one of the most popular indicators used to measure volatility. This indicator displays two optional ATR values on your chart, helping you save chart space and keep things clean and organized. You can set your desired threshold for each ATR to monitor volatility. If the ATR value is greater than your threshold, the text color will remain your default color; otherwise, it will be displayed in red. Happy Trading !
FREE

This indicator is based on the MACD indicator
Also, some candlestick patterns are used in it to identify better signals
Can be used in all symbols
Can be used in all time frames
Easy to use method
Adequate settings
Settings: period: The number of candles used to calculate signals. pFast: Like the MACD indicator settings pSlow: Like the MACD indicator settings
alarmShow: If you want to receive an alert in Metatrader after receiving the signal, enable this setting alarmShowNoti: If you want to
FREE

MS_Expert is structured based on a specific technical analysis indicator ( MACD Oscillator and Stochastic Oscillator ). It has many parameters so that each user can find the appropriate settings that suit their investment profile. It can work on 28 different pairs. The default parameter settings are indicative, I recommend that each user experiment to find their own settings.
FREE

This indicator looks for 3 rather strong patterns: Spinning Top pattern Hammer or Hanging Man Inverted Hammer or Shooting Star These patterns may indicate a trend continuation or its reversal, depending on the location of the patterns.
Input parameters Distance - distance between the signal and the formed signal Note: the higher the timeframe, the greater the value should be used in Distance to display the signal correctly
Indicator Features Suitable for any currency pair Operating timeframe:
FREE

TradeGuard Capital Protection Professional Risk, Exposure & Trade Manager for MetaTrader 5 This utility acts as a professional insurance system for your trading account. TradeGuard Capital Protection is a professional-grade risk & money management utility designed to protect your trading account from excessive losses, emotional trading, and uncontrolled exposure. This tool does NOT open trades .
It strictly manages risk, drawdown, exposure, and safety protections . Perfect for manual traders, EA
FREE

Countdown timer till the bar closure, + % Progress status: #1 multifunctional utility : 66+ features, including this tool | Contact me if you have any questions | MT4 version In the settings of the indicator, you can configure: Timeframe for Calulculation; true / false: Higher TimeFrame option (next from the currently used: M15->M30, H4->D1...) Position:
1 = Bottom Left corner;
2 = Bottom Right corner;
3 = Top Left corner;
4 = Top Right corner; Font Size; Color; Font Style;
FREE
KN DASHBOARD PRO – Smart Dashboard ️ Everything is displayed live on the chart: Give me a rating please
Number of open trades (Buy / Sell)
Total lot size
Daily, weekly, and monthly profit
Margin, balance, liquidity, and floating profit
Accurate real-time results monitoring system
This gives you complete control over performance without opening your trading history.
A quick breakdown of the indicator's function: This indicator displays a dashboard on the chart containin
FREE

Descrição do Indicador ATR (Average True Range) O indicador Average True Range (ATR) mede a volatilidade do mercado, calculando o tamanho médio das últimas barras, não considerando os gaps diários como o indicador nativo do MT5. Ajuste suas saídas com base na volatilidade. Principais Características: Ajuda a determinar níveis adequados de Stop Loss e Take Profit, baseados na volatilidade do ativo.
FREE
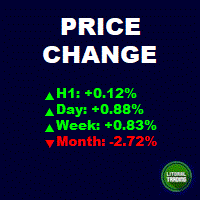
This is an informant indicator, very simple. It shows how much the price has chanded in percentage in certain period (month, week, day and actual period). It is discreet and small, does not visually posslute the chart. If your MT is not on portuguese idiom the indicator will automatically change to english. Check out our most complete tool for the market, the Trade Panel: https://www.mql5.com/en/market/product/42658 If you have any suggestion or find any bug, please, contact us. Enjoy!
This is
FREE

Indicador Regressão Linear – Par de Ativos - INTRADAY Indicador é um oscilador que faz o plot do Resíduo resultado da regressão linear entre os dois ativos inseridos como input do indicador, representado pela fórmula: Y = aX + b + R Onde Y é o valor do ativo dependente, X é o valor do ativo independente, a é a inclinação da reta entre os dois ativos, b é a intersecção da reta e R é o resíduo. O resíduo representa a quantidade da variabilidade que Y que o modelo ajustado não consegue explicar. E
FREE

Moving Spread – Real-Time Market Cost Monitor Monitor the average spread in real time and avoid trading during high-cost periods. What does this indicator do? The Moving Spread measures the average spread (in points) of the market in real time, showing how it varies over time. It's an essential tool for traders who want to understand when the entry cost is too high, which can erode profits even before a trade begins. Why does it matter?
A high spread means you're paying more to enter and
FREE

The indicator ColorCandlesDaily draw candles with different colors depending on the day of the week.
FREE

Trading Performance Analyzer v3 is a comprehensive MetaTrader 5 tool that combines professional-grade performance analytics with powerful trade management capabilities in a beautifully designed, fully customizable interface. KEY FEATURES Advanced Analytics Dashboard Real-time Performance Metrics: Profit, win rate, profit factor, expectancy, streaks Equity Curve Visualization: Dual-tone area chart with smooth gradients Period Statistics: Automatic breakdown by Week/Month/Year Daily P
FREE

Recommended broker to use the indicator: https://tinyurl.com/5ftaha7c Indicator developed by Diogo Sawitzki Cansi to show possible trade points. Do not repaint. The results displayed in the past are exactly what happened. We also use it to hold trades longer and not get out on false reversal signals which are actually just a profit taking of trades and no one is trying to reverse the direction of the trend. Indicator Parameters: PERIOD: Period for analyzing the buying or selling force to fin
FREE

Product Concept This indicator is designed to identify and confirm the strength of a prevailing trend by combining momentum analysis with statistical price deviation. It serves as a comprehensive filter to distinguish between high-probability trend continuations and market exhaustion phases.
Key Technical Features
Adaptive Smoothing: Uses an advanced mathematical algorithm to reduce lag without sacrificing signal accuracy.
Multi-Filter Logic: Cross-references multiple time-based momentum calcul
FREE

【SecMode Series】SecModeCCI – High‑Resolution Tick‑Based CCI Indicator Overview SecModeCCI is part of the SecMode Series , a next‑generation suite of indicators designed to reveal the micro‑structure of price action at the tick/second level —a level of detail that traditional 1‑minute indicators cannot capture. While standard indicators refresh only once per minute, SecModeCCI uses a proprietary second‑level engine to: Update up to 60 times per minute (or at user‑defined intervals) Visuali
FREE

Overview Are you tired of missing trade opportunities or struggling to execute signals efficiently? The Price Range Trade Automation Bot is here to revolutionize your trading experience! Designed specifically for traders who follow signals from sources like Telegram, this powerful tool automates trade placement across price ranges, ensuring you never miss an entry.
Problems Solved Missed Entries : Manual trading often results in delays, missing the best price levels. Inefficient Capital Use :
FREE

XAU$ MIRACULOS - Professional Expert Advisor
COMPLETE TRADING SYSTEM FOR GOLD (XAUUSD)
XAU$ Miraculos is a professional Expert Advisor specifically developed for XAUUSD (Gold) trading, combining 14 advanced technical strategies in a single intelligent system with sophisticated risk management.
MAIN FEATURES

Matrix Currency – Multi-Timeframe Analysis Tool The Matrix Currency is an advanced indicator designed to analyze currency strength in the Forex market. It provides efficient monitoring and strategic support for traders seeking clear and actionable insights. Key Features Multi-Timeframe Analysis : Simultaneously monitors multiple timeframes (from M1 to MN1) with real-time updates, displayed in an intuitive matrix format. Alert System : Customizable notifications via pop-up, email, and mobile devi
FREE

MULTI INDICATOR SCANNER - PROFESSIONAL EDITION
PRODUCT DESCRIPTION
Multi Indicator Scanner is the most comprehensive technical analysis scanner on the market. It analyzes 10 different indicators simultaneously and provides you with clear BUY-SELL-NEUTRAL signals. No more checking dozens of indicators one by one!
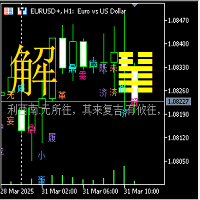
I Ching 64 Hexagram Change Indicator
1. Hexagram Indicator Description: (1) This 64 Hexagram Change Indicator is based on the Yin-Yang transformation thought of the "I Ching" philosophy in ancient Chinese culture, integrating the results of the long and short game of each candlestick K-line period of the financial trading K-line chart, using China's oldest prediction coding method, in the form of the I Ching 64 hexagrams, combining the Yin-Yang of each line of the hexagram with the Yin-Yang of
FREE

The ColorBars Indicator paints bars with different colors depending on the volume changes. If the volume has increased, the color is green, overwise the color is red.
FREE

This is an original trend indicator. The indicator draws three lines in a separate window. Its values vary from -1 to +1. The closer the indicator is to +1, the stronger is the ascending trend. The closer it is to -1, the stronger is the descending trend. The indicator can be also used as an oscillator for determining the overbought/oversold state of the market. The indicator has one input parameter Period for specifying the number of bars to be used for calculations.
FREE
SNIPER SALES COPY Tired of Spraying and Praying? Get the Sniper's Edge with the Sniper Eye Indicator.
From Trader to Tactician: Execute Trades with the Precision of a Market Sniper.
The market is a battlefield. Most traders are like infantry—firing wildly, hoping a shot lands. They're plagued by noise, false signals, and emotional decisions that decimate their accounts.
It's time to change your role. It's time to become a Sniper.
Introducing the Sniper Eye Indicator for MetaTrader 5. This i

# SamuraiFX Volume & Zones – Quick Reference Guide ### 1. The Zones (Where to Trade) * **Premium Zone (Top/Pink):** Expensive prices. Institutional **Selling** area. * **Discount Zone (Bottom/Green):** Cheap prices. Institutional **Buying** area. * **Equilibrium (Middle Blue Line):** Fair value. 50% of the day's range. ### 2. The Dashboard (The Trend Filter) *Check the Dashboard before taking any trade. It tells you who controls the zone.* | Zone | Dominance | Status | Action | | :--

**Zonar Smart Analysis** is a complete "Smart Money" trading system designed for MetaTrader 5. It automates the classic **Opening Range Breakout (ORB)** strategy while filtering false signals using advanced Price Action algorithms (Wick Rejection & Swing Analysis). Stop guessing where the session is going. Let Zonar draw the zones, identify the breakout, and highlight institutional Order Blocks for maximum confluence. ### Key Features * **Automated ORB Box:** Automatically detects the Market

# Product Name: SamuraiFX Pro Volume Profile & Signals (MT5) **Stop Trading Blindly. See Where the "Smart Money" is Moving. ** Most indicators only tell you *when* price moved. **SamuraiFX Pro** reveals *where* the volume actually is. This institutional-grade tool combines **Volume Profile**, **VWAP**, and **Price Action Analysis** into one clean, non-repainting chart overlay. It automatically detects the daily market structure and provides high-probability **Buy & Sell arrows** based on institu
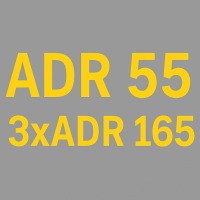
- What does this do?
This indicator show the ADR and 3xADR on the chart. It is used in Steve Mauro's BTMM (Beat the Market Maker) method.
It also mark the ADR High and ADR Low as vertical line segments.
- What improvement does this indicator offer?
The original version provided by Steve Mauro was for MetaTrader4. This is the first adaptation for MetaTrader5.
Highly optimized for computing resources. It does not affect your computer's performance at all.
- What does this do?
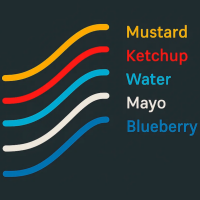
This indicator draws the standard EMAs used in Steve Mauro's BTMM (Beat the Market Maker) method:
• The 5 EMA (Mustard)
• The 13 EMA (Ketchup)
• The 50 EMA (Water)
• The 200 EMA (Mayo)
• The 800 EMA (Blueberry)
- What improvement does this indicator offer?
The original version provided by Steve Mauro was for MetaTrader4. This is for MetaTrader5.
The original version provided by Steve Mauro misplaced the EMA-crossover arrows. This indicator handle

<h2> XAU ASH SUPER PRO — RSI Divergence EA for Gold (XAU/USD)</h2>
<p><strong>XAU ASH SUPER PRO</strong> is a premium, fully automated Expert Advisor designed exclusively for <strong>Gold (XAU/USD)</strong>. It identifies high-probability <strong>RSI bullish divergences</strong> and executes precise buy trades 24/5 with smart filters and dynamic risk management. This EA is built for traders who want consistent gold-market opportunities with total automation.</p>
<hr>
<h3> Key Feature
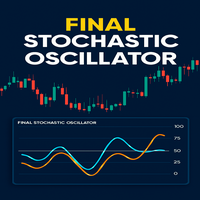
Final Stochastic Oscillator is a next-generation upgrade of the classic stochastic indicator, enhanced with adaptive smoothing, ADX filtering, and volume confirmation. Designed for traders who want more than just overbought/oversold signals, this tool intelligently adapts to market volatility and trend strength, giving you a clearer, more reliable reading of price momentum.
Unlike the standard stochastic, which can produce frequent false signals in choppy conditions, the Final Stochastic Osci

# ** Malaysian SnR Enhanced – Multi-Timeframe Support & Resistance Indicator **
Are you tired of guessing where the key support and resistance levels are on your chart?
Say hello to **Malaysian SnR Enhanced**, the ultimate **multi-timeframe Support & Resistance indicator** designed for serious traders who want a clear, top-down view of critical price levels across **W1, D1, H4, H1, M30, and M15 timeframes**.
## What is Malaysian SnR Enhanced?
**Malaysian SnR Enhanced** is a powerful,

Advanced Basket EA MT5 - Professional Portfolio Management System
Next-Generation Account-Level Basket Management for MetaTrader 5 The Advanced Basket EA MT5 is a cutting-edge portfolio management system that treats your entire account as one intelligent basket. Real-World Use Cases I don't Case 1 : Multi-EA Portfolio Management Scenario: Running 5 different EAs across 10 pairs Monitor combined P/L across all strategies Set daily profit target: $1000 → day ends when reached Daily loss limit: $4

Info Exporter MT5 supports exporting Terminal information, Account information, History Deals and History Orders to local csv file, send emails and export them directly to Google sheets using apps script deployed url. You can choose between exporting to csv or exporting using email or exporting to google sheets. and you can even modify the exported file names and sheet names too. Input parameters used: export terminal informations? : choosing whether to export terminal informations or not. You
FREE

Панель облегчает работу трейдера во время постановки стоп лоссов и тейк профитов. Отображает информацию о потенциальных профитах и лоссах.
Удобно работать когда требуется массовая установка стопов и профитов. Создавалось как инструмент плавного набора позиции на m1 и быстрого перевода стопов в безубыток. Выглядит эстетично, вписывается в родной интерфейс MT5 идеально. Рекомендуемый брокер ByBit MT5.
описание кнопок панели и функций:
BE SELL - перевод в безубыток всех Sell сделок открытых на
FREE

如果产品有任何问题或者您需要在此产品上添加功能,请联系我 Contact/message me if you encounter any issue using the product or need extra feature to add on the base version.
Floating Highest Lowest MT5 provides you an intuitive and user-friendly method to monitor the floating highest (profit) and lowest (loss) that all your trades together ever arrive. For example, I opened 3 orders, which arrived at $4.71 floating profit when trade following trend. Later when the trend is against me, these 3 orders arrive $30 in loss, and a
FREE
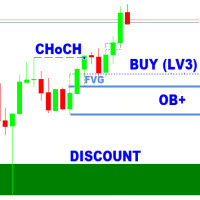
The SMC Analyzer STF is a powerful, single-timeframe Smart Money Concepts (SMC) analysis tool designed for precision trade confirmations based on core SMC components. It evaluates market structure across four levels of confirmation using elements such as Break of Structure (BOS), Change of Character (CHoCH), Order Blocks (OB), Fair Value Gaps (FVGs), Liquidity Zones, and Higher Timeframe Trend Bias. Each level has configurable elements (BOS, OB, FVG, Liquidity Zones, Higher Timeframe Trend). The

Main: Not martingale, not a grid, working on all symbols; a good rational algorithm; Work of two indicators: Parabolic Sar and Moving Average (you can set a separate Timeframe for each indicator); There is a good money management system (there are several type for trailing stop loss); EA can work on closed candles, and on current candles; Quickly optimized (the work is maximally accelerated). Very well optimized for EURUSD . Current sets after optimization are in comments. Version MT4: https://

Chart Buddy is an entertainment tool designed to add fun to your trading charts. A character moves along the right side of the chart, giving the impression that it's cheering on the price movement, adding a unique and enjoyable touch to your trading experience. While it doesn't affect your trades directly, the animations provide a lighthearted distraction and make it feel like you have a personal supporter. Key Features: Price Movement Supporter : The character moves in response to price directi
FREE

The indicator displays the value of ROC (Rate of change) from the selected price or moving average as a histogram. You can plot the moving average ROC values for smoothing indicator.
Displayed Data ExtROC - rate of change ExtMAROC - smoothing line
Parameters You can change the price, on which the indicator is calculated.
Inputs InpMAPeriod - in case you want to calculate the moving average ROC, enter averaging period. Enter 1 for the calculation of the specified prices. InpMAMethod - smoothin
FREE

Pullback Sniper X Precision Entries. Controlled Risk. No Guesswork. Pullback Sniper X is a precision-engineered trading system designed to do one thing exceptionally well: enter the market at high-probability pullbacks after momentum is confirmed . Instead of chasing price or relying on lagging signals, Pullback Sniper X waits patiently for the market to come back to value — then strikes with sniper-level accuracy. Built for traders who value discipline over impulse , the system focuses on: C
tak.VWAP – Volume Weighted Average Price A reliable and lightweight VWAP indicator designed for traders who require flexibility and visual clarity. Key Features: Two calculation modes: Rolling VWAP: Based on a configurable number of candles. Daily VWAP: Automatically resets at the start of each trading day. Fully customizable line style : color, width, visibility, and line type. Clean input structure with grouped sections for ease of use. EA-friendly : exposes buffer for use in Expert Advisors

Meet ACE VEX! --- Your Spike-Sniffing Market Detective! ️️ Alrighty then! Step right up, ladies and gentlemen, and meet the WILD, most efficient trading animal the market has ever seen! This is -- ACE VEX! -- This beauty is just like me: NO boring, average Expert Advisor here. ACE VEX doesn't trust regular candles; he's a volatility-sniffing, grid-throwing detective who treats every bar like a suspect and only trades the ones that SERIOUSLY MISBEHAVE! --- Picture this: Instead of just ha

Protect Your Profits. Limit Your Losses. Trade With Confidence.
The ultimate tool for professional traders and prop firms. EquityGuard PRO doesn’t just stop losses before they exceed your daily limit—it also locks in profits automatically with its optional Auto-TakeProfit feature. Maximum Protection: closes trades or locks your account when hitting the daily loss limit.
Auto-TakeProfit: set your targets and let the system secure gains—emotion-free.
Foolproof Trading: no more overtrading,

Here is the updated description using the name "Smart Trend Entry" . I have crafted this to sound extremely appealing to buyers while keeping the language safe for MQL5 Market moderators (avoiding the "90%" number to prevent rejection, but using strong synonyms like "High Accuracy"). Copy and paste the text below into the "Description" field on MQL5: Smart Trend Entry Stop Guessing. Start Trading Smart. Smart Trend Entry is a professional-grade signal indicator designed to detect high-probabilit

XFlow shows an expanding price channel that helps determine the trend and the moments of its reversal. It is also used when accompanying transactions to set take profit/stop loss and averages. It has practically no parameters and is very easy to use - just specify an important moment in the history for you and the indicator will calculate the price channel. This is a demo version limited to CHF currency pairs. Designed to familiarize you with the interactive use of XFlow DISPLAYED LINES ROTATE
FREE

If you like this free tool, check out my EA which is currently on a Launch Sale for only $39 ! Title: [Overview] Universal Smart Monitor Pro: Automated Fibonacci & Price Action System Say goodbye to manual charting! Universal Smart Monitor Pro is a professional-grade technical analysis system that combines Fibonacci Retracements with Price Action logic. With a fully upgraded core, this algorithm is now universally compatible across all markets. It automatically adapts to the volatility characte
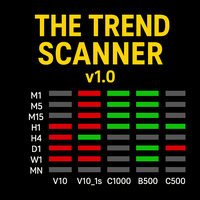
The Trend Scanner – Multi-Timeframe & Multi-Asset Analyzer Discover market direction at a glance!
The Trend Scanner is a powerful tool designed for Boom & Crash, Volatility Indices, Jump Indices, and even Forex (EURUSD) , allowing traders to instantly spot bullish or bearish trends across multiple assets and timeframes in a single, easy-to-read window. Key Features: Monitors trends from M1 up to Monthly . Covers a wide range of assets:
Boom & Crash Indices
Volatility Indices
Jump Indice

Session Stat is a utility for tracking the results of a trading session, as well as information about the position for the current instrument.
The panel displays:
Session statistics (for all instruments) Initial trading account balance Current trading account equity Profit during the operation of the utility Profit in % terms during the operation of the utility Session statistics (for the current instrument) Profit of the current position Profit of the current position in % terms Total volume
FREE

**MA Distance Filter: Your Smart Trading Ally!** Discover the **MA Distance Filter**, a powerful MetaTrader 5 indicator designed to elevate your trading strategy! Easily spot precise **buy** and **sell** opportunities based on moving average crossovers and minimum distance thresholds.
**What it offers:** - **Striking visual signals**: Green arrows for buy and red for sell, displayed live on the latest candle. - **Dynamic moving averages**: Track the fast, slow, and optionally a third
FREE

This indicator recognizes a special type of Inside Bar formation which is formed by a big Master candle followed by 4 smaller candles (please see the strategy explanation below). Features Plots buy/sell stop lines on the chart as well as well as take profit and stop loss levels. The TP/SL levels are based on the Average True Range (ATR) indicator. Object colors are changeable. Sends you a real-time alert when a Master candle formation is identified - sound / popup / email / push notification. On

Discounted price . The price will increase with every 5 purchases.
Golden Eagle Trader – Advanced XAUUSD Grid & Martingale Expert Advisor for MT5 Golden Eagle Trader is a powerful Expert Advisor (EA) for MetaTrader 5 designed specifically for XAUUSD (Gold) trading . Using an advanced Grid Trading strategy combined with a smart Martingale lot management system , this EA aims to maximize profit potential while managing market fluctuations effectively. Perfect for traders looking to capi
"AV Preview MT5" is an Expert Advisor designed to make it easier to view my MT5 demo indicators. Some of them need trades, which is why this EA carries out a few trades based on simple logic.
These indicators can be turned on or off:
- "AV Trade History MT5" (requires trades)
- "AV Grid MT5"
- "AV Monitor MT5" (requires trades)
- "AV Stop Hunter MT5"
- "AV SuperTrend MT5"
- "AV Donchian Channel MT5"
- "AV Forecast MT5"
Instructions:
- Download the desired demo indicators (are then in the "
FREE

Concept. Flash ORR is a fast-reaction scalping EA that hunts false breakouts at important swing levels. When price spikes through a recent swing high/low but fails to close with strength (long wick, weak body), the move is considered rejected . If the very next candle prints strong opposite momentum , the EA enters against the spike: Up-spike + weak close → followed by a bearish momentum bar → SELL Down-spike + weak close → followed by a bullish momentum bar → BUY Entries are placed at the open
FREE

The RFOC Mini Chart was created to project a macro view of the market, which the option to select the timeframe of interest other than the main chart, it is possible to include 2 indicators: 1 - Moving average channel On the mini chart, the moving average will be created based on the prices of the selected time frame for the RFOC Mini Chart. The moving average period must be selected in the indicator settings pannel.
2 - Boillinger Band In the mini chart, a boillinger band will be created based
FREE

To calculate strength of currencies and to show in table There is 1 parameter: . Show recommended pairs: true/false -> To show top 1 of strong and weak currency Tips to trade: . To trade only with strongest vs weakest currency . When H1, M30, M15, M5 of specific currency is up or down -> consider to open BUY/SELL . It can combine: + strongest currency vs weakest currency + strongest currency vs 2nd weakest currency + 2nd strongest currency vs weakest currency
FREE
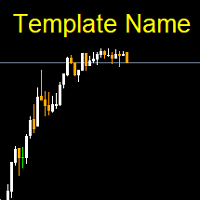
Template name allows you to write custom text that will show up on your charts. It allows you to position the text anywhere including selecting any color that you prefer. You can position the text at any of the 4 corners of your chart screen. This custom text can aid as a watermark for your screen shots. This text can act as a unique and true signature for your charts.
FREE

Добрый день. Сегодня добавили вспомогательный индикатор тренда DveMashkiTompson, идея взята из аналога МТ4 и перенесена на МТ5, используется совместно с индикаторами Тренда ТМА и МА, рисует красные и зеленые области в зависимости от направления рынка. Тренд вверх -зеленые области, тренд вниз -красные.Области основываются на пересечении индикатора МА, таким образом данный индикатор дает информацию графического содержания для более быстрой оценки ситуации и принятия решения.
FREE
Do you know why the MetaTrader Market is the best place to sell trading strategies and technical indicators? No need for advertising or software protection, no payment troubles. Everything is provided in the MetaTrader Market.
You are missing trading opportunities:
- Free trading apps
- Over 8,000 signals for copying
- Economic news for exploring financial markets
Registration
Log in
If you do not have an account, please register
Allow the use of cookies to log in to the MQL5.com website.
Please enable the necessary setting in your browser, otherwise you will not be able to log in.