You are missing trading opportunities:
- Free trading apps
- Over 8,000 signals for copying
- Economic news for exploring financial markets
Registration
Log in
You agree to website policy and terms of use
If you do not have an account, please register
Nikkei 225 - daily correction within the primary bullish trend (based on the article)
Daily price was bounced from 23,426 resistance level to below for the secondary correction within the priumary bullish trend to be started. If the price breaks 21,281 support level to below on close daily bar so the bearish reversal will be started on the secondary ranging way, otherwise - bullish ranging within the levels.
==========
The chart was made on D1 timeframe with standard indicators of Metatrader 4 except the following indicators (free to download):
USD/CAD Intra-Day Fundamentals: Canada Manufacturing Shipments and range price movement
2017-11-16 13:30 GMT | [CAD - Manufacturing Sales]
if actual > forecast (or previous one) = good for currency (for CAD in our case)
[CAD - Manufacturing Sales] = Change in the total value of sales made by manufacturers.
==========
From official report :
==========
USD/CAD M5: range price movement by Canada Manufacturing Shipments news event
==========
The charts were made on MT5 with MA Channel Stochastic system uploaded on this post, and using standard indicators from Metatrader 5.
Crude Oil - daily bullish ranging; 64.63 for the bullish trend to be continuing; 61.19 for the correction to be started (based on the article)
Daily price is located above 55 SMA/200 SMA in the strong bullish area of the chart. The price was bounced from resistance level at 64.63 to below for the secondary correction to be started if the support level at 61.19 is going to be broken by blow on the close daily bar.
==========
The chart was made on D1 timeframe with standard indicators of Metatrader 5 except the following indicators (free to download):
USD/CAD Intra-Day Fundamentals: Canada Consumer Price Index and range price movement
2017-11-17 13:30 GMT | [CAD - CPI]
if actual > forecast (or previous one) = good for currency (for CAD in our case)
[CAD - CPI] = Change in the price of goods and services purchased by consumers.
==========
From official report :
==========
USD/CAD M5: range price movement by Canada Consumer Price Index news event
==========
Chart was made on MT5 with Brainwashing system/AscTrend system (MT5) from this thread (free to download) together with following indicators:
Same system for MT4:
EUR/USD Next year Outlook - EUR/USD at 1.17/1.19 in Q1 of 2018 and at 1.22 in Q2, and Q3 of 2018 (adapted from the article)
Monthly price is on breakout within the primary bearish market condition: price was bounced from 1.0494 support level to above for the good secondary rally with the "reversal" Senkou Span line to be testing to above for the long-term bullish reversal.
If the price breaks 1.2092 resistance on close monthly bar so we may see the reversal of the price movement to the primary bullish market condition; otherwise - the price will be ranging within the levels near Senkou Span line waiting for the direction of the trend to be started.
Most likely scenario for 2018: breaking 1.20 resistance to above for the global long-term bullish reversal.
==========
The chart was made on D1 timeframe with Ichimoku market condition setup (MT5) from this post (free to download for indicators and template) as well as the following indicator from CodeBase:
EUR/USD - 1.1860 as a next target for the primary daily bullish reversal (based on the article)
Daily price is on secondary rally within the primary bearish trend: price is located near and below Ichimoku cloud for Senkou Span line to be tested to above for the resistance level at 1.1860 as a next target for the primary daily bullish reversal.
==========
The chart was made on D1 timeframe with standard indicators of Metatrader 5 except the following indicators (free to download):
The US dollar had a mixed week amid all-important inflation numbers. The upcoming week features US durable goods orders, housing data, speeches from Yellen and Draghi, and the FOMC minutes as we head into Thanksgiving. Here are the highlights for the upcoming week.

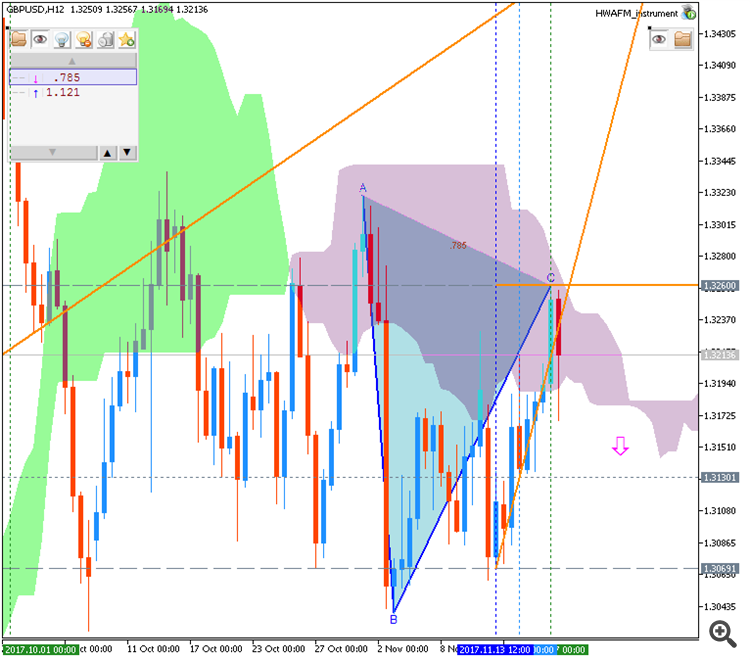
Weekly GBP/USD Outlook: 2017, November 19 - November 26 (based on the article)
GBP/USD was under pressure as Brexit negotiations remain stuck and worries about the economy persist. The upcoming week features the GDP report and also the government’s Autumn Statement.

NZD/USD - daily strong bearish; 0.6780 is the key (based on the article)
Daily price is far below Ichimoku cloud in the bearish area of the chart: price is on testing the support level at 0.6780 together with descending triangle pattern to below for the primary bearish trend to be continuing.
============
Chart was made on MT5 with BrainTrading system from this post (free to download) as well as the following indicators from CodeBase:
All about BrainTrading system for MT5:
About BrainTrending system in general:
Apple - daily ranging bullish with possible correction (based on the article)
Daily share price is located far above Ichimoku cloud in the bullish area of the chart. The price is on bullish ranging within the followiung support/resistance levels:
Descending triangle pattern was formed by the price to be crossed to below for the correction to be started in the near future.
==========
Chart was made on MT5 with PriceChannel Parabolic system (MT5) from this post (free to download) as well as the following indicators from CodeBase: