Press review - page 578


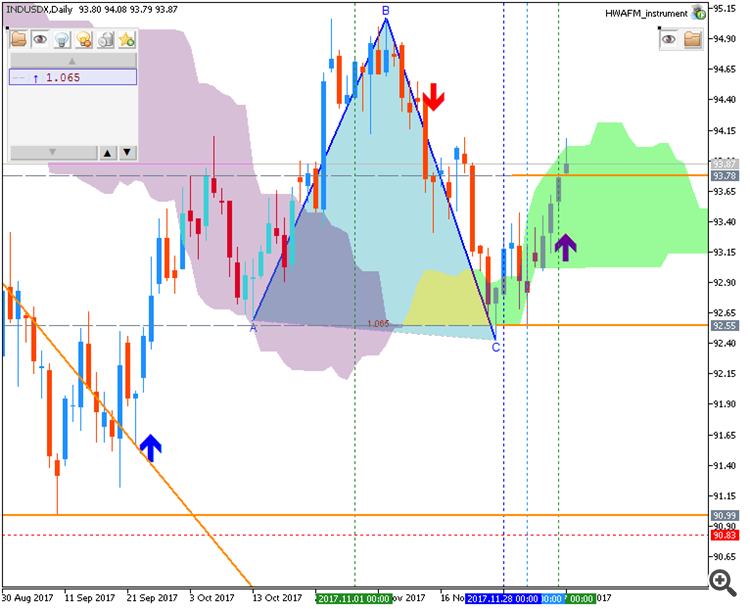
USD/CAD - daily bullish ranging near possible bearish reversal (based on the article)

Daily price is on ranging above Ichimoku cloud in the bullish area of the chart within the following support/resistance levels:

1.2909 resistance level for the bullish trend to be resumed, and
1.2680 support level for the bearish reversal to be started.


  • "The Canadian Dollar rate has fallen across the board after a cautious Bank of Canada aligned with multiple factors that could put further pressure on the CAD. Despite sharp gains last Friday in CAD due to impressive employment gains, the Canadian Dollar rate fell below 1.28 to the USD."
  • "Key drivers of Canadian Dollar weakness in global markets a day after the Bank of Canada left rates unchanged were commodities selling off led by metals like Gold and Copper and the spread between US Treasury 2 year yields and CA 2 year yields widened showing the market believes tightening in the coming years will favor the Federal Reserve. While small on absolute terms, the U.S.-Canada 2-year sovereign rate spread widened to32bps vs. 26bpsbefore Wednesday’s BOC rate decision showing a market forces favor USD for now."
  • "Retail trader data shows 45.1% of traders are net-long with the ratio of traders short to long at 1.22 to 1. We typically take a contrarian view to crowd sentiment, and the fact traders are net-short suggests USDCAD prices may continue to rise."

============

The chart was made on D1 timeframe with Ichimoku market condition setup (MT5) from this post (free to download for indicators and template) as well as the following indicators from CodeBase:


Trading News Events: U.S. Non-Farm Payrolls (based on article)

The U.S. Non-Farm Payrolls (NFP) report by fuel the near-term decline in EUR/USD as employment is projected to increase another 195K in November, while Average Hourly Earnings are expected to climb an annualized 2.7% during the same period.

What’s Expected:


Why Is This Event Important:

A further improvement in labor market dynamics accompanied by signs of stronger wage growth may heighten the appeal of the greenback as it encourages the Federal Open Market Committee (FOMC) to further normalize monetary policy in 2018, and the dollar may exhibit a more bullish behavior over the remainder of the year should the central bank stay on its current course of delivering three rate-hikes per year.

However, another series of lackluster data prints may encourage the FOMC to adopt a more cautious tone at its last interest rate decision on December 13, and the greenback may face a more bearish fate if the fresh developments drag on interest-rate expectations.

How To Trade This Event Risk

  • EUR/USD stands at risk for a larger pullback as it snaps the monthly opening range, with the pair carving a fresh series of lower highs & lows following the failed attempt to break above the 1.1960 (38.2% retracement) hurdle.
  • The Relative Strength Index (RSI) highlights a similar dynamic as it fails to preserve the bullish formation carried over from November, with a break below the 50-Day SMA (1.1758) raising the risk for a move back towards 1.1670 (50% retracement).
  • Next downside region of interest comes in around 1.1580 (100% expansion), which sits above the November-low (1.1554), followed by the Fibonacci overlap around 1.1480 (78.6% expansion) to 1.1500 (78.6% expansion).
Potential Price Targets For The Release
EURUSD Daily


============

The chart was made on D1 timeframe with Ichimoku market condition setup (MT5) from this post (free to download for indicators and template) as well as the following indicators from CodeBase:

============


Weekly Outlook: 2017, December 10 - December 17 (based on the article)

The US dollar continued enjoying the optimism from the tax cuts and was not hit hard by the data. Can it continue higher? Four rate decisions await us: the SNB, ECB, BOE, and the FED, with Yellen’s last post-rate decision press conference. Can the dollar continue higher? Here are the highlights for the upcoming week.


  1. UK inflation: Tuesday, 9:30. Expectations still remain high at 3%.
  2. US PPI: Tuesday, 13:30. Another rise of 0.4% in headline PPI is predicted. Core PPI carries expectations for 0.2%.
  3. US Inflation: Wednesday, 13:30. A rise of 0.4% is projected for headline CPI and +0.2% for core CPI.
  4. US rate decision: Wednesday, 19:00, press conference at 19:30. The Fed is expected to raise rates for the fifth time in the cycle and third time this year. The hike from to a range of 1.25% to 1.50% has been well-telegraphed for a long time. This time, the Fed also releases forecasts for inflation, employment, growth, and interest rates. At the moment, the central bank foresees three additional hikes in 2018. Will they stick to their guns? Markets are skeptical, but they will probably signal continuity before Powell makes his own mark. However, this is an open question as inflation remains low. Outgoing Fed Chair Janet Yellen initially shrugged off lower price rises as “transitory“, then called it “a mystery” and eventually admitted that it might not necessarily be that transitory. What are her views this time? Apart from the forecasts, the tone of the statement and her press conference, her last post-rate decision statement, will be telling. We can expect incoming Chair Jerome Powell to vote with the majority as always and we can expect Neel Kashkari of the Minnesota Fed to dissent, as he previously did earlier in the year. The Fed will try not to rock the boat too much, but markets may cling to any small semantic change in the statement, a shift in the projections, or Yellen’s tone to try and look into 2018.
  5. Australian jobs report: Thursday, 00:30. A gain of 19.2K is on the cards and the unemployment rate carries expectations for remaining at 5.4%.
  6. Swiss rate decision: Thursday, 8:30.  change in policy is unlikely, and will likely lead to a stronger franc. Many traders are still reeling from the January 2015 SNBomb.
  7. UK rate decision: Thursday, 12:00. A unanimous “no-change” vote is more likely among the 9-member Monetary Policy Committee ahead of the holidays.
  8. Euro-zone rate decision: Thursday, 12:45, press conference at 13:30. As usual, Draghi will continue his balancing act. If he talks about ending QE after September, the euro will jump, but this is unlikely. The ECB can wait until around June to make such future announcements.
  9. US retail sales: Thursday, 13:30. A gain of 0.3% is forecast in headline retail sales and +0.7% in core sales.
 

Weekly EUR/USD Outlook: 2017, December 10 - December 17 (based on the article)

EUR/USD failed to hold onto higher ground in a mixed week. The ECB meeting is clearly the big event of the upcoming week, but not the only topics on the agenda. Here is an outlook for the highlights of this week.


  1. German ZEW Economic Sentiment: Tuesday, 10:00. A score of 17.9 points is on the cards now. The all euro-zone figures stood at 30.9 points and 30.2 is forecast now.
  2. Mario Draghi talks:  Tuesday, 19:00. The president of the European Central Bank will speak at an event in Frankfurt less than 48 hours ahead of ECB meeting. He could drop a hint about the tone, but in such proximity to the event, it is more likely that Draghi will be more cautious.
  3. German CPI (final): Wednesday, 7:00. The German figure will likely be confirmed now.
  4. German WPI:  Wednesday, 7:00. Back in October, prices remained flat.
  5. Employment Change: Wednesday, 10:00. Another gain of 0.4% is forecast now.
  6. Industrial Production: Wednesday, 10:00. A drop of 0.2% is projected.
  7. French CPI (final): Thursday, 7:45. This number will probably confirmed now. It all feeds into the all euro-zone number.
  8. Flash PMIs: Thursday morning: 8:00 for France, 8:30 for Germany and 9:00 for the whole euro-zone.
  9. Rate decision: Thursday, 12:45, press conference at 13:30. The big news was out already at the October meeting. The ECB will halve the volume of its bond-buys in January to 30 billion euros per month and the program will run through September 2018. Draghi left the door open to what happens afterward, andthat was a dovish sign that sent the euro down. Since then, weak inflation reads, especially with core CPI slipping to 0.9%, vindicated his dovishness. This time, no changes are expected, but the ECB will publish new staff forecasts for inflation and growth. A downgrade of inflation forecasts could serve to weaken the euro and Draghi could join in. However, it is hard to ignore the robust growth, especially in Germany(0.8% q/q). As usual, Draghi will continue his balancing act. If he talks about ending QE after September, the euro will jump, but this is unlikely. The ECB can wait until around June to make such future announcements.
  10. Trade Balance: Friday, 10:00. The figure for October will likely be similar: 24.6 billion.
 

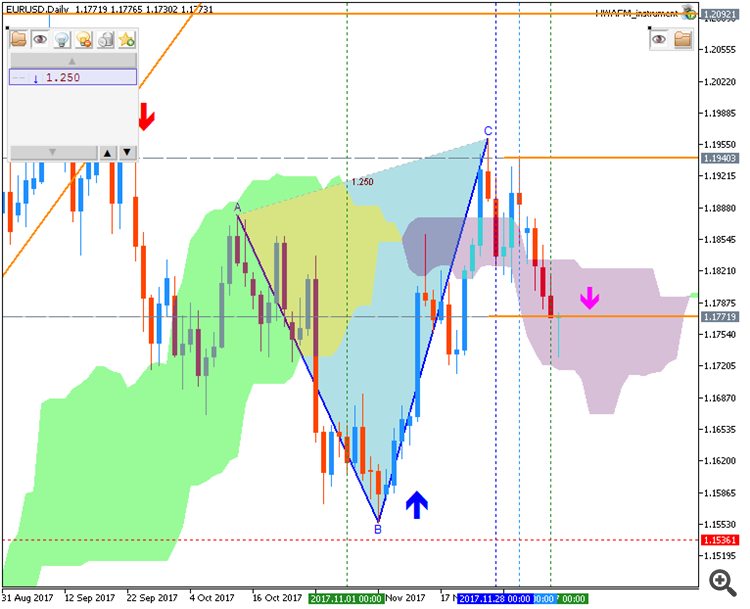
EUR/USD - daily ranging inside Ichimoku cloud for direction (based on the article)

Daily price is located inside Ichimoku cloud for the ranging within the following s/r levels:

1.1865 resistance for the bullish trend to be resumed with 1.1961 level as a daily bullish target, and
1.1709 support level located in the beginning of the bearish rreversal to be started with 1.1650/1.1554 daily bearish targets


  • "Euro selling pressure struggled to sustain momentum after a 6-day losing streak brought the currency to the lowest level in three weeks against the US Dollar. Still, a break of rising trend support set from early November seems to suggest the near-term bias continues to favor weakness."
  • "A break below the 38.2% Fibonacci expansion at 1.1756 confirmed on a daily closing basis sees the next downside barrier at 1.1692, the 50% level. Alternatively, a bounce back above the 23.6% Fib at 1.1834 opens the door for a challenge of trend line support-turned-resistance, now at 1.1934. The short EUR/USD position triggered at 1.1824 hit its initial profit target and partial profit has been booked. Remaining exposure continues to be in play to capture any follow-on weakness. The stop-loss has been trailed down to the breakeven even level."

============

The chart was made on D1 timeframe with Ichimoku market condition setup (MT5) from this post (free to download for indicators and template) as well as the following indicators from CodeBase:


EUR into ECB with Credit Agricole: "We remain long EUR/USD" (based on the article)

==========

2017-12-14 12:45 GMT | [EUR - Minimum Bid Rate]

  • past data is 0.00%
  • forecast data is 0.00%
  • actual data is n/a according to the latest press release

if actual > forecast (or previous one) = good for currency (for EUR in our case)

[EUR - Minimum Bid Rate] = Interest rate on the main refinancing operations that provide the bulk of liquidity to the banking system. 

==========

Weekly price is on bullish breakout: the price broke Ichimoku cloud to above to be reversed to the primary bullish market condition. For now, the price is on ranging within 1.1554/1.1961 support/resistance level for for secondary correction to be started or for the bullish trend to be resumed.


  • "Any ECB message that highlights QE as positive without adding to its dovish forward guidance could boost Eurozone stocks and EUR. We remain long EUR/USD and EUR/CHF."

==========

Chart was made on MT5 with Brainwashing system/AscTrend system (MT5) from this thread (free to download) together with following indicators:

Same system for MT4:

  1. Brainwashing. Trades: manually and using EAs (MT4)
  2. Brainwashing EAs - the thread (MT4)
  3. Brainwashing: system setup for trading manually and for EAs (MT4) - the thread 
  4. Brainwashing: system development (MT4) - the thread
 

GBP into BoE with Credit Agricole: "hopes for earlier rate hikes" (based on the article)

==========

2017-12-14 12:00 GMT | [GBP - Official Bank Rate]

  • past data is 0.50%
  • forecast data is 0.50%
  • actual data is n/a according to the latest press release

if actual > forecast (or previous one) = good for currency (for GBP in our case)

[GBP - Official Bank Rate] = Interest rate at which the BOE lends to financial institutions overnight. 

==========

Daily price  is on bullish ranging above ichimoku cloud within the following support/resistance levels:

1.3321 support level for the bearish reversal to be started with 1.3198 target to re-enter, and
1.3520 resistance level for the bullish trend to be resumed with 1.3549 bullish target to re-enter.

Most likely scenario for this week: ranging within the levels wanting for the direction of the trend to be started.


  • "Some positives are already in the price of GBP, therefore currency gains may slow down from here."

==========

Chart was made on MT5 with Brainwashing system/AscTrend system (MT5) from this thread (free to download) together with following indicators:

==========

Same systems for MT4/MT5:

The beginning

  1. ASCTrend system, the beginning, part #1
  2. ASCTrend system, the beginning, part #2
  3. ASCTrend system, the beginning, part #3
  4. ASCTrend system, the beginning, part #4 
  5. Digital ASCTrend (Digital Filters with ASCTrend system combined).
  6. LabTrend (LabTrend indicators, LabTrendZigZag, templates, Labtrend EAs) - the thread

After 

  1. The main AscTrend thread is this one.
  2. Asctrend indicator in depth 
  3. ASCTREND SYSTEM summary (good EAs included) 
  4. Brainwashing system/AscTrend system (MT5) - the thread  


EUR/USD - ranging within 55 SMA/200 SMA; 1.1961 is the key (based on the article)

Intra-day price on H4 chart is located within 55 SMA/200 SMA ranging area waiting for the direction of the strong trend to be started.

If the price breaks high for the last monthly bar at 1.1961 so the bullish trend will be resumed, otherwise - ranging within the levels.


  • "EURUSD: Retail trader data shows 44.5% of traders are net-long with the ratio of traders short to long at 1.25 to 1. The number of traders net-long is 6.5% higher than yesterday and 15.5% higher from last week, while the number of traders net-short is 5.1% higher than yesterday and 11.8% lower from last week."
  • "We typically take a contrarian view to crowd sentiment, and the fact traders are net-short suggests EURUSD prices may continue to rise. Yet traders are less net-short than yesterday and compared with last week. Recent changes in sentiment warn that the current EURUSD price trend may soon reverse lower despite the fact traders remain net-short."

==========

The chart was made on H4 timeframe with standard indicators of Metatrader 4 except the following indicator (free to download):


NZD/USD - daily ranging bearish to the ranging bullish reversal (based on the article)

Daily price is located near and below Ichimoku cloud for resistance level at 0.6930 to be breaking to above for the bullish reversal to be started.


  • "Critical support remains at 0.6781, November 17 low. A daily close below that targets a channel bottom now at 0.6736, followed by the 38.2% Fibonacci expansion at 0.6697. Alternatively, a move back above the 23.6% Fib retracement at 0.6935 exposes the 0.7030 (38.2% retracement, former trend line support)."
  • "he entry order to sell NZD/USD at 0.6895 established last week has been triggered. The position initially targets 0.6793, with a stop-loss to be activated on a daily close above 0.6946. Profit on half of open exposure will be booked and stop moved to breakeven when (and if) the first objective is met."

==========

Chart was made on MT5 with Brainwashing system/AscTrend system (MT5) from this thread (free to download) together with following indicators:

Same system for MT4:

  1. Brainwashing. Trades: manually and using EAs (MT4)
  2. Brainwashing EAs - the thread (MT4)
  3. Brainwashing: system setup for trading manually and for EAs (MT4) - the thread 
  4. Brainwashing: system development (MT4) - the thread
 

Why Is LTC Price Going Up? (based on the article)

Intra-day price on H1 chart is on bullish breakout: the price broke Ichimoku cloud to above to be very far from Senkou Span lines which are the virtual border between the primary bearish and the primary bullish trend. Price was bounced from 362 resistance level to below for the ranging condition to be started in the near future for example.


  • "Litecoin, an altcoin of the better known cryptocurrency Bitcoin, has soared to the record high of $290.99, a YTD increase of more than 4,000%, as listed on CoinMarketCap. Many are asking why the price of digital currencies has and is rising, whether Litecoin’s recent price increase is because of Bitcoin and if this bubble will burst."
  • "The start of this week saw the launch of Bitcoin futures on CBOE, the Chicago Board Options Exchange, which could be a significant reason why the price of other virtual currencies are rising. As Litecoin is a fork of Bitcoin, and the fork causing Bitcoin’s price to go up earlier this year, if Bitcoin is doing well, we should expect the same of Litecoin and Ethereum. Litecoin has lesser name recognition and it could be a better option for investors, however, as there is not as much controversy surrounding this coin, (perhaps because it is not as well known), offers faster speeds and lower fees."
  • "Another possible reason could be the media coverage of Bitcoin and Charlie Lee’s recent fame with a lot of news outlets asking for the Litecoin founder to discuss the BTC price increase."

============

The chart was made on H1 timeframe with Ichimoku market condition setup (MT5) from this post (free to download for indicators and template) as well as the following indicators from CodeBase:

Reason: