Forecast for Q4'16 - levels for Brent Crude Oil
U.S. Commercial Crude Oil Inventories
news event: intra-day bearish reversal, daily ranging for direction
2016-09-28 14:30 GMT | [USD - Crude Oil Inventories]
- past data is -6.2M
- forecast data is 2.4M
- actual data is -1.9M according to the latest press release
[USD - Crude Oil Inventories] = Change in the number of barrels of crude oil held in inventory by commercial firms during the past week.
==========
"U.S.
commercial crude oil inventories (excluding those in the Strategic
Petroleum Reserve) decreased by 1.9 million barrels from the previous
week."
==========
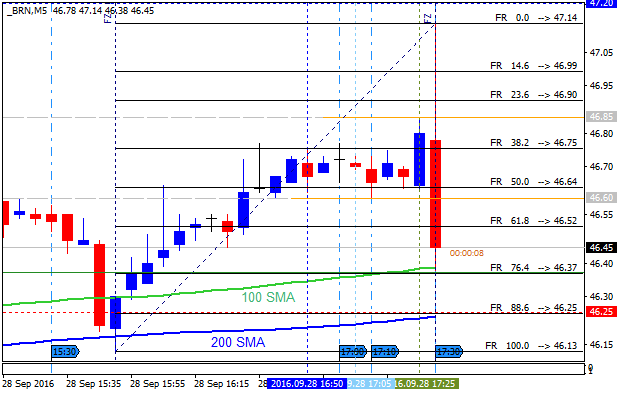
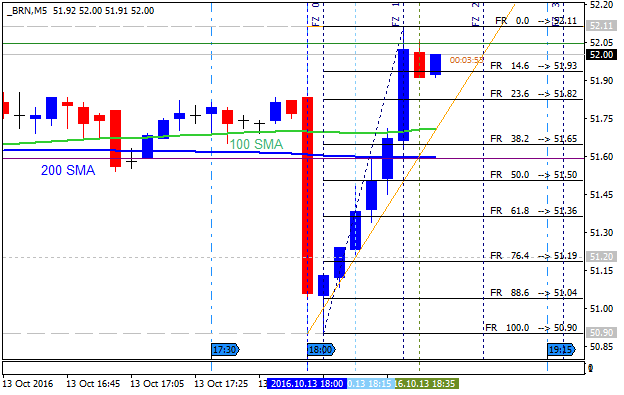
Crude Oil M5: bearish breakdown. The price is on bullish ranging above 100 SMA/200 SMA within the wide support resistance levels waiting for the bullish trend to be continuing or to the bearish reversal to be started.If the price breaks 47.14 resistance level so the bullish trend will be resumed.
If the price breaks 46.25 support so the reversal of the intra-day price movement from the ranging bullish to the primary bearish market condition will be started.
If not so the price will be on ranging within the levels.
==========
Crude Oil Daily: bullish ranging inside 100 SMA/200 SMA waiting for direction. The price is located within 100 SMA/200 SMA and above 200 SMA for the ranging bullish market condition waiting for the prumary bullish trend to be resumed or to the bearish reversal to be started.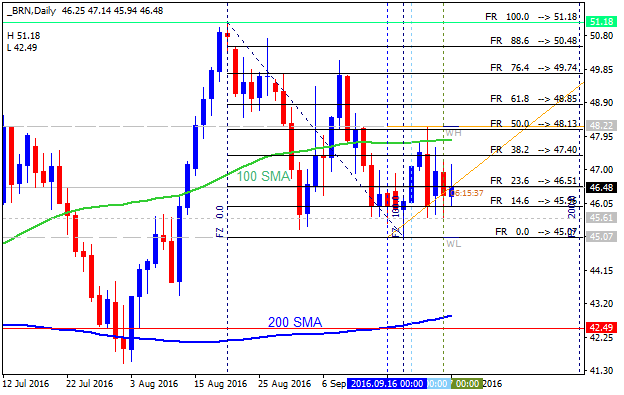
If the price breaks 48.13 resistance on close daily bar so the primary bullish trend will be resumed.
If the price breaks 42.49
support level to below on close daily bar so the reversal of the price movement
from the ranging bullish to the primary bearish market condition will be
started.
If not so the price will be on bullish ranging within the levels.
Forum on trading, automated trading systems and testing trading strategies
Sergey Golubev, 2016.10.02 13:44
Fundamental Q4'16 Forecasts for Brent Crude Oil (based on the article)
Brent Crude Oil - "Crude oil price has reacted cleanly to the
200 day simple moving average for the past year and a half offering 5
touches of price support and resistance. Therefore, a move below the
common trend indicator would be worrisome to the H&S pattern
traders. A break below would open the door to more bearish potential
towards $40 and then possibly $35."
Forum on trading, automated trading systems and testing trading strategies
Sergey Golubev, 2016.10.04 12:40
Crude Oil Price Forecast: Oil Bulls Can Almost Taste 3-Month Highs (based on the article)
Daily price is on bullish masrket condition for 51.10 resistance level to be tested for the bullish trend to be continuing.
- "Oil Bulls continue to be rewarded by an OPEC Accord to curb production as the price of spot WTI trades at the highest levels since July. While the recent rise has been impressive following the post-Brexit announcement move down to $39.17, what is more impressive is the potential longer-term chart set-up for a Bull Run to the upside."
- "There is still cause for concern by some who think a USD Bull Market is
in the making once the Fed decides to raise short-term interest rates or
due to weakness elsewhere. Such a strengthening of the US Dollar could
naturally put pressure on the price of Oil. However, if the USD fails to
mature into an uptrend, we could be setting up for a favorable
environment for further upside in the price of Crude Oil."
- "Another development in institutional positioning is the largest increase
in long positions in WTI since January. This bullish positioning is an
aggressive reversal from the bearish sentiment that had not been seen
since September 2015 in recent CoT readings. The bullish sentiment comes
in the forms of straight long positions via futures as well as options
contracts that increased 8.1%. Such bullish exposure could see the
market favor further."
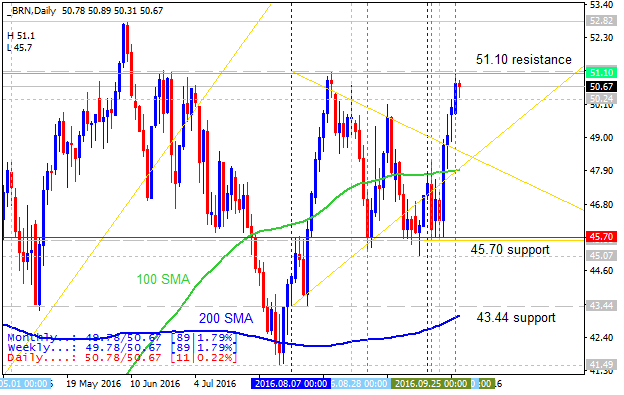
If the price breaks 51.10 resistance level to above on daily close bar so the primary bullish trend will be continuing.
If the price breaks 45.70 support level to below on close bar so the local downtrend as the secondary correction within the primary bullish trend will be started.
If the price breaks 43.44 support level so we may see the reversal of the daily price movement to the primary bearish market condition.
Forum on trading, automated trading systems and testing trading strategies
Sergey Golubev, 2016.10.13 17:53
U.S. Commercial Crude Oil Inventories
news event: intra-day ranging on reversal, daily ranging bullish
2016-09-13 15:00 GMT | [USD - Crude Oil Inventories]
- past data is -3.0M
- forecast data is 0.4M
- actual data is 4.9M according to the latest press release
[USD - Crude Oil Inventories] = Change in the number of barrels of crude oil held in inventory by commercial firms during the past week.
==========
"U.S.
commercial crude oil inventories (excluding those in the Strategic
Petroleum Reserve) increased by 4.9M million barrels from the previous
week."
==========
Crude Oil M5: ranging on reversal. The
price broke 100 SMA/200 SMA reversal levels for the bearish breakdown, and it was was bounced to above to be crossed 100 SMA/200 SMA back to above for the bullish reversal. For now, the price is on ranging near and above 100 SMA/200 SMA within 52.11 bullish continuation resistance level and 50.90 bearish reversal support level.
If the price breaks 50.90 support level to below on close M5 bar so the price will be fully reversed to the bearish market condition.
If not so the price will be on ranging within the levels.
==========
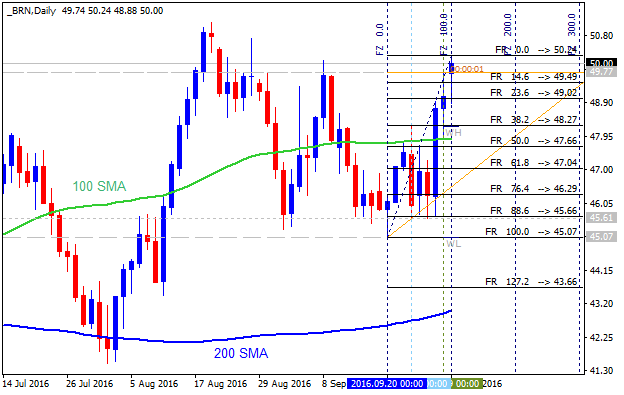
Crude Oil Daily: bullish ranging with 53.71/45.07 key levels. The price is above 100 SMA/200 SMA in the bullish are of the chart: price is testing 53.71 resistance level for the bullish trend to be resumed; alternative, if the price breaks 49.49 support level on daily close bar so the secondary correction within the primary bullish trend will be started.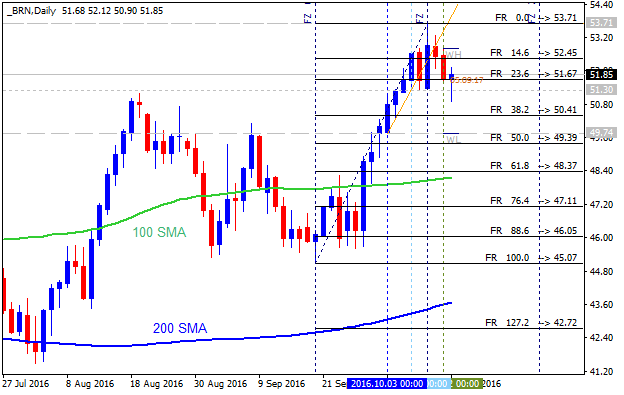
If the price breaks 53.71 resistance on close daily bar so the primary bullish trend will be resumed.
If
the price breaks 49.49
support level on close daily bar so the local downtrend as the
secondary correction within the primary bullish trend will be started.
If the price breaks 42.72
support level on close daily bar so we may see the reversal of the price movement
from the primary bullish to the primary bearish market condition.
If not so the price will be on bullish ranging within the levels.
U.S. Commercial Crude Oil Inventories
news event: intra-day bullish; daily bullish ranging within narrow s/r levels
2016-10-19 14:30 GMT | [USD - Crude Oil Inventories]
- past data is 4.9M
- forecast data is 2.2M
- actual data is -5.2M according to the latest press release
[USD - Crude Oil Inventories] = Change in the number of barrels of crude oil held in inventory by commercial firms during the past week.
==========
"U.S.
commercial crude oil inventories (excluding those in the Strategic
Petroleum Reserve) decreased by 5.2 million barrels from the previous
week."
==========
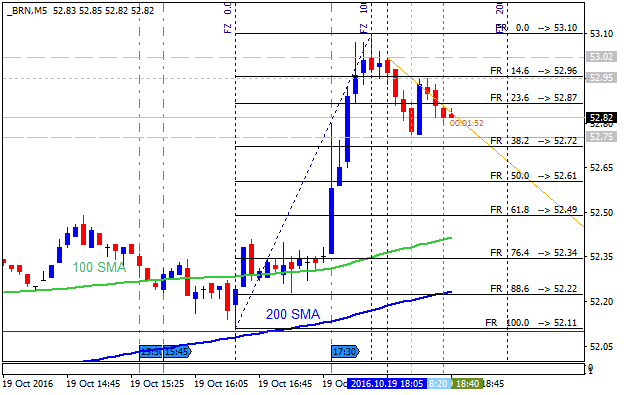
Crude Oil M5: bullish. The price is on bullish market condition to be above 100 SMA/200 SMA for 53.10 resistance level to be etsting for the bullish trend to be continuing.If the price breaks 53.10 resistance level so the bullish trend will be resumed.
If the price breaks 52.22 support so the reversal of the intra-day price movement from the ranging bullish to the primary bearish market condition will be started.
If not so the price will be on ranging within the levels.
==========
Crude Oil Daily: bullish ranging within narrow s/r levels. The price is located above 100 SMA/200 SMA in the bullish area of the chart for the ranging within s/r levels for the bullish trend to be continuing or for the secondary correction to be started.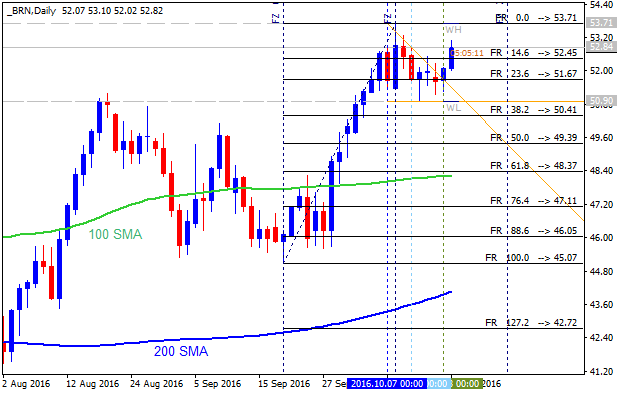
If the price breaks 53.71 resistance on close daily bar so the primary bullish trend will be continuing.
If the price breaks 49.39
support level to below on close daily bar so the local downtrend as the secondary correction within the primary bullish trend will be started.
If not so the price will be on bullish ranging within the levels.
Forum on trading, automated trading systems and testing trading strategies
Sergey Golubev, 2016.10.24 21:43
Brent Crude Oil Intra-Day Technicals: possible ranging correction (adapted from the article)
H4 price is located above 100 SMA/200 SMA reversal levels in the bullish area of the chart:
- The price is on ranging within 53.67 resistance level for the bullish trend continuation and 50.74 support level for the bearish reversal to be started.
- "Crude oil turned into strong bullish mode in September which looks like an impulsive price move on the 4h chart. We see an extended and sharp leg from 44.14 to 51.50 that looks like wave 3 of an impulsive structure. If that’s true then we know that market is in new bullish phase so uptrend should continue after the wave 4 pullback which can be now in final stages of an Elliott Wave flat correction that can be looking for a base at 49.00-49.50 area."
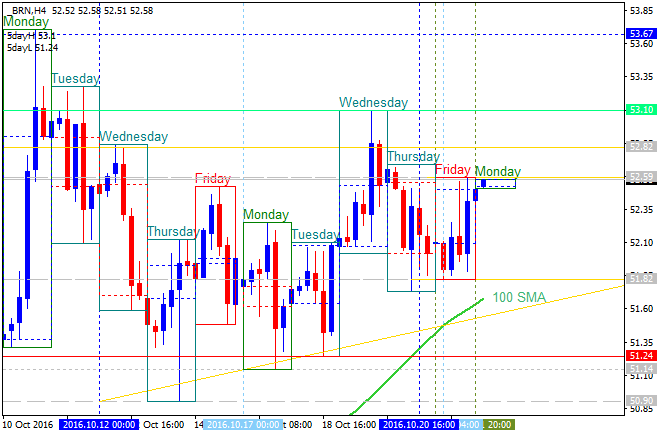
Most likely intra-day scenario for the price movement in the near future: secondary correction within the primary bullish market condition.
U.S. Commercial Crude Oil Inventories
news event: intra-day breakdown; daily ranging to correction
2016-10-26 14:30 GMT | [USD - Crude Oil Inventories]
- past data is -5.2M
- forecast data is 0.7M
- actual data is -0.6M according to the latest press release
[USD - Crude Oil Inventories] = Change in the number of barrels of crude oil held in inventory by commercial firms during the past week.
==========
"U.S.
commercial crude oil inventories (excluding those in the Strategic
Petroleum Reserve) decreased by 0.6 million barrels from the previous
week."
==========
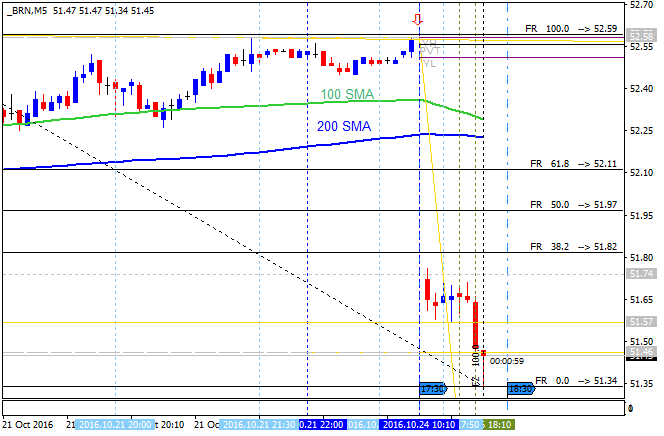
Crude Oil M5: bearish breakdown. The price broke 100 SMA/200 SMA to below for the bearish reversal with 51.34 support level to be tested for the bearish trend to be continuing.If the price breaks 52.59 resistance level so the bullish reversal will be started.
If the price breaks 51.34 support to below so the primary bearish trend will be continuing.
If not so the price will be on ranging within the levels.
==========
Crude Oil Daily: bullish ranging to correction. The price is located above 100 SMA/200 SMA in the bullish area of the chart for the ranging within support/resistance levels: price is testing 51.24 support level to below for the secondary correction to be started at 50.41 support level.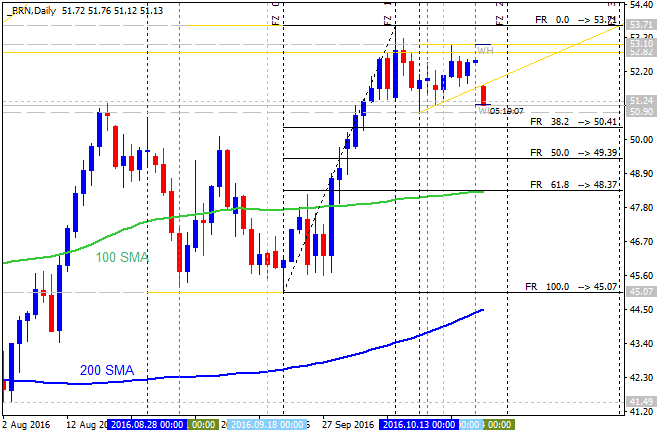
If the price breaks 50.41
support level to below on close daily bar so the local downtrend as the
secondary correction within the primary bullish trend will be started.
If the price breaks 45.07
support level to below on close daily bar so the bearish reversal will be started.
If the price breaks 53.71 resistance on close daily bar so the primary bullish trend will be resumed.
If not so the price will be on bullish ranging within the levels.
Forum on trading, automated trading systems and testing trading strategies
Sergey Golubev, 2016.11.02 08:30
Brent Crude Oil Intra-Day Technicals: breakdown or Rally? (adapted from the article)
H4 price is located below 100 SMA/200 SMA reversal levels in the bearish area of the chart. The price is on breaking 47.83 support level to below for the bearish breakdown to be continuing.
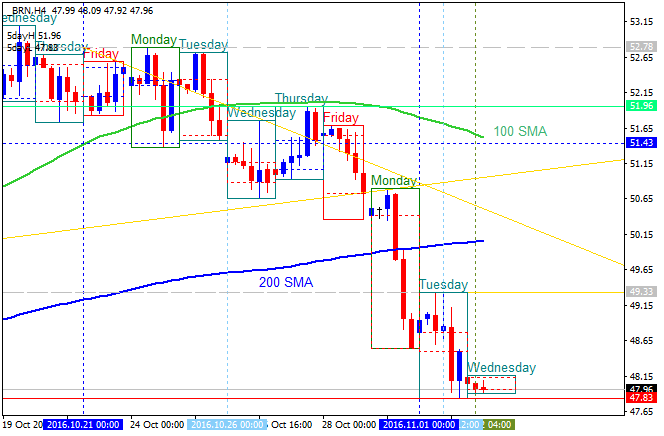
"Crude Oil prices have declined to test a daily value of support near today’s low of $46.26. This price decline has been predicated on some OPEC members hinting that they may be unwilling to cut production going into a meeting in Vienna later this month. This news has left many Oil traders sidelined, as prices may be prepared to bounce higher or breakout lower at current levels."
Alternative,
- if the price is bounced from this level so the ranging bearish condition will be started, and
- if the price breaks 49.33 resistance level to above so local uptrend as the secondary rally within the primary bearish market condition will be started.
U.S. Commercial Crude Oil Inventories
news event: intra-day bearish breakdown; daily correction
2016-11-02 14:30 GMT | [USD - Crude Oil Inventories]
- past data is -0.6M
- forecast data is 1.6M
- actual data is 14.4M according to the latest press release
[USD - Crude Oil Inventories] = Change in the number of barrels of crude oil held in inventory by commercial firms during the past week.
==========
"U.S.
commercial crude oil inventories (excluding those in the Strategic
Petroleum Reserve) increased by 14.4 million barrels from the previous
week."
==========
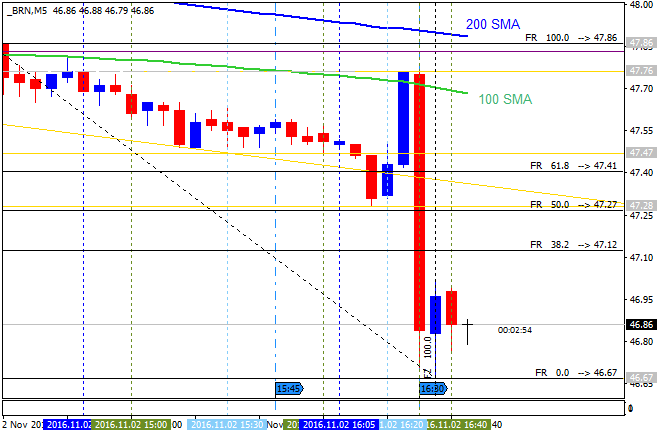
Crude Oil M5: bearish breakdown.
The price was bounced from 100 SMA/200 SMA reversal levels to the
primary bearish area of the chart. Price is testing 46.67 support level
to below for the bearish trend to be continuing.
If the price breaks 46.67 support so the primary bearish trend will be continuing.
If not so the price will be on bearish ranging within the levels.
==========
Crude Oil Daily: correction.
The price broke 100 SMA to below for the secondary ranging market
condition. Price is still above 200 SMA for the primary bullish, and if
the price breaks 45.07 support level to below (which is 200-day SMA
value for now) so the reversal from the ranging bullish to the primary
bearish market condition will be started.
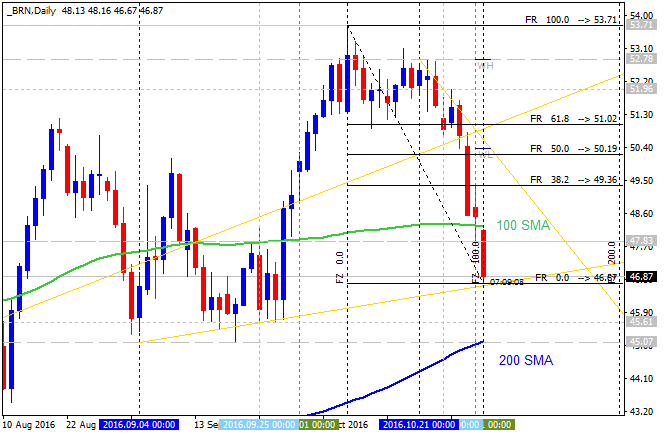
If the price breaks 50.19 resistance on close daily bar to above so the primary bullish trend will be resumed.
If the price breaks 45.07
support level to below on close daily bar so the reversal of the daily
price movement from the ranging bullish to the primary bearish market
condition will be started.
If not so the price will be on ranging within the levels waiting for direction.
Forum on trading, automated trading systems and testing trading strategies
Sergey Golubev, 2016.11.14 09:49
The U.S. Energy Information Administration’s Forecasts: $51 Per Barrel in 2017 (adapted from the article)
Daily price is located within 100-day SMA/200-day SMA ranging area of the chart: the price is on testing 44.76 support level to below for the reversal from the ranging bullish to the primary ebarish market condition. Alternative, if the price breaks 38.2% Fibo level at 48.18 to above on close daily bar so the primary bullish trend will be resumed.

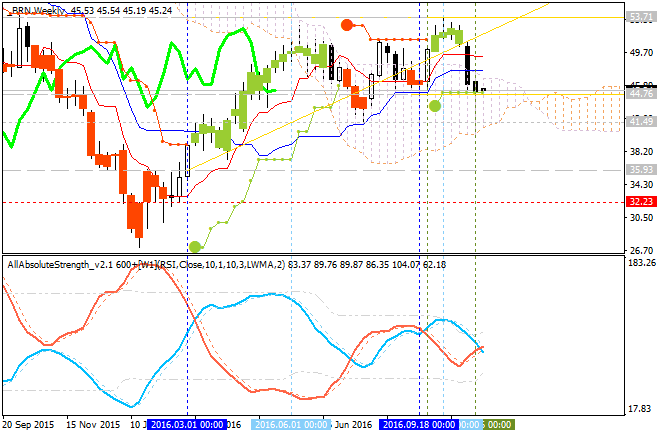
Weekly price is located inside Ichimoku cloud for the ranging condition and above Senkou Span line (which is the virtual border between the primary bearish and the primary bullish trend on the chart) for the bullish trend so we are having ranging bullish market condition on weekly Ichimoku chart. If the price breaks 41.49 support level to below so we may get long-tern nearish reversal, alternarive - if the price breaks 53.71 resistance to above so the primary long-tern bullish trend will be resumed.
"The U.S. Energy Information Administration’s (EIA) Short-Term Energy Outlook (STEO) released on November 8 forecasts that North Sea Brent crude oil prices will average $43 per barrel (b) in 2016 and $51/b in 2017. EIA expects that West Texas Intermediate (WTI) prices will average $43/b in 2016 and $50/b in 2017."
Most likely scenario for the price movement in 2017: the ranging trend within 54/41 levels.- Free trading apps
- Over 8,000 signals for copying
- Economic news for exploring financial markets
You agree to website policy and terms of use
Brent Crude Oil October-December 2016 Forecast: bullish ranging; 52.82 level for the bullish to be continuing; 39.95 support for the bearish reversal to be started
W1 price is on ranging within Ichimoku cloud above Senkou Span line which is the border of the cloud and the virtual border between the primary bullish and the primary bearish trend on the chart. The price is on bullish ranging within 52.82 resistance level for the bullish trend continuation and 39.95/36.91 support levels for the bearish reversal to be started.
Chinkou Span line is located above the price indicating the possible breakdown in the future, Tenkan-sen line is above Kijun-sen line for the ranging bullish condition, and Absolute Strength indicator is estimating the trend to be ranging as well.
Trend:
W1 - bullish ranging