
FluxGate Precision: Fibonacci-Based Trend Detection with ATR-Adaptive TP/SL for MT4 and MT5

1. Introduction
Identifying the exact moment a trend shifts direction is one of the hardest problems in technical analysis. Moving average crossovers lag. Momentum oscillators generate conflicting signals. Trendline breaks depend on subjective drawing. The core difficulty is not the absence of tools -- it is the absence of a framework that combines trend detection with structured risk management in a single system.
The FluxGate Precision Indicator solves this by integrating Fibonacci-based trend detection with ATR-adaptive take-profit and stop-loss management into a single, non-repainting tool. It scans price action within a configurable analysis window, derives three Fibonacci levels from the rolling highest high and lowest low, and generates BUY or SELL signals when price crosses the upper or lower threshold. Each signal automatically produces up to four take-profit targets and a stop-loss level that scale to current volatility using ATR. A progressive break-even system trails the stop as each target is reached. A real-time dashboard displays the current signal, entry price, all TP/SL levels, hit status, and trade outcome at a glance.
The indicator works on any symbol and any timeframe. All signals are non-repainting -- they confirm only on closed bars and never disappear or change after the fact.
The FluxGate Precision Indicator is available on the MQL5 Market for both platforms:
- MetaTrader 5: FluxGate Precision MT5
- MetaTrader 4: FluxGate Precision MT4
A free demo version is available for testing before purchase.
2. What Are Fibonacci Retracement Levels
The Fibonacci sequence -- 0, 1, 1, 2, 3, 5, 8, 13, 21, 34, 55, 89, 144 -- produces key ratios when adjacent numbers are divided. Dividing any number by its successor converges toward 0.618 (the golden ratio). Its complement is 0.382. The square root gives 0.786, and dividing by two places ahead yields 0.236.
These derived ratios -- 23.6%, 38.2%, 50%, 61.8%, and 78.6% -- form the standard Fibonacci retracement levels used in technical analysis. The 50% level is not a true Fibonacci ratio but is included for its historical significance in Dow Theory.
In trading, Fibonacci retracement levels are applied to a completed price swing. After a strong move, price tends to retrace to one of these percentage levels before resuming the original trend. If a stock rallies from 100 to 200, traders watch for support at the 23.6% retracement (176.40), the 38.2% (161.80), the 50% (150.00), the 61.8% (138.20), and the 78.6% (121.40).
Why do these levels work? The most practical explanation is self-fulfilling behavior. Large numbers of participants -- including institutional algorithms -- use Fibonacci levels for entries, exits, and stop placement, creating actual demand or supply at those zones. Beyond self-fulfilling prophecy, crowd psychology tends to follow proportional patterns: the Fibonacci percentages describe the range of "normal" retracements that represent temporary counter-pressure rather than full reversals.
Each ratio has a characteristic role. The 23.6% retracement is the shallowest, suggesting strong original momentum. The 38.2% represents a moderate, healthy correction. The 50% is psychological equilibrium. The 61.8% golden ratio is considered the maximum tolerable correction before trend continuation. The 78.6% is the deepest standard level, suggesting the original trend is under serious reversal pressure.
Understanding these depths matters because the FluxGate Precision Indicator lets you select which Fibonacci levels serve as trend thresholds. Choosing 23.6% for the upper threshold defines "bullish" as price near the high of the range. Choosing 38.2% requires stronger positioning before a bullish signal fires. This directly affects signal frequency and quality, discussed in the Fibonacci Sensitivity Tuning section.
3. Using Fibonacci for Trend Detection
Traditional Fibonacci analysis is backward-looking: you identify a completed swing, draw retracement levels, and wait for price to reach them. The FluxGate Precision Indicator uses Fibonacci levels in a forward-looking way. Instead of measuring a completed swing after the fact, it continuously derives Fibonacci levels from a rolling analysis window -- the highest high and lowest low over the most recent N bars.
The three derived levels are:
-
Fib High -- The upper threshold, derived by subtracting 23.6% or 38.2% of the range from the highest high. Bullish dominance is confirmed when price is above this level.
-
Trend Line -- The 50% midpoint. This equilibrium level divides the range into upper (bullish) and lower (bearish) territory.
-
Fib Low -- The lower threshold, derived by subtracting 61.8% or 78.6% of the range from the highest high. Bearish dominance is confirmed below this level.
A BUY signal requires price to close above both the Trend Line and Fib High. A SELL signal requires closing below both the Trend Line and Fib Low. This dual-threshold requirement filters out oscillations around the midpoint that would otherwise produce false signals.
The levels recalculate on every bar as new highs or lows form within the window, adapting to changing conditions without manual intervention. When the market is volatile and the range is wide, the distance between thresholds is large, requiring a more significant move to trigger a signal. When quiet, the thresholds contract, making the system more responsive. This volatility adaptation is built into the rolling window mathematics.
4. The Analysis Window Concept
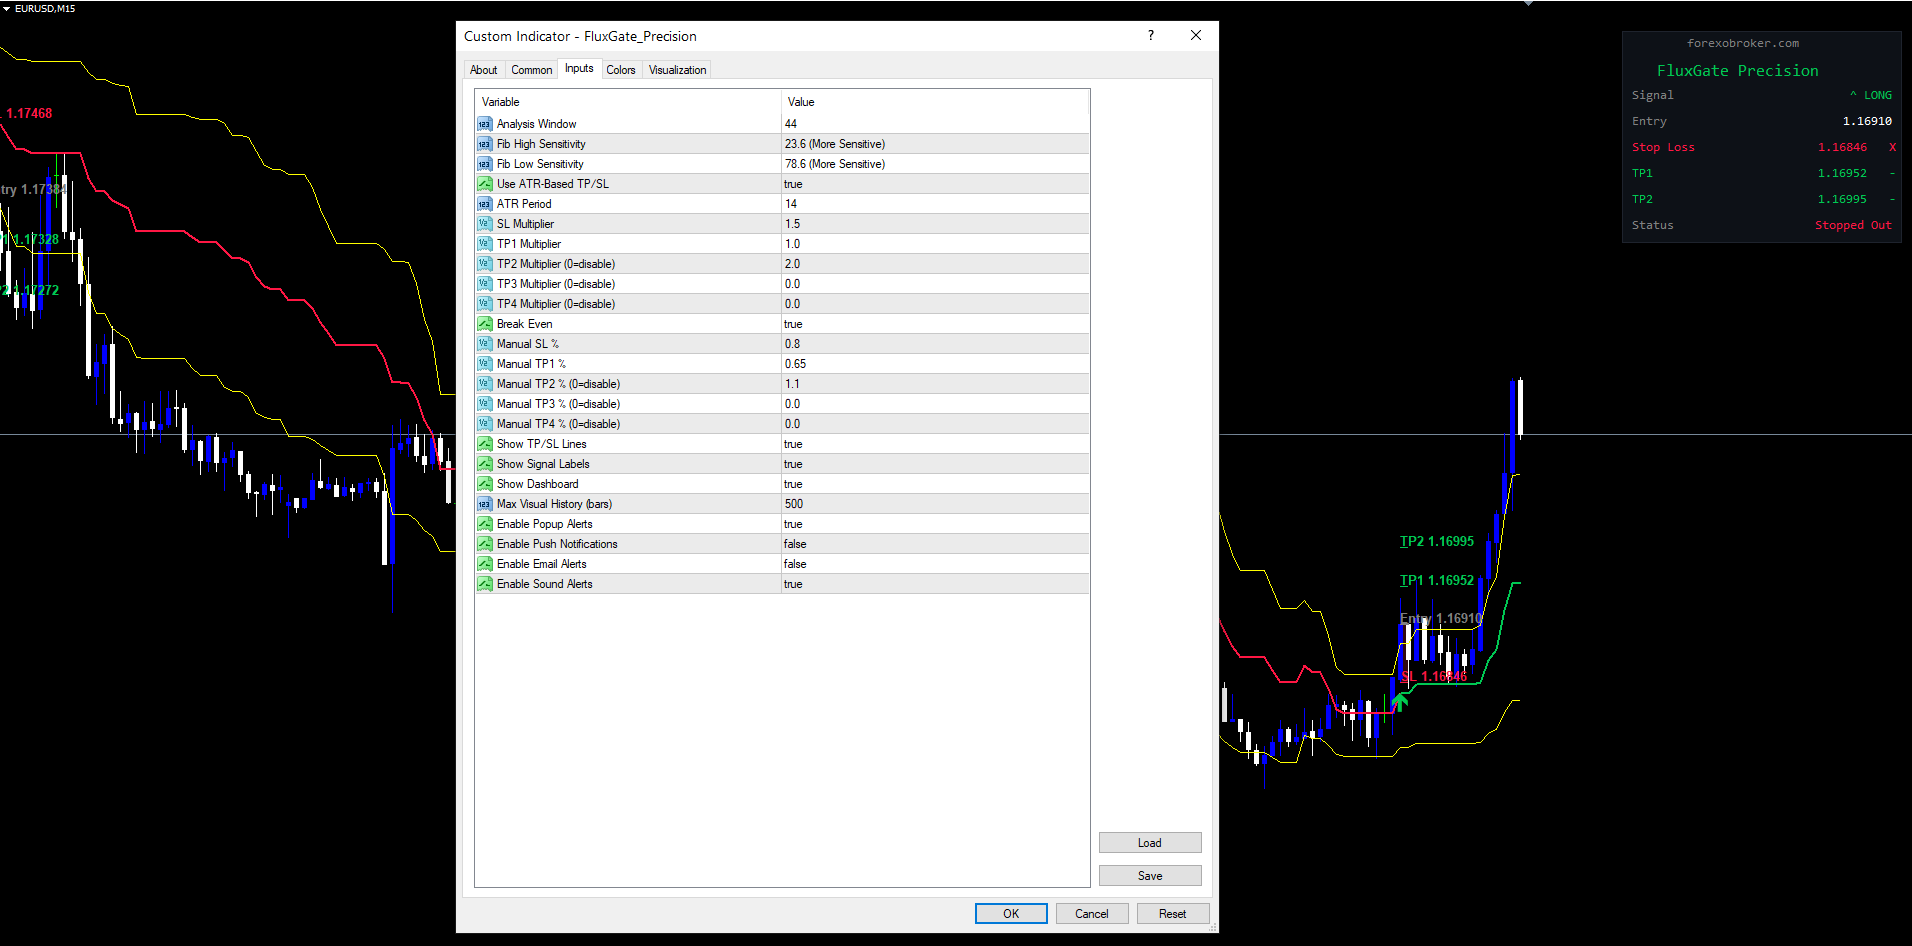
The analysis window is the foundation of trend detection. Controlled by the InpAnalysisWindow parameter (default: 44), it defines how many bars the indicator uses to calculate the highest high and lowest low from which the three Fibonacci levels are derived.
On every bar, the indicator looks back over the most recent 44 bars, finds the highest high and lowest low, computes the range, and derives the Fib High, Trend Line, and Fib Low. As each new bar forms, the oldest bar drops off and the newest enters, creating a rolling calculation that continuously tracks market structure.
The default value of 44 balances responsiveness and stability. On H1, it covers just under two trading days. On D1, approximately two months. Shorter windows (e.g., 20) produce tighter bands with more frequent signals but more false positives. Longer windows (e.g., 100) create wider, more stable bands with fewer signals and slower response.
Traders can adjust to match their style:
- Short-term (M5-M30): Reduce to 20-30 bars for faster signals
- Swing (H1-H4): Default 44 captures medium-term trends well
- Position (D1-W1): Increase to 60-100 bars for broader trend identification
The ATR period (default 14) measures volatility over a shorter lookback than the analysis window, so TP/SL levels respond to recent volatility changes faster than the Fibonacci bands adjust. This dual-speed system captures trend structure broadly but calibrates risk tightly.
5. Fibonacci Sensitivity Tuning
Two parameters control where the upper and lower Fibonacci thresholds sit within the rolling range: InpFibHigh (Fib High Sensitivity) and InpFibLow (Fib Low Sensitivity).
Fib High Sensitivity offers two options:
-
23.6% (More Sensitive) -- Default. The upper threshold sits close to the range high. Price does not need to retrace far before the BUY threshold is met, producing more frequent signals.
-
38.2% (Less Sensitive) -- The threshold moves further from the high toward the midpoint, requiring stronger bullish conviction before a BUY signal fires. Fewer but potentially higher-quality signals.
Fib Low Sensitivity also offers two options:
-
61.8% (Less Sensitive) -- The lower threshold is closer to the midpoint, producing fewer SELL signals.
-
78.6% (More Sensitive) -- Default. The threshold sits deep in the lower portion, requiring price to show strong bearish momentum before a SELL signal fires.
The interaction between these settings determines overall signal character:
| Configuration | Fib High | Fib Low | Signal Frequency | Best For |
|---|---|---|---|---|
| Default | 23.6% | 78.6% | Moderate | General trading, all timeframes |
| Aggressive | 23.6% | 61.8% | Higher | Scalping, range-bound markets |
| Conservative | 38.2% | 78.6% | Lower | Swing trading, trending markets |
| Maximum Filter | 38.2% | 61.8% | Lowest | Position trading, major trends only |
The signal logic always requires price to close above both the Fib High AND the Trend Line (50%) for a BUY, or below both the Fib Low AND the Trend Line for a SELL. This dual-threshold requirement filters noise even with the "More Sensitive" settings.
6. Non-Repainting Signal Architecture
A repainting indicator shows signals on the current bar that disappear or change when the next bar opens, making backtesting misleading. The FluxGate Precision Indicator is non-repainting: all signal decisions are made on confirmed (completed) bars only at shift >= 1. A signal can only appear after the bar has closed and its final close price is known.
The signal detection logic:
canBuy = (close >= trendLine) AND (close >= fibHigh) AND (not already bullish) canSell = (close <= trendLine) AND (close <= fibLow) AND (not already bearish)
The state machine guard prevents duplicate signals. Once a BUY fires and the indicator enters a bullish state, no further BUY signals are generated until a SELL signal resets the state. This ensures exactly one signal per trend change.
Three practical consequences:
-
What you see on historical charts is exactly what happened in real time. Every arrow appeared at the close of the bar it is drawn on and never moved afterward.
-
Signals alternate between BUY and SELL. You will never see two consecutive signals in the same direction.
-
The current bar shows no signal until it closes. There is no "preview" on the forming bar.
The Fibonacci band lines do update on the current bar as new highs and lows form -- this is expected behavior for rolling reference levels. What does not change is the signal: once placed on a confirmed bar, it stays permanently.
7. ATR-Adaptive Risk Management
The FluxGate Precision Indicator uses an ATR-adaptive TP/SL system that automatically scales risk levels to current market volatility.
How ATR-Adaptive Levels Work
When a signal fires, the indicator reads the current ATR value and computes a normalized ratio:
atrRatio = ATR / close
This converts ATR to a percentage of price, making the same multiplier settings produce proportionally appropriate levels across instruments with different price scales. TP and SL levels are then:
For a BUY signal: SL = close * (1 - atrRatio * SL_multiplier) TP1 = close * (1 + atrRatio * TP1_multiplier) TP2 = close * (1 + atrRatio * TP2_multiplier) For a SELL signal: SL = close * (1 + atrRatio * SL_multiplier) TP1 = close * (1 - atrRatio * TP1_multiplier) TP2 = close * (1 - atrRatio * TP2_multiplier)
Default Multiplier Settings
| Parameter | Default | Effect |
|---|---|---|
| InpSLMult | 1.5 | Stop loss at 1.5x ATR-ratio distance from entry |
| InpTP1Mult | 1.0 | First take profit at 1.0x ATR-ratio distance |
| InpTP2Mult | 2.0 | Second take profit at 2.0x ATR-ratio distance |
| InpTP3Mult | 0.0 | Third take profit (disabled by default) |
| InpTP4Mult | 0.0 | Fourth take profit (disabled by default) |
TP1 is intentionally closer to entry than the stop loss -- a "quick profit" target that triggers the progressive break-even system to eliminate risk on the remaining position.
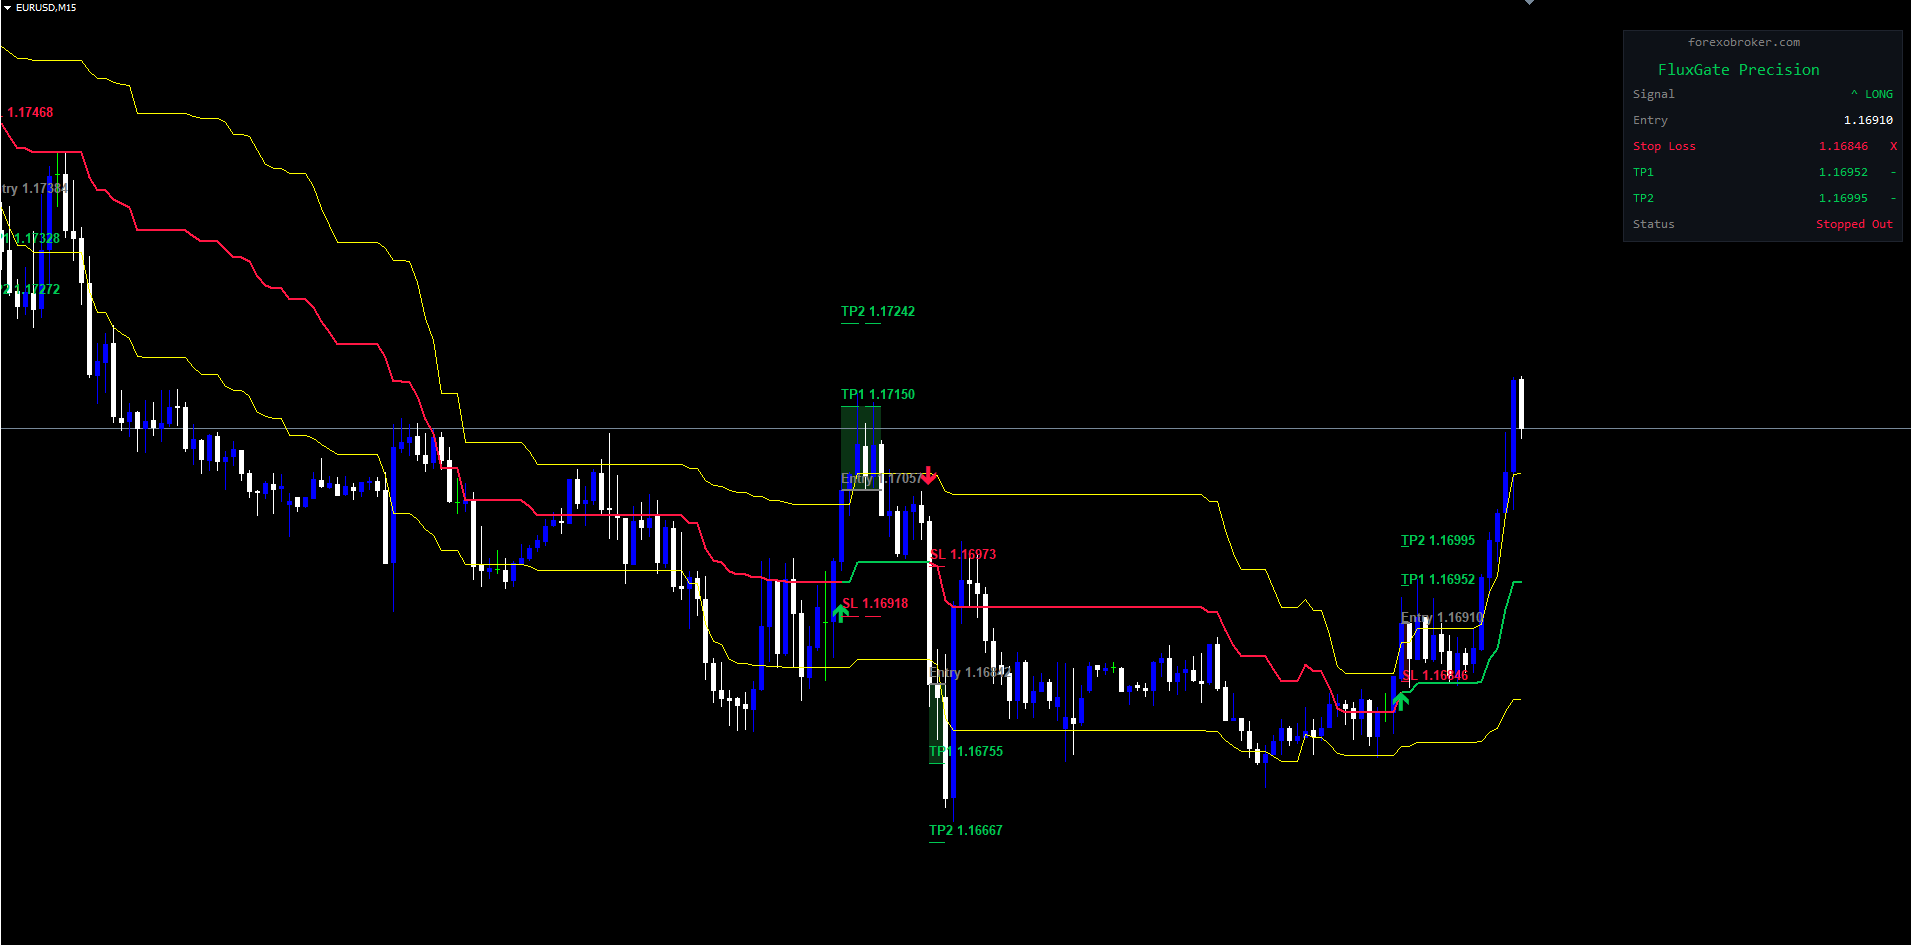
Working Example
BUY signal on EURUSD at close 1.16910, ATR 0.00090:
    atrRatio = 0.00090 / 1.16910 = 0.000770

SL  = 1.16910 * (1 - 0.000770 * 1.5) = 1.16775
TP1 = 1.16910 * (1 + 0.000770 * 1.0) = 1.17000
TP2 = 1.16910 * (1 + 0.000770 * 2.0) = 1.17090
The same settings on XAUUSD at 2350.00 with ATR 28.00 would produce SL=2308.03, TP1=2377.99, TP2=2406.00 -- automatically scaled wider for the higher-volatility instrument. No manual adjustment needed when switching between charts.
Disabling Take-Profit Levels
Setting any TP multiplier to 0.0 disables that level. Common configurations:
- 1 TP: TP1=2.0, TP2-4=0 (single target at 2x ATR)
- 2 TPs: TP1=1.0, TP2=2.0 (default -- quick profit + trend continuation)
- 4 TPs: TP1=0.8, TP2=1.5, TP3=2.5, TP4=4.0 (granular scaling)
Manual Percentage Mode
When InpUseATR = false, TP/SL levels are fixed percentages of entry price:
| Parameter | Default | Effect |
|---|---|---|
| InpManualSL | 0.8% | Stop loss at 0.8% from entry |
| InpManualTP1 | 0.65% | TP1 at 0.65% from entry |
| InpManualTP2 | 1.1% | TP2 at 1.1% from entry |
| InpManualTP3 | 0.0% | TP3 disabled |
| InpManualTP4 | 0.0% | TP4 disabled |
Manual mode is useful when you want consistent distances regardless of volatility. However, ATR-adaptive mode is recommended for most use cases.
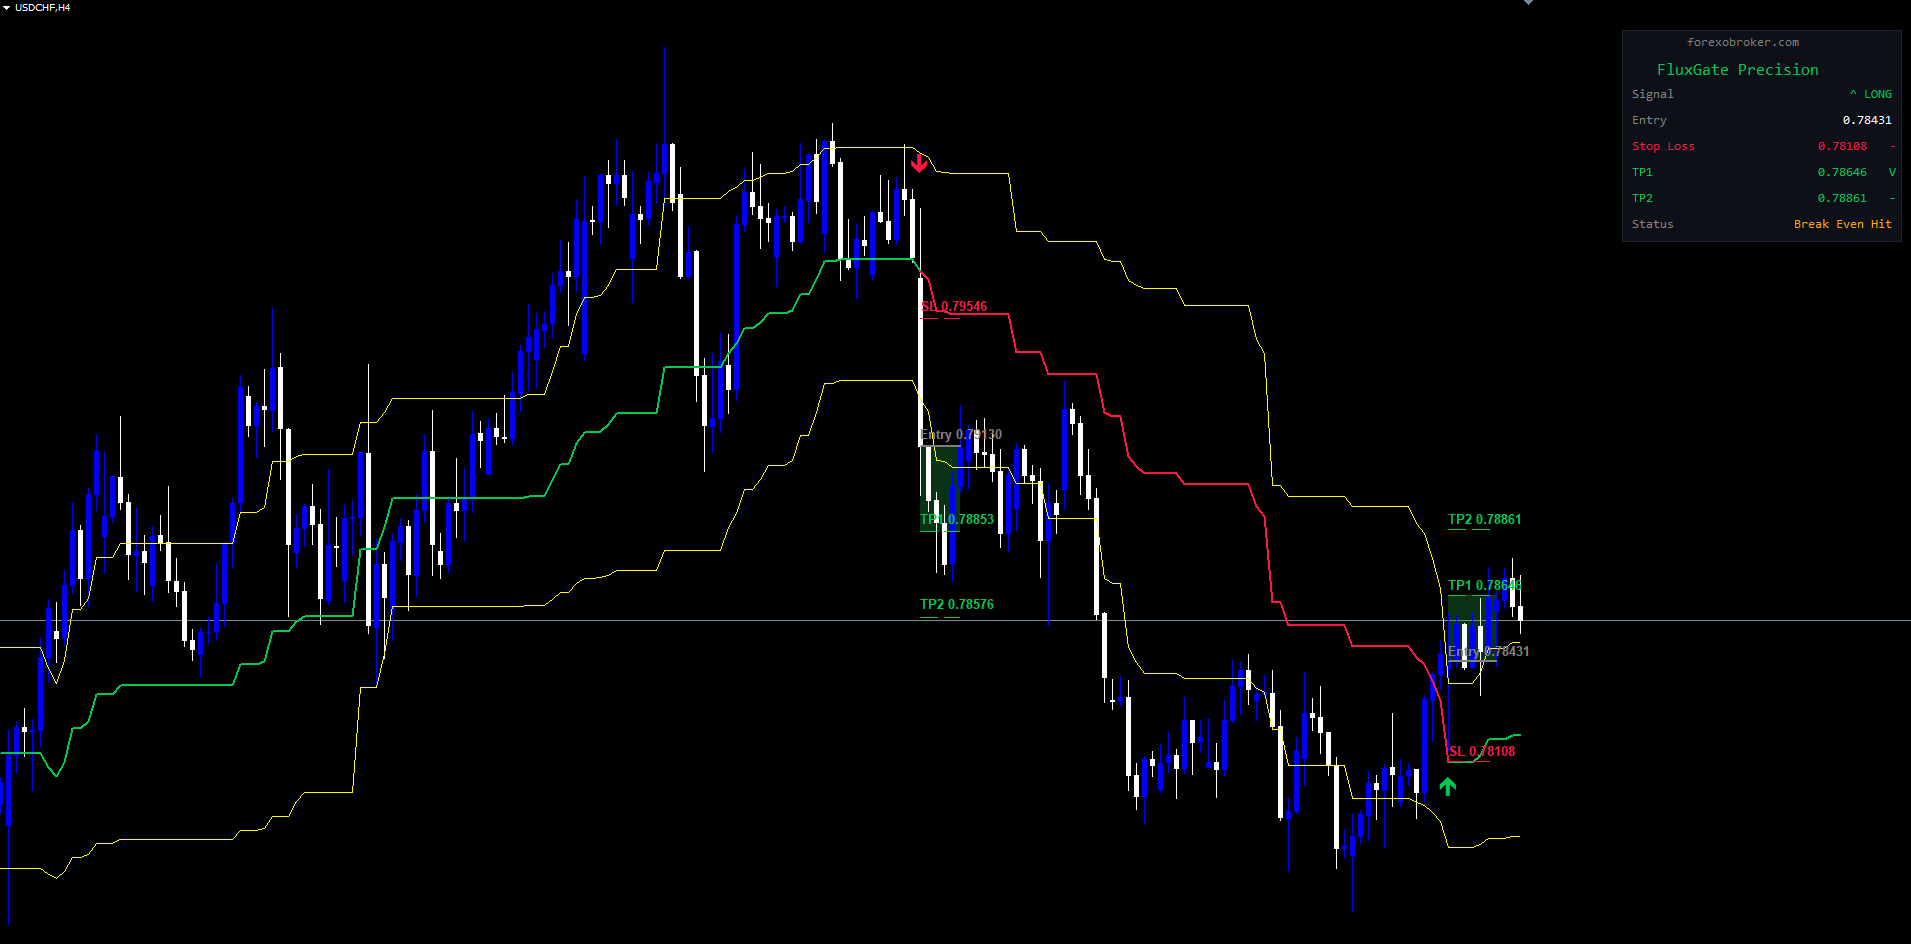
8. Progressive Break-Even Trailing
The progressive break-even system, controlled by InpBreakEven (default: true), automatically adjusts the effective stop-loss level as each take-profit target is reached.
The progression:
| Event | Break-Even Moves To | Worst-Case Outcome |
|---|---|---|
| Signal fires | Original SL | Full loss |
| TP1 hit | Entry price | Breakeven (zero loss) |
| TP2 hit | TP1 level | Locked-in TP1 profit |
| TP3 hit | TP2 level | Locked-in TP2 profit |
| TP4 hit | Trade fully closed | All targets captured |
If price reverses to the current break-even level at any point, the trade closes at that level. If the stop loss is hit before any TP, the trade closes at the original SL with a loss.
The fundamental advantage over fixed stop-losses is that a trade moving 80% toward your target before reversing no longer produces the same loss as an immediate adverse move. Once TP1 is hit, the worst case becomes breakeven. Each target ratchets the floor upward, creating an asymmetric payoff structure that significantly improves overall expectancy.
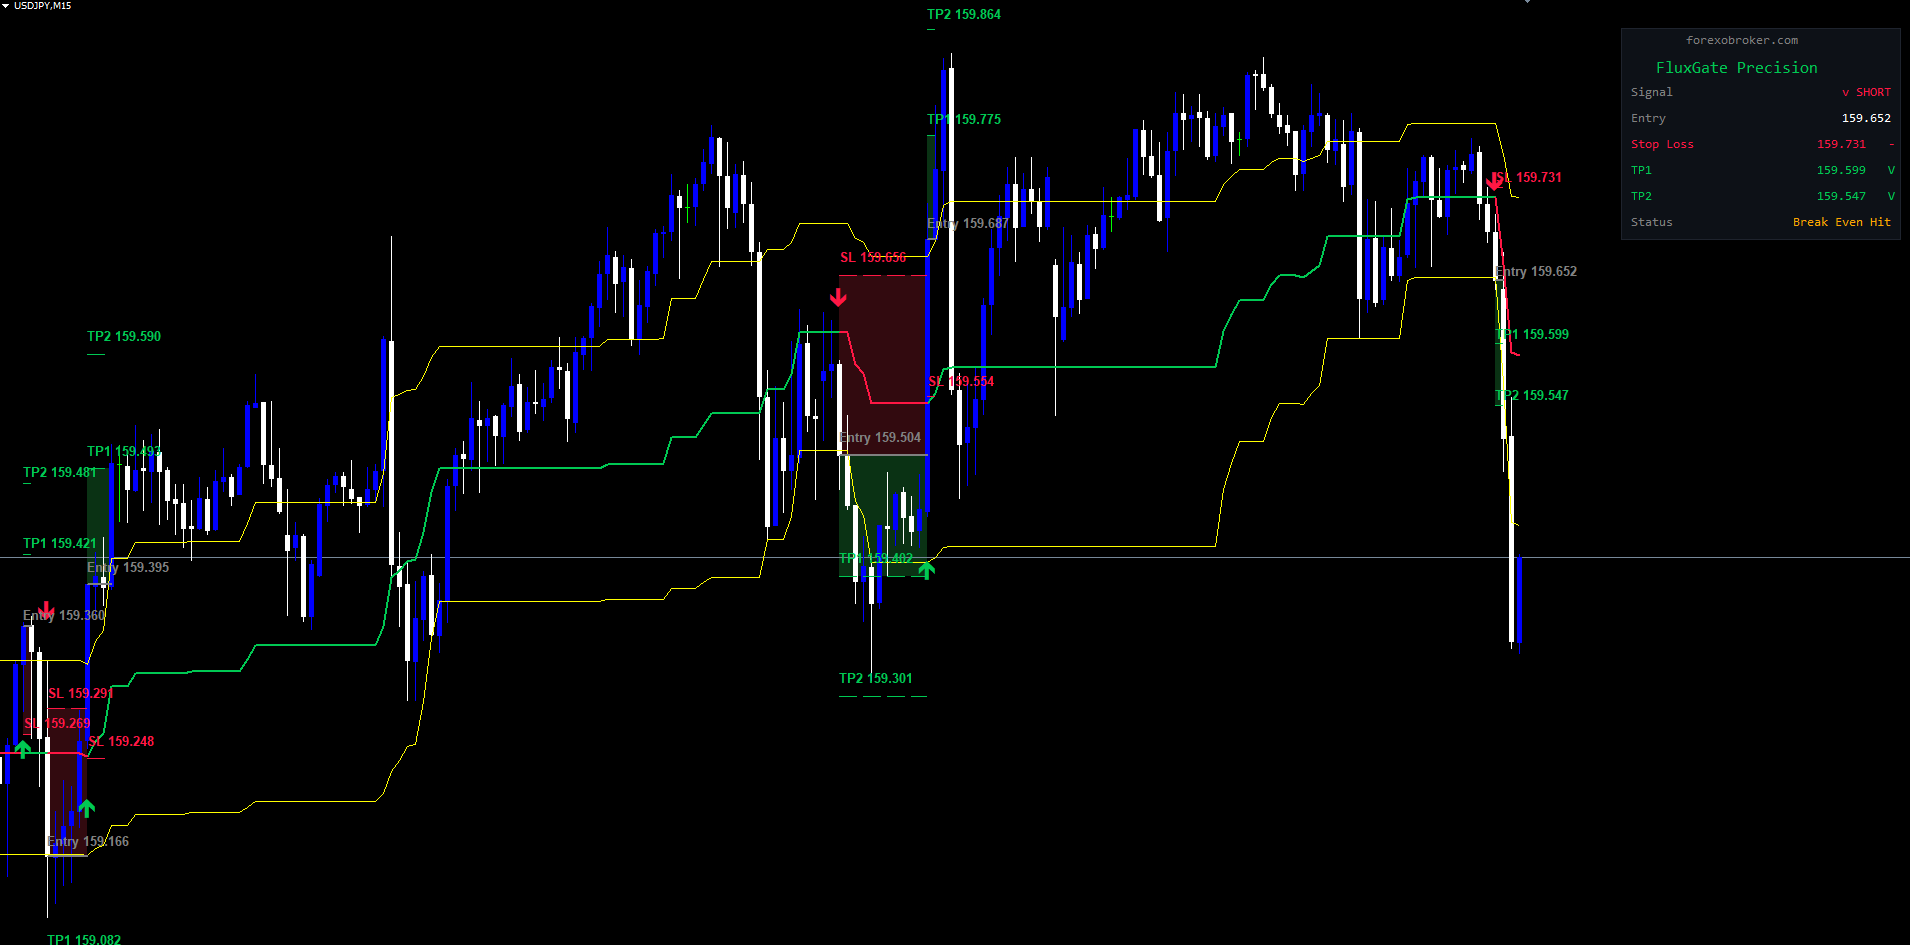
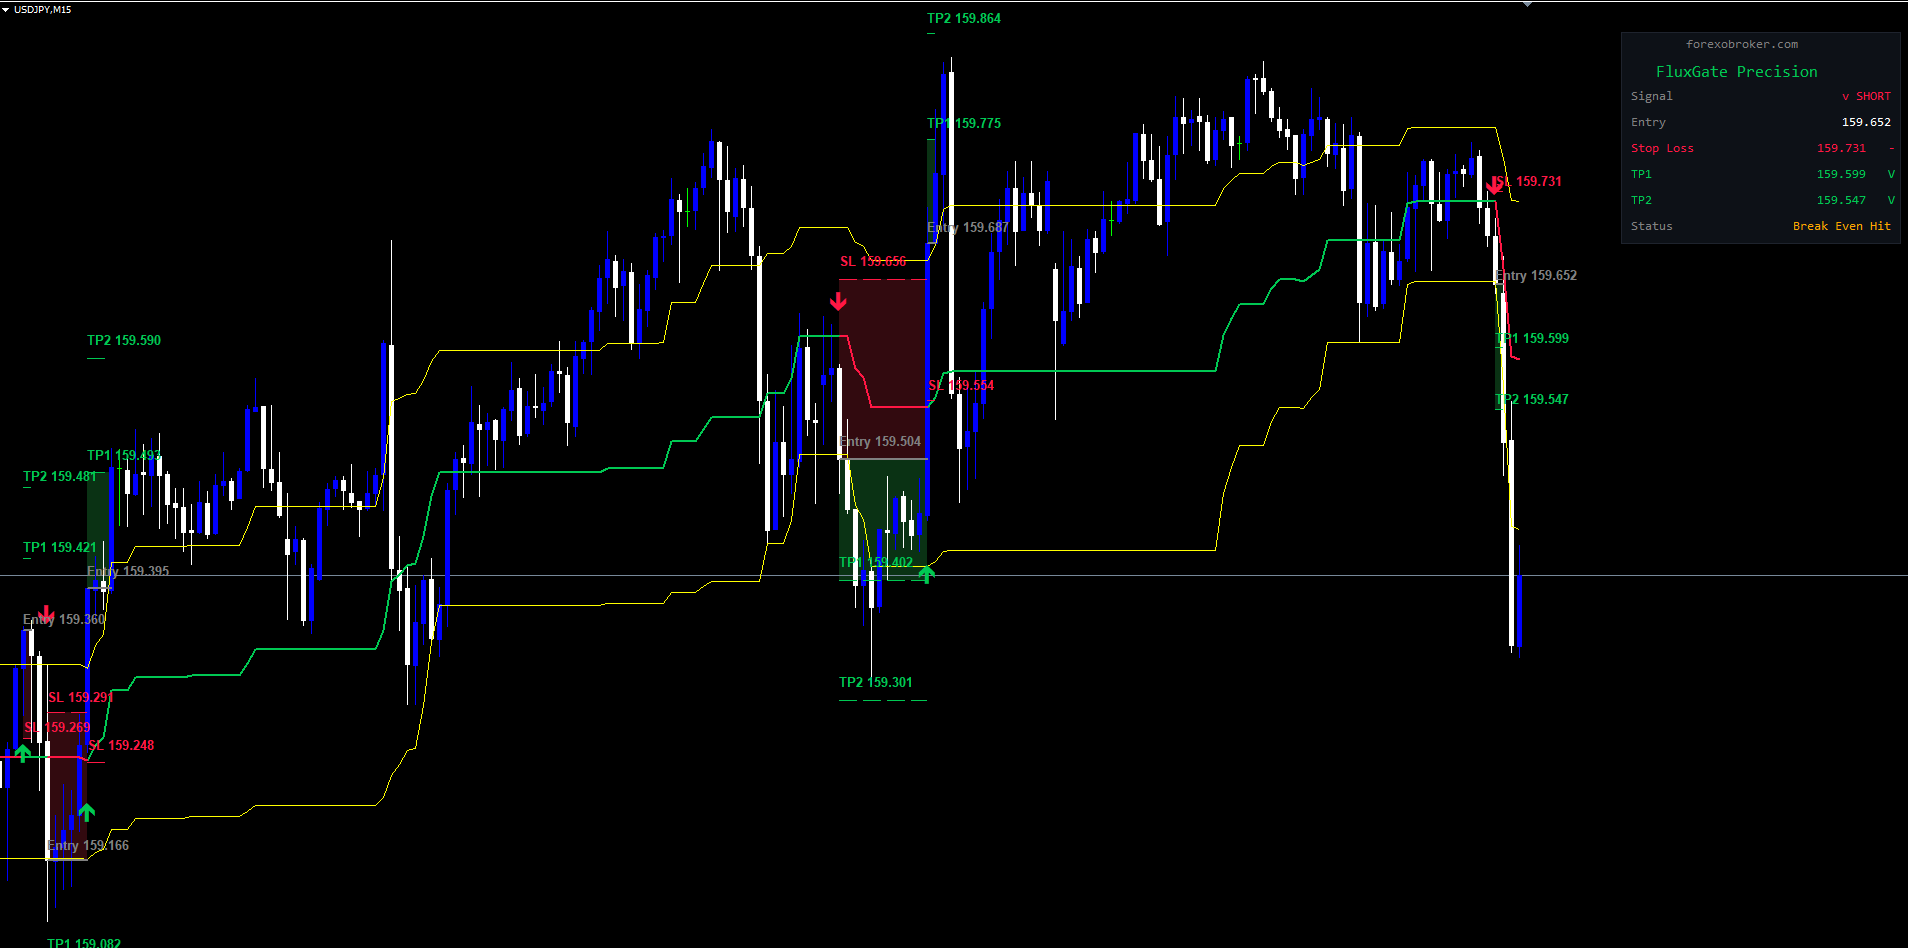
On the chart, green-filled rectangles appear between the entry and each TP when hit. Red-filled rectangles appear if the stop loss triggers. The dashboard shows "V" next to each hit TP, "X" next to a triggered SL, and the current status (Active, Break Even Hit, Stopped Out, All TPs Hit, or Trend Change).
For most traders on M15 and above, keeping break-even enabled is recommended. Consider disabling it only for very short-term scalping where normal price noise may trigger premature closures.
9. The Real-Time Dashboard
The indicator includes an on-chart dashboard panel positioned in the upper-right corner, toggled with InpShowDashboard.
The dashboard displays signal direction (^ LONG or v SHORT), entry price, SL with hit status, each active TP with hit status, and the current trade status. It uses a dark background with colored text for readability against any chart scheme.
The dashboard automatically adjusts its height based on active TP levels and repositions when the chart is resized. It persists across chart refreshes by replaying the historical signal sequence on recalculation.
Status Messages
| Status | Color | Meaning |
|---|---|---|
| Awaiting Signal | Orange | No active trade session |
| Active | Green | Trade in progress, no TP or SL hit yet |
| Break Even Hit | Orange | Protective stop triggered after a TP hit |
| Stopped Out | Red | Price hit stop loss |
| All TPs Hit | Orange | All enabled targets reached |
| Trend Change | Orange | Opposite signal closed the previous session |
At a glance, check: (1) signal direction, (2) status, and (3) TP markers (V or -) to know the full trade state instantly.
10. The Alert System
The indicator supports 8 alert conditions across 4 delivery channels, allowing real-time notification without continuously watching the chart.
Alert Conditions
| Condition | Fires When |
|---|---|
| BUY Signal | New bullish trend change confirmed |
| SELL Signal | New bearish trend change confirmed |
| TP1 Hit | Price reaches first take-profit |
| TP2 Hit | Price reaches second take-profit |
| TP3 Hit | Price reaches third take-profit |
| TP4 Hit | Price reaches fourth take-profit |
| SL Hit | Price reaches stop-loss |
| BE Hit | Price reverses to break-even level |
Alert Channels
| Channel | Parameter | Default |
|---|---|---|
| Popup | InpAlertPopup | true |
| Sound | InpAlertSound | true |
| Push | InpAlertPush | false (requires MetaTrader mobile app setup) |
| InpAlertEmail | false (requires SMTP configuration) |
All four channels can be enabled simultaneously. A history guard ( g_historyDone flag) suppresses alerts during the initial historical calculation, ensuring you only receive alerts for new signals formed after the indicator loads.
11. Practical Trading Workflow
The following workflow describes how to use the FluxGate Precision Indicator from setup through trade management.
Step 1: Configure. Start with defaults: Analysis Window 44, Fib High 23.6%, Fib Low 78.6%, ATR-based TP/SL enabled (SL=1.5x, TP1=1.0x, TP2=2.0x), Break Even enabled. Turn on popup and sound alerts.
Step 2: Identify the Signal. Wait for a BUY (green arrow below bar) or SELL (red arrow above bar) signal. The dashboard updates with entry price and all TP/SL levels.
Step 3: Evaluate Context. Not every signal warrants a trade. Check higher-timeframe alignment, nearby key levels, and upcoming news events. Confluence increases signal reliability.
Step 4: Enter the Trade. Place a market order using the exact SL and TP prices displayed on the dashboard.
Step 5: Monitor Progress. Watch the dashboard for "V" markers as TPs are hit and status updates. If break-even is enabled, consider closing partial positions at each TP level.
Step 6: Review. After each trade, scroll back to see the green (TP hit) and red (SL hit) rectangles. Adjust ATR multipliers if TP1 is rarely reached or if stops are too tight.
Timeframe Considerations
| Timeframe | Signal Frequency | Best For |
|---|---|---|
| M5-M15 | High | Scalping, day trading |
| M30-H1 | Moderate | Intraday swing trading |
| H4-D1 | Low | Swing trading |
| W1-MN | Very low | Position trading |
For broader coverage, apply the indicator to multiple charts simultaneously. Each instance operates independently. A practical approach: use H4 for overall trend direction, H1 for primary signals, and M15 for entry timing.
12. Parameter Reference
The FluxGate Precision Indicator has 24 input parameters organized into 5 groups.
Signal Settings
| Parameter | Default | Type | Description |
|---|---|---|---|
| Analysis Window | 44 | int | Number of bars for highest high / lowest low calculation |
| Fib High Sensitivity | 23.6 (More Sensitive) | enum | Upper Fibonacci threshold: 23.6% or 38.2% |
| Fib Low Sensitivity | 78.6 (More Sensitive) | enum | Lower Fibonacci threshold: 61.8% or 78.6% |
TP/SL Settings
| Parameter | Default | Type | Description |
|---|---|---|---|
| Use ATR-Based TP/SL | true | bool | Toggle ATR-adaptive mode (true) or manual percentage mode (false) |
| ATR Period | 14 | int | Number of bars for ATR calculation |
| SL Multiplier | 1.5 | double | Stop-loss distance as multiple of ATR ratio |
| TP1 Multiplier | 1.0 | double | First take-profit distance as multiple of ATR ratio |
| TP2 Multiplier (0=disable) | 2.0 | double | Second take-profit distance; set to 0 to disable |
| TP3 Multiplier (0=disable) | 0.0 | double | Third take-profit distance; disabled by default |
| TP4 Multiplier (0=disable) | 0.0 | double | Fourth take-profit distance; disabled by default |
| Break Even | true | bool | Enable progressive break-even trailing |
Manual TP/SL (When ATR Disabled)
| Parameter | Default | Type | Description |
|---|---|---|---|
| Manual SL % | 0.8 | double | Stop-loss distance as percentage of entry price |
| Manual TP1 % | 0.65 | double | First take-profit as percentage of entry price |
| Manual TP2 % (0=disable) | 1.1 | double | Second take-profit as percentage; 0 disables |
| Manual TP3 % (0=disable) | 0.0 | double | Third take-profit; disabled by default |
| Manual TP4 % (0=disable) | 0.0 | double | Fourth take-profit; disabled by default |
Display Settings
| Parameter | Default | Type | Description |
|---|---|---|---|
| Show TP/SL Lines | true | bool | Draw horizontal TP/SL lines and fill rectangles on chart |
| Show Signal Labels | true | bool | Display BUY/SELL arrow signals on chart |
| Show Dashboard | true | bool | Show the real-time dashboard panel |
| Max Visual History (bars) | 500 | int | Maximum number of bars back to retain visual objects |
Alert Settings
| Parameter | Default | Type | Description |
|---|---|---|---|
| Enable Popup Alerts | true | bool | Show MetaTrader popup dialog on signal/TP/SL events |
| Enable Push Notifications | false | bool | Send push notification to MetaTrader mobile app |
| Enable Email Alerts | false | bool | Send email notification via configured SMTP |
| Enable Sound Alerts | true | bool | Play alert sound file |
Preset Profiles
Conservative Profile -- Fewer signals, wider bands, more room for trades to develop:
| Parameter | Value |
|---|---|
| Analysis Window | 60 |
| Fib High Sensitivity | 38.2 (Less Sensitive) |
| Fib Low Sensitivity | 78.6 (More Sensitive) |
| SL Multiplier | 2.0 |
| TP1 Multiplier | 1.5 |
| TP2 Multiplier | 3.0 |
| Break Even | true |
Default Profile -- Balanced signal frequency and risk management:
| Parameter | Value |
|---|---|
| Analysis Window | 44 |
| Fib High Sensitivity | 23.6 (More Sensitive) |
| Fib Low Sensitivity | 78.6 (More Sensitive) |
| SL Multiplier | 1.5 |
| TP1 Multiplier | 1.0 |
| TP2 Multiplier | 2.0 |
| Break Even | true |
Aggressive Profile -- More frequent signals, tighter risk management:
| Parameter | Value |
|---|---|
| Analysis Window | 25 |
| Fib High Sensitivity | 23.6 (More Sensitive) |
| Fib Low Sensitivity | 61.8 (Less Sensitive) |
| SL Multiplier | 1.0 |
| TP1 Multiplier | 0.8 |
| TP2 Multiplier | 1.5 |
| TP3 Multiplier | 2.5 |
| Break Even | true |
13. Installation
The FluxGate Precision Indicator is distributed through the MQL5.com Market and installs automatically for both MetaTrader 4 and MetaTrader 5.
Installation Steps
- Visit the product page on the MQL5.com Market and purchase the indicator (or download the free demo version for testing)
- The indicator installs automatically via the MQL5.com platform -- no manual file copying is required
- Restart MetaTrader or refresh the Navigator panel (right-click > Refresh)
- Find the indicator in Navigator > Indicators > Market
- Drag the indicator onto any chart to activate it
- Configure the input parameters in the dialog that appears and click OK
First-Time Setup Recommendations
- Start with the default parameters on a timeframe you are familiar with
- Enable the dashboard to see real-time trade tracking
- Enable popup and sound alerts so you are notified of new signals
- Let the indicator run for at least a few trading sessions before making parameter adjustments
- Use the free demo version to test on different instruments and timeframes before committing to the full version
The indicator is available on the MQL5 Market for both platforms:
- MetaTrader 5: FluxGate Precision MT5
- MetaTrader 4: FluxGate Precision MT4
CONTACT & SUPPORT
- Email: info@forexobroker.com
- Questions: Use the Comments section on the product page or send a private message
- Bug Reports: Please include your broker name, account type, and a screenshot
-
✅ All MQL Tools: https://www.mql5.com/en/users/forexobroker/ ✅
--------------------------------------------------------------------------------------------------------------
🏦 **Broker I use**: https://icmarkets.com/?camp=55869
🏦 **Broker For EU Traders I use 1**: https://www.ictrading.com?camp=91414
🏦 **Broker I use 2**: https://one.exnessonelink.com/boarding/sign-up/a/c_thuv62ocfq
💻 **VPS**: https://chocoping.com/processing/aff.php?aff=738
💼 **Companies I use for getting funded**:
Fundednext: https://fundednext.com/?fpr=kestutis39
The5ers: https://www.the5ers.com/?afmc=16kl
FTMO: https://trader.ftmo.com/?affiliates=nRAyOhmFRnEnFdOpdLeh
Risk Disclaimer
Trading financial instruments involves substantial risk and may not be suitable for all investors. Past performance of any trading system, methodology, or indicator is not necessarily indicative of future results. The FluxGate Precision Indicator is a technical analysis tool that generates signals based on mathematical calculations applied to historical price data. It does not guarantee profitable trades or positive returns. Users should conduct their own analysis, employ proper risk management, and never risk capital they cannot afford to lose. This indicator does not constitute financial advice, investment advice, or trading advice. The developer assumes no liability for trading losses incurred while using this product.


")
