
Review of trades of the Owl Smart Levels system for the week from March 30 to April 3, 2026

Today I present you an overview of trades made using the Owl trading system - smart levels for the EURUSD, GBPUSD and AUDUSD currency pairs for the week from March 30 to April 3, 2026. The report covers all trades generated by the system's signals, taking into account strict risk management and predefined entry and exit levels.
EURUSD review
The first EURUSD signal was received on March 26. It was weak and did not meet the conditions for a quality entry. This signal was classified as low probability, as the market had already completed the main move and the remaining potential was limited. In such situations, price often loses momentum and does not deliver a full move, so the trade was deliberately skipped.
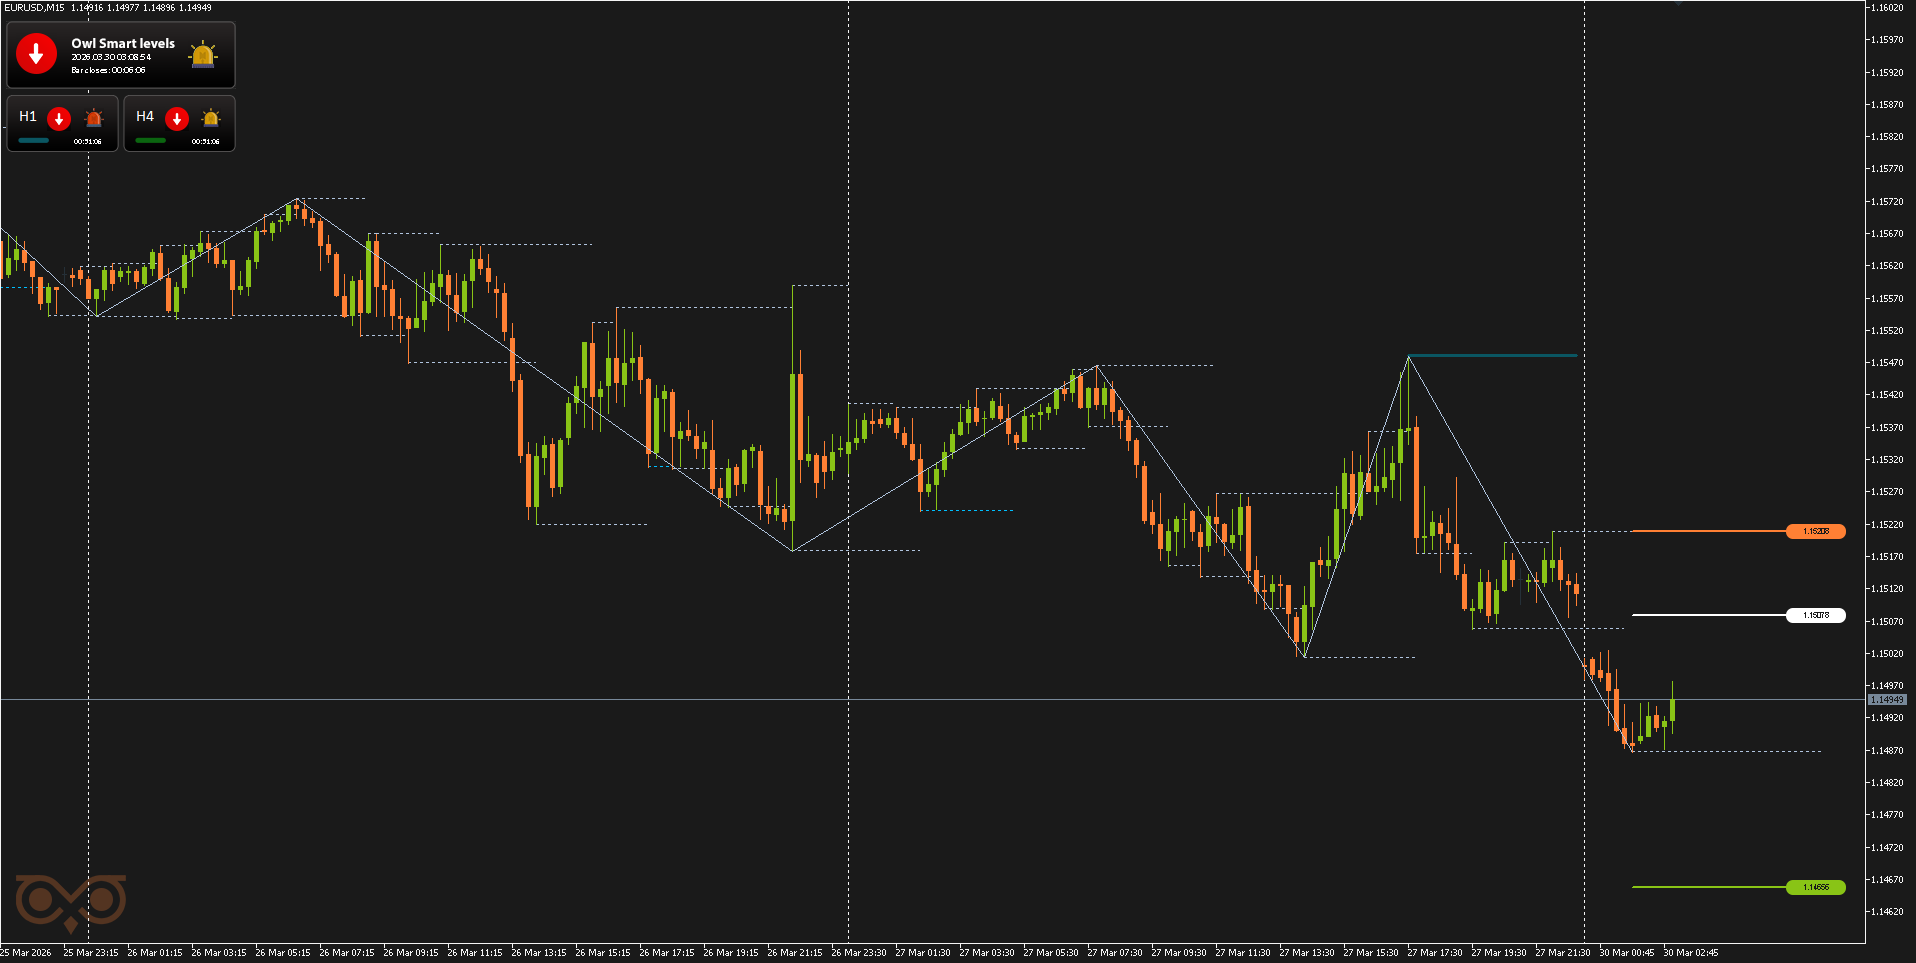
Fig. 1. Low-probability signal — extended move already completed
The second signal was received on March 31. It was also weak and did not meet the conditions for a quality entry, meaning it was low-probability due to limited market potential. After a strong momentum, the price was already in the late phase of the move, so the trade was skipped again.
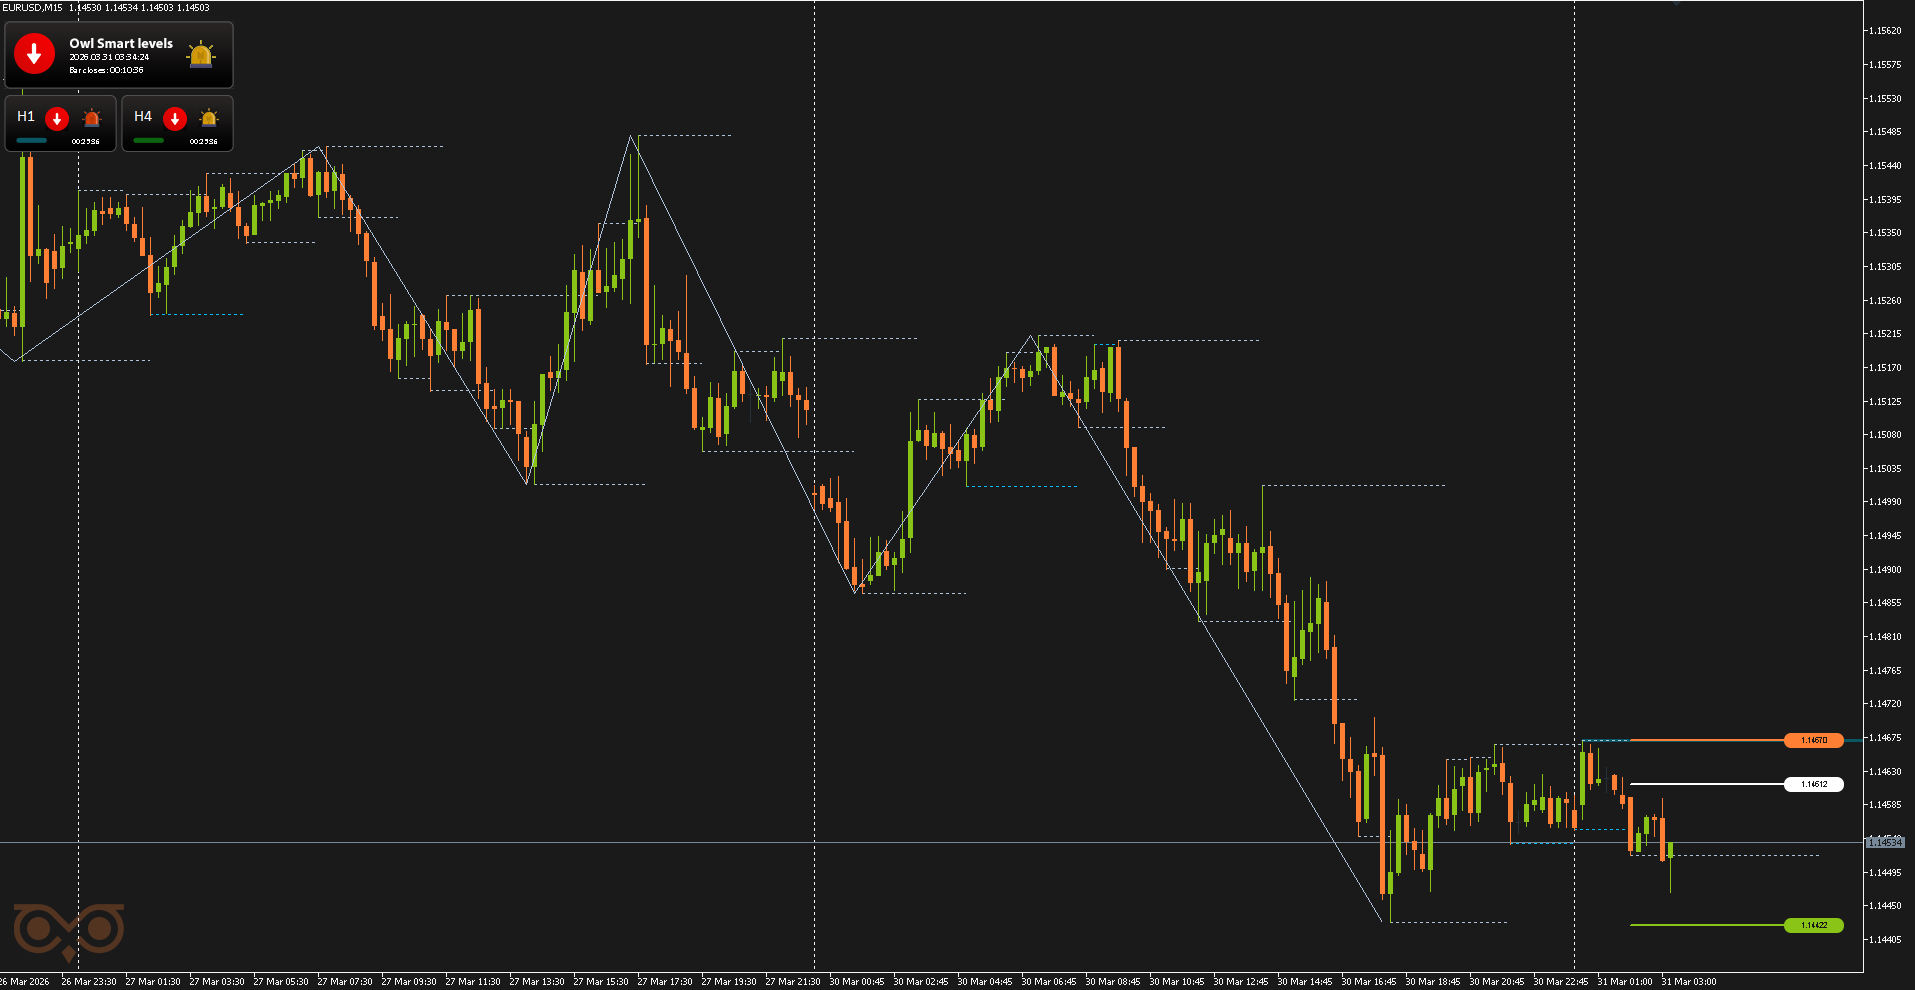
Fig. 2. Low-probability signal — extended move already completed
The third signal appeared on April 2. Despite the indicator signal, the overall setup was no longer ideal for entry. It was classified as low probability since most of the move had already played out and the remaining potential was significantly reduced. For this reason, that scenario was deliberately left out.
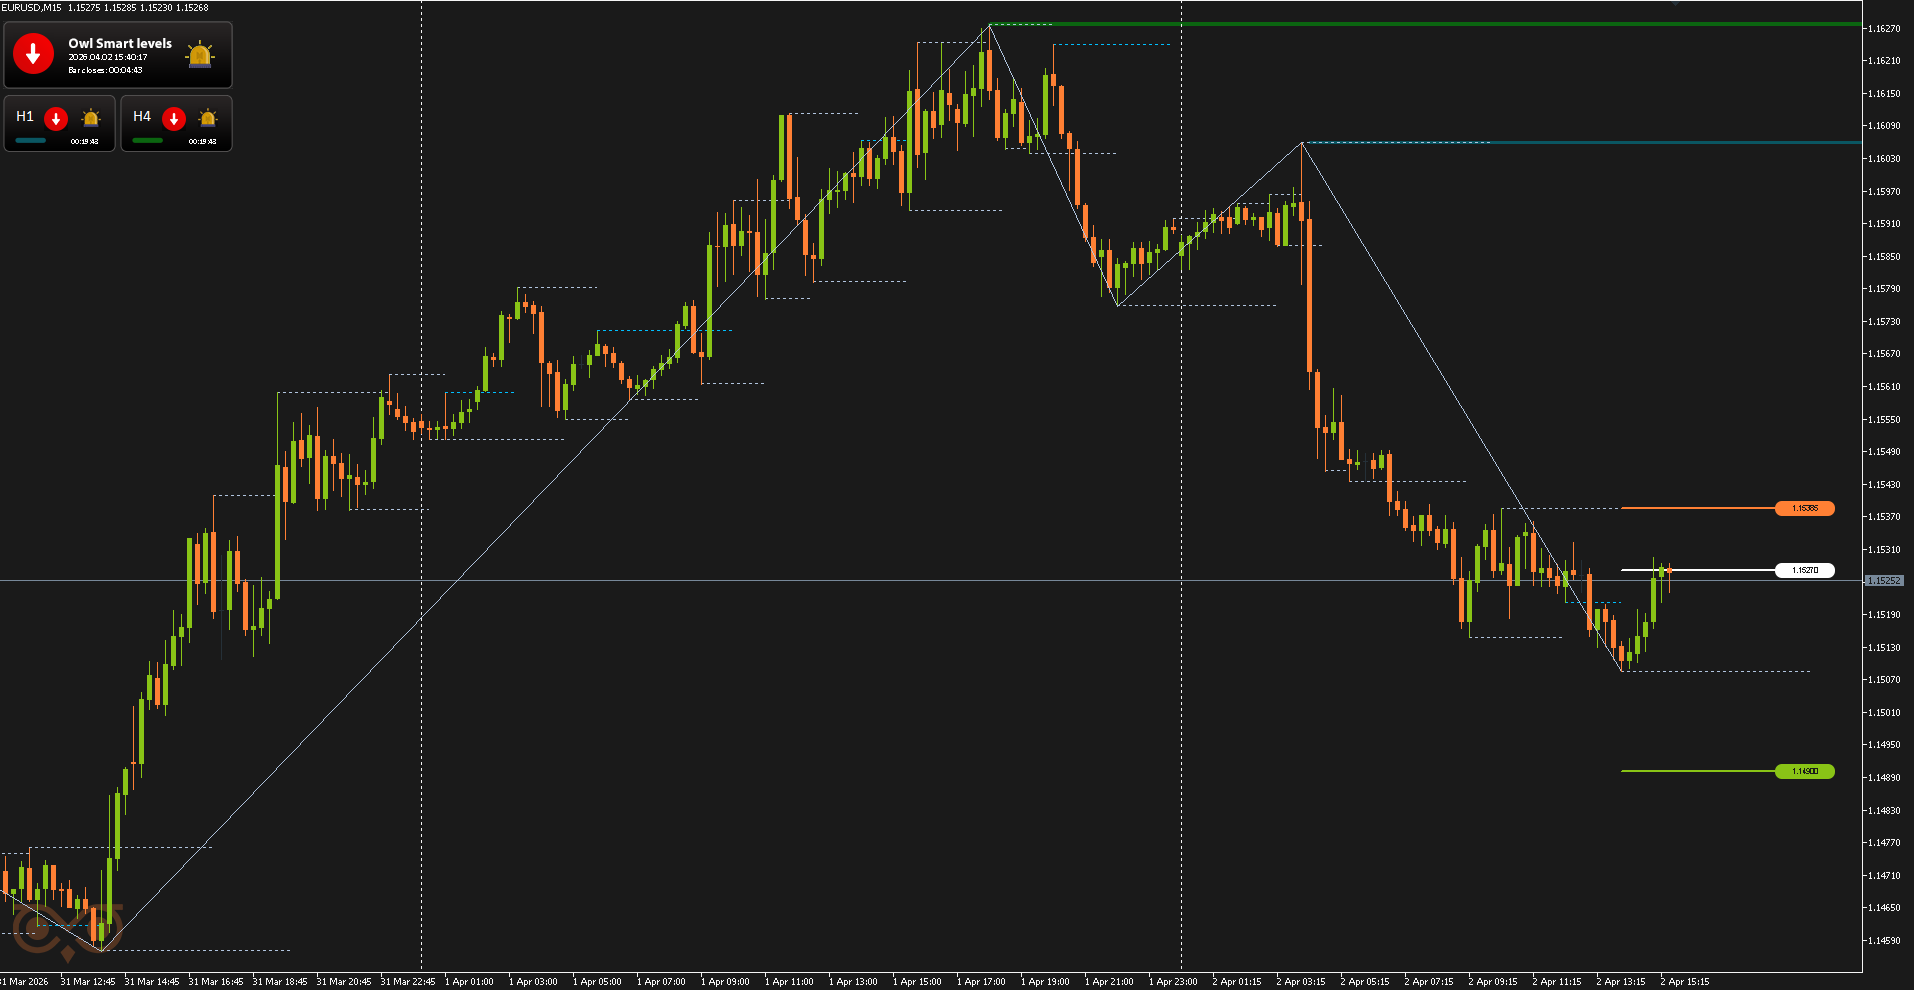
Fig. 3. Low-probability signal — extended move already completed
GBPUSD review
The first GBPUSD signal was received on March 30. At first glance, the market was still moving downward, but the entry formed after a fairly strong impulse. This signal was considered low probability, as most of the move had already occurred and the remaining potential was limited. In such cases, the market often starts to lose strength, so this scenario was deliberately skipped.
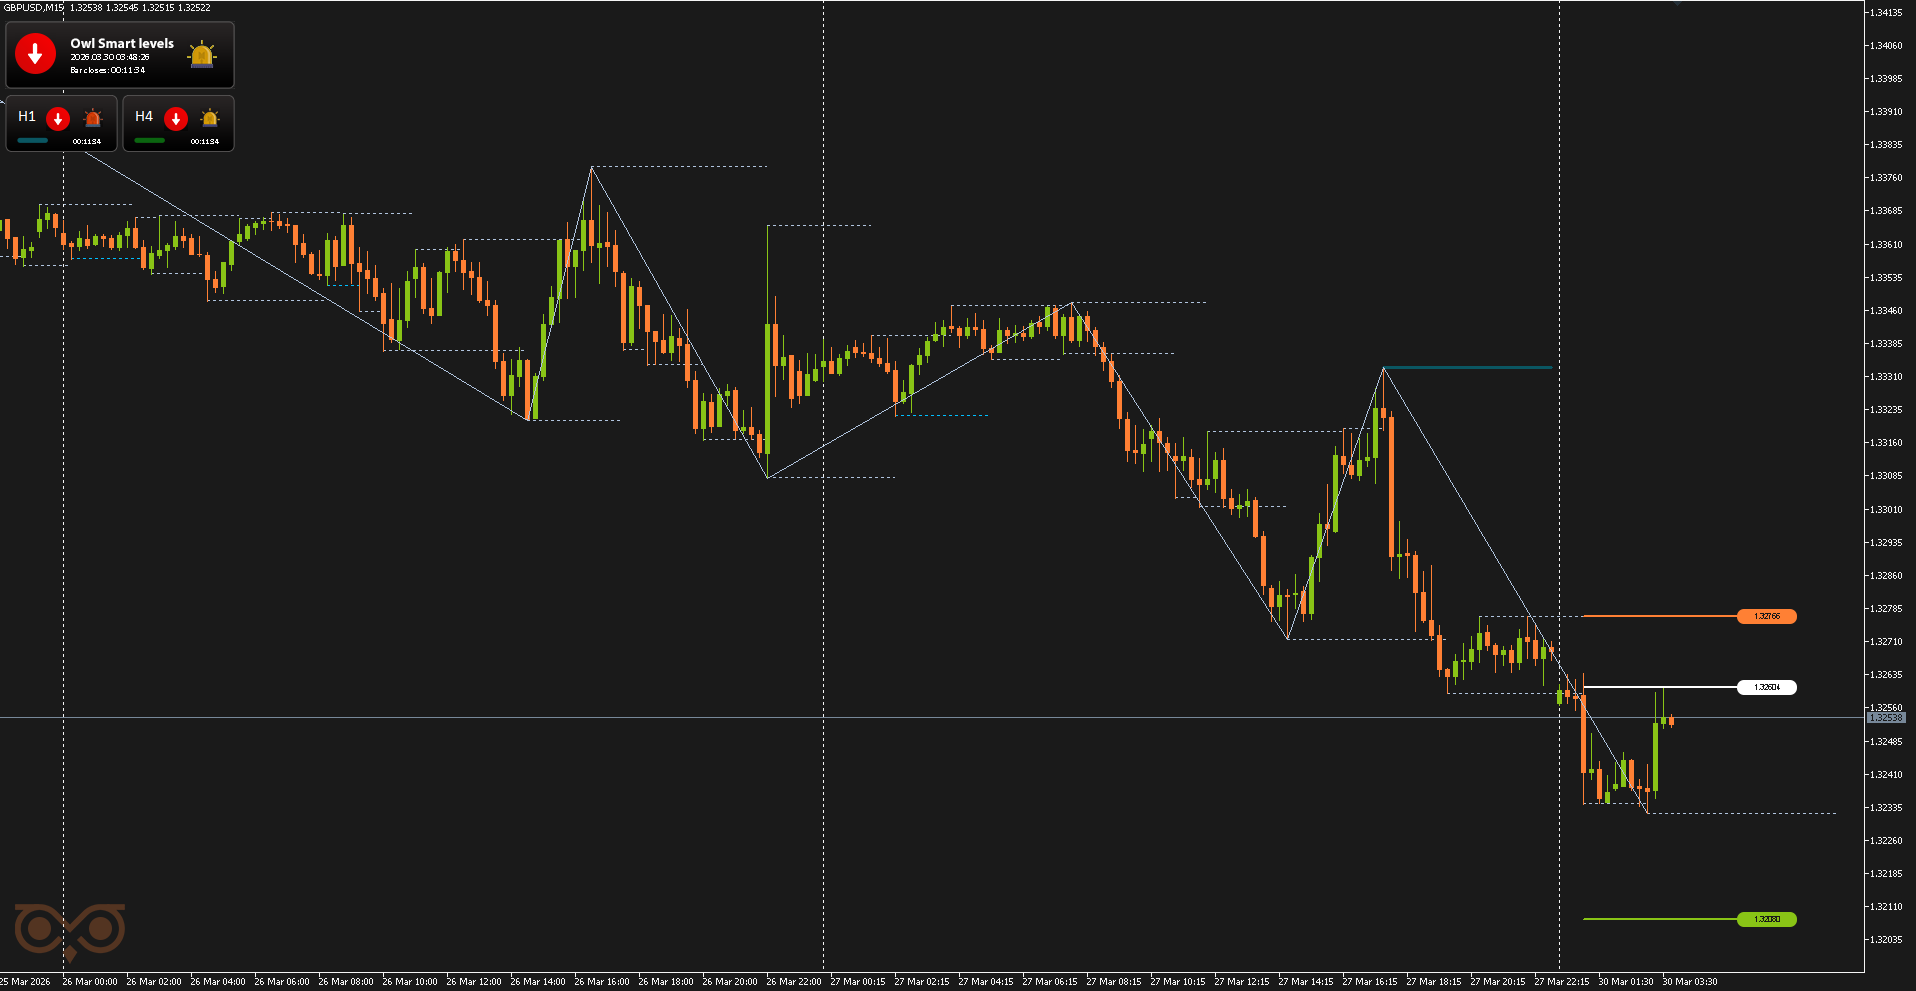
Fig. 4. Low-probability signal — extended move already completed
The second GBPUSD signal was received on March 31. The price seemed to offer a new entry point, but the signal formed after a noticeable downward move, when most of the move had already been realized. For this reason, the scenario was classified as low probability: the remaining potential was weaker, and the risk-to-reward profile worsened. As a result, it was deliberately skipped.
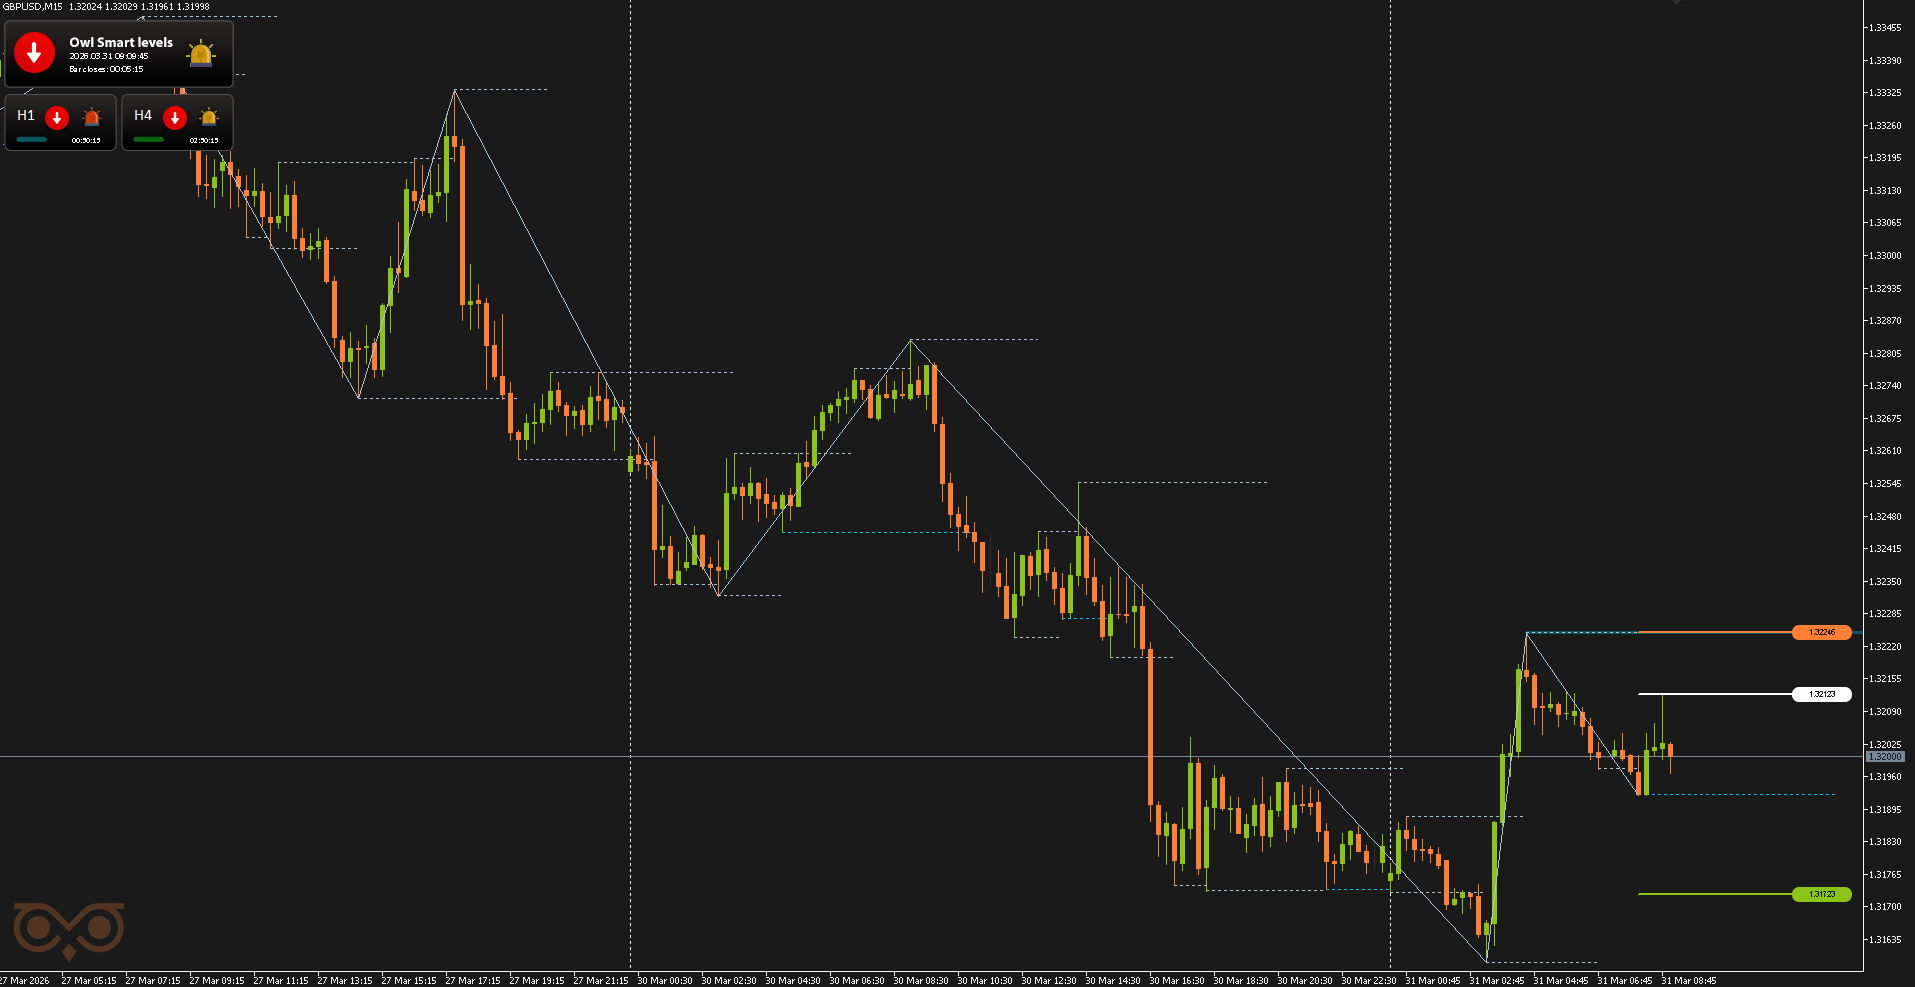
Fig. 5. Low-probability signal — extended move already completed
The third GBPUSD signal was also received on March 31 and was of higher quality. It formed after a deep correction within the main trend, providing a more logical entry point to continue the downward move.
After the signal appeared, a short trade was opened, as the setup met the system conditions. However, the price did not develop downward, and at 22:00 the trade was closed according to trade management rules. Since the price was near the entry level at the time of closing, the result was breakeven.
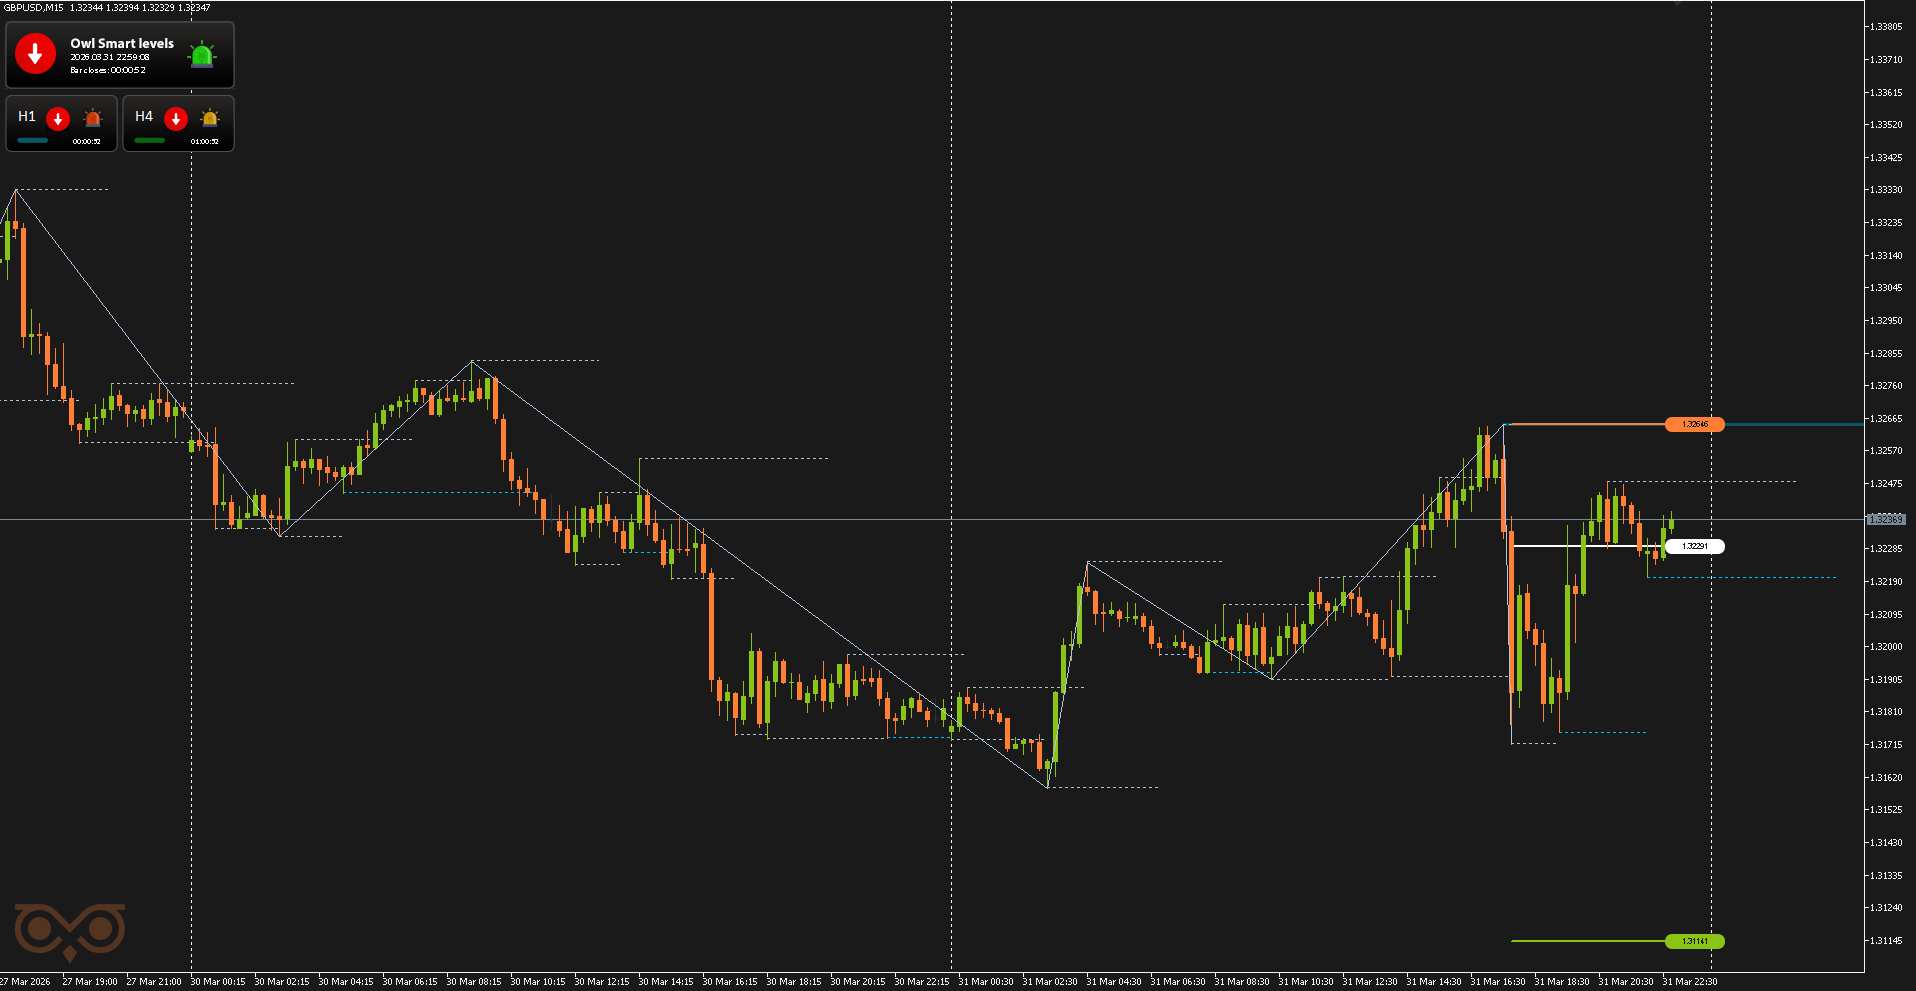
Fig. 6. GBPUSD SELL, Lot = 5.91, OpenPrice = 1.32291, StopLoss = 1.32545, TakeProfit = 1.31141, Profit = $0

Indicator Owl Smart Levels MT5 | MT4 version
The fourth GBPUSD signal was received on April 1. Despite new local highs and an indicator signal, the setup was no longer optimal for entry. It was classified as low probability, as the market had already completed the main move and further potential was limited. After such an extended upward move, the probability of continuation decreases, so the trade was deliberately skipped.
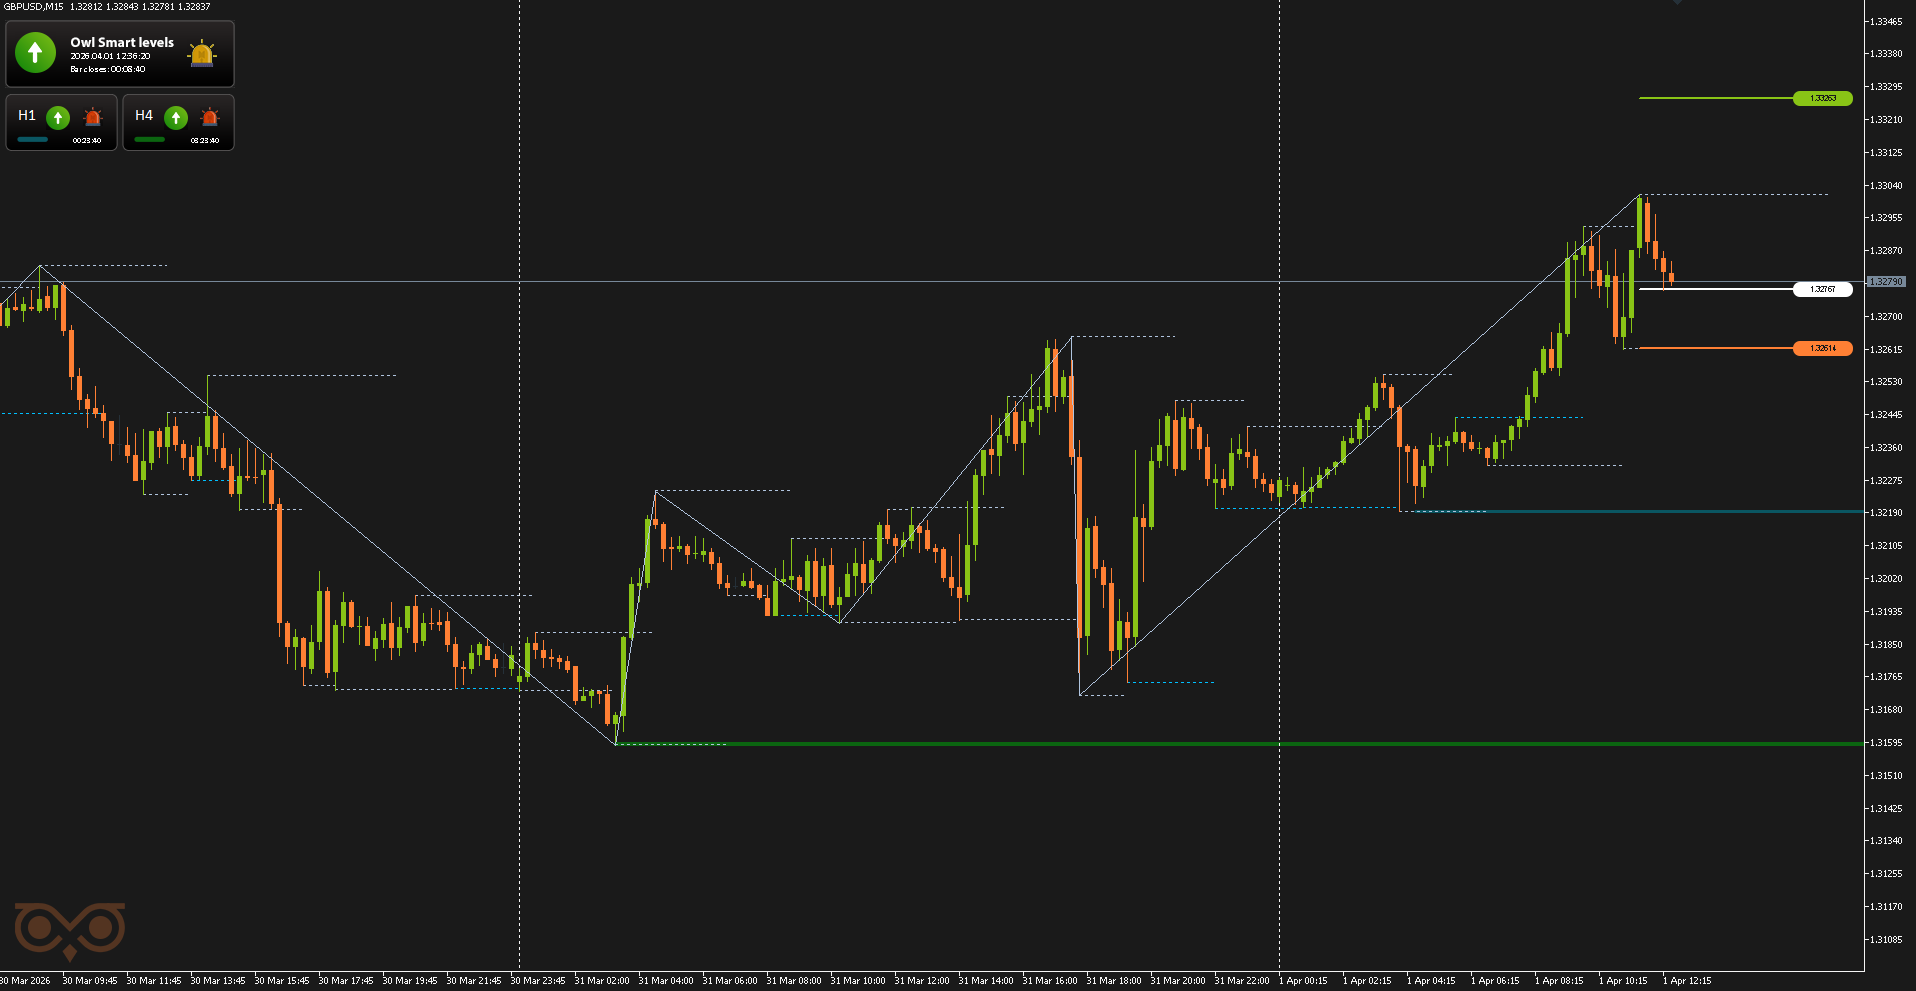
Fig. 7. Low-probability signal — extended move already completed
The fifth GBPUSD signal was also received on April 1. The formation looked less attractive for entry despite the ongoing upward move. It was again classified as low probability due to limited remaining potential. At this stage, the price is often too far from an optimal entry point, so the scenario was deliberately skipped.
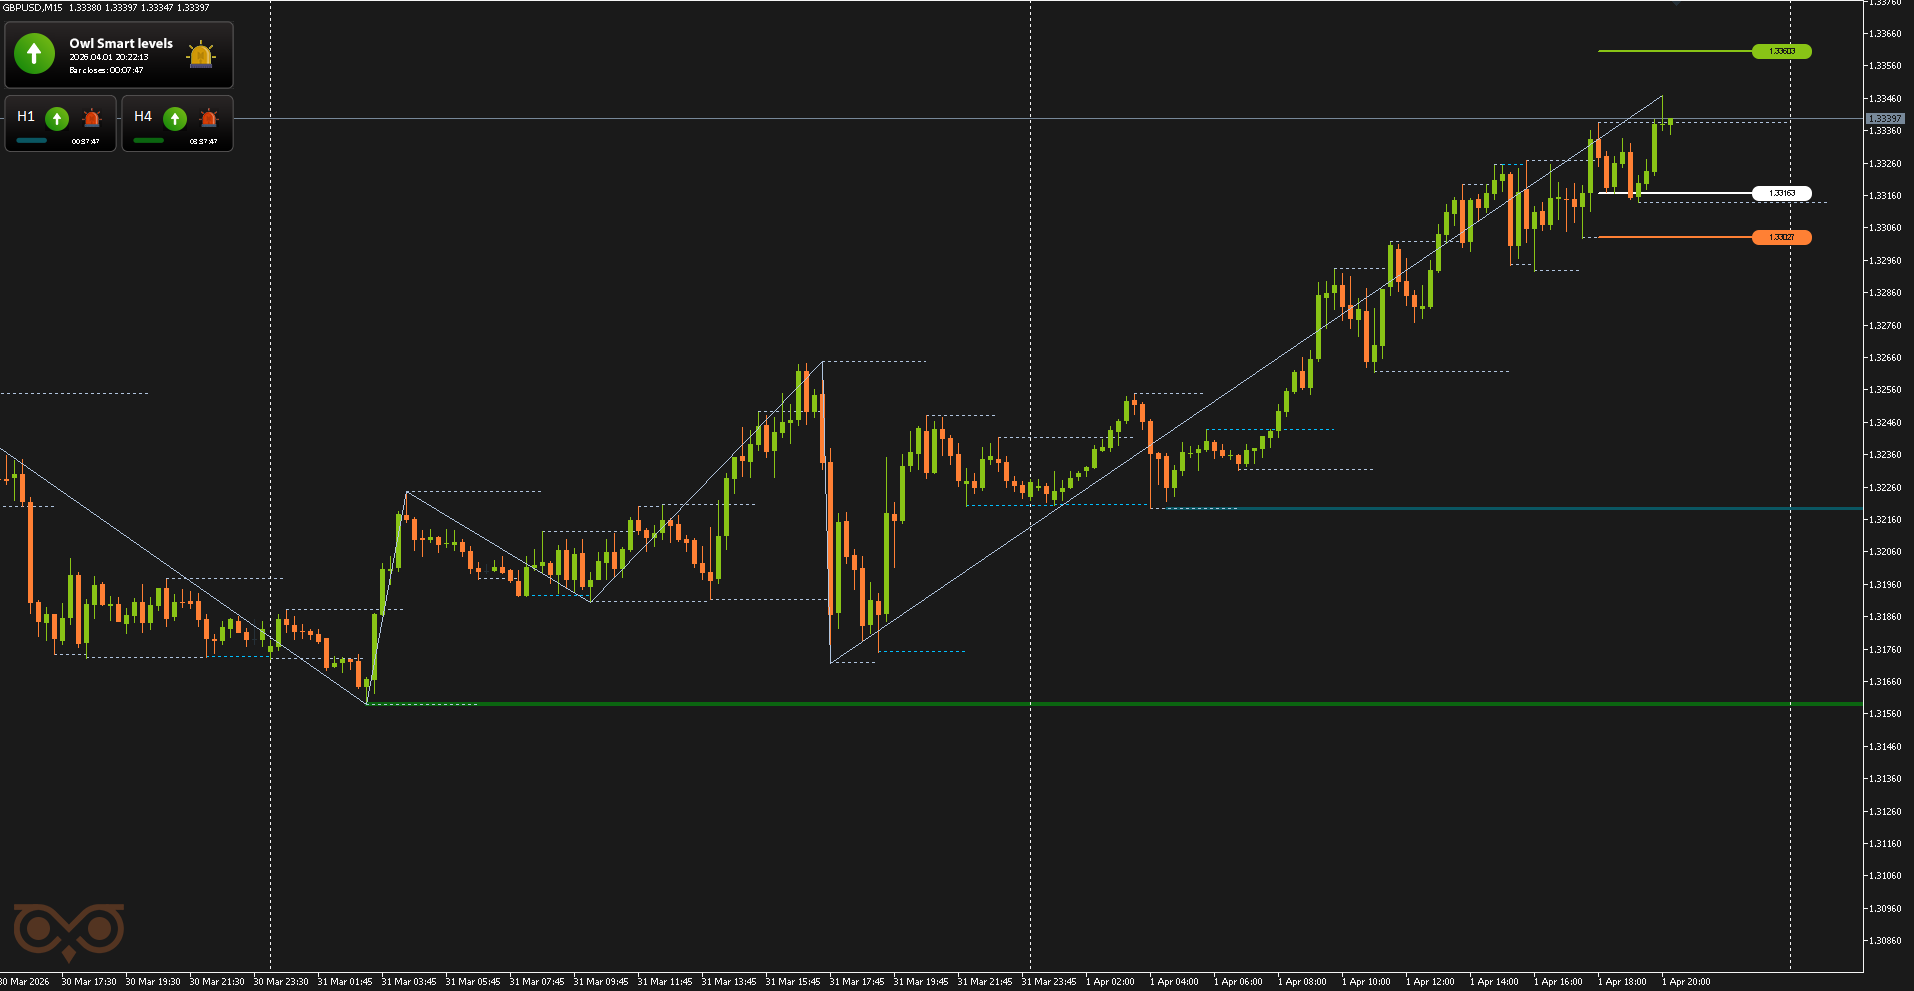
Fig. 8. Low-probability signal — extended move already completed
AUDUSD review
The first AUDUSD signal was received on March 30 and was of higher quality. The market first formed a night move, followed by a pullback where a valid signal appeared in the direction of the main momentum.
Such setups are considered stronger within the system, as they allow entries after a correction rather than at the end of an extended move, when potential still remains. After the signal, a sell trade was opened. The price did not reach TakeProfit, so the position was manually closed at 0.68480 according to the end-of-day rule.
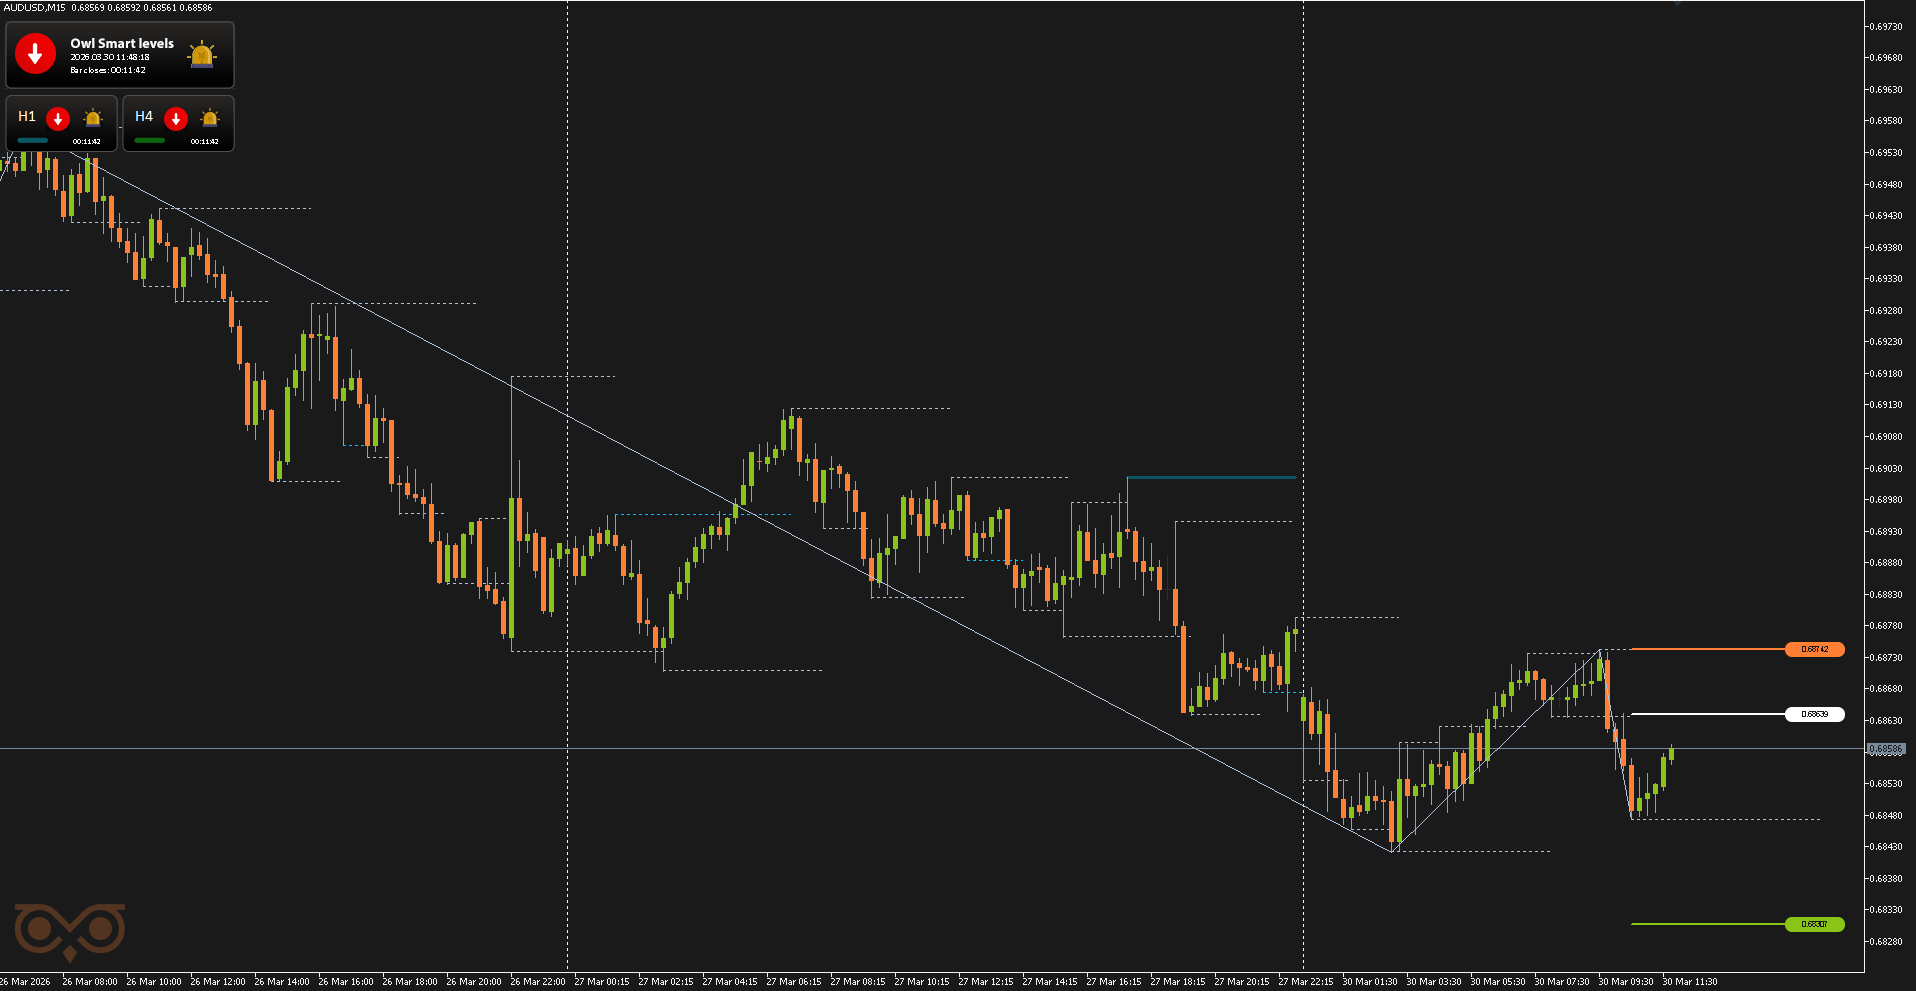
Fig. 9. AUDUSD SELL, Lot = 14.56, OpenPrice = 0.68639, StopLoss = 0.68742, TakeProfit = 0.68307, ClosePrice = 0.68480, Profit = +$2 315.04
The second AUDUSD signal was received on March 31 and was also of higher quality. The market again formed a night move followed by a pullback, where a valid signal appeared in the direction of the main impulse.
Such setups are considered strong, as they allow entries after a correction while the move still has continuation potential. A sell trade was opened, but this time the scenario did not develop, and the trade was closed by StopLoss.
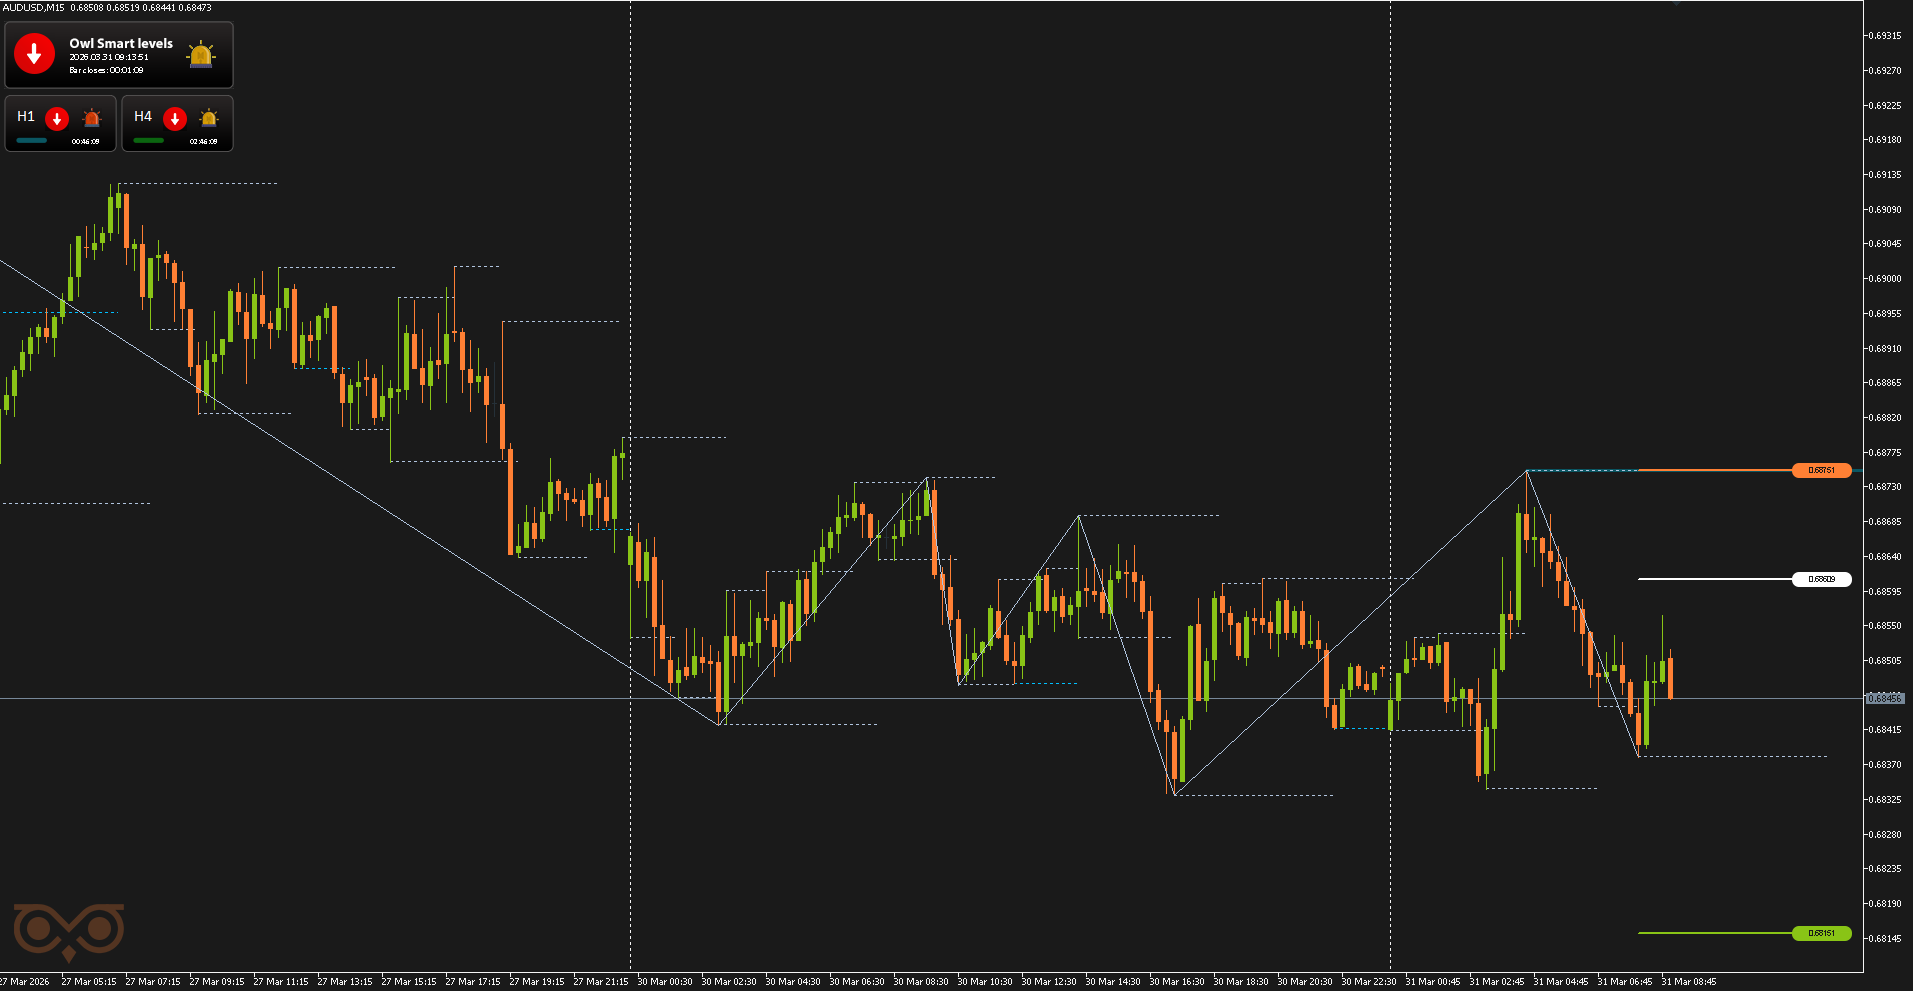
Fig. 10.AUDUSD SELL, Lot = 10.56, OpenPrice = 0.68609 StopLoss = 0.68751, TakeProfit = 0.68151, Profit = -$1 500
The third AUDUSD signal was received on April 2. Despite the indicator signal, the setup looked weaker for entry. It was classified as low probability, as the main move had already been completed and further potential was limited. After a strong downward move, the price was no longer in a strong continuation phase, so the trade was deliberately skipped.
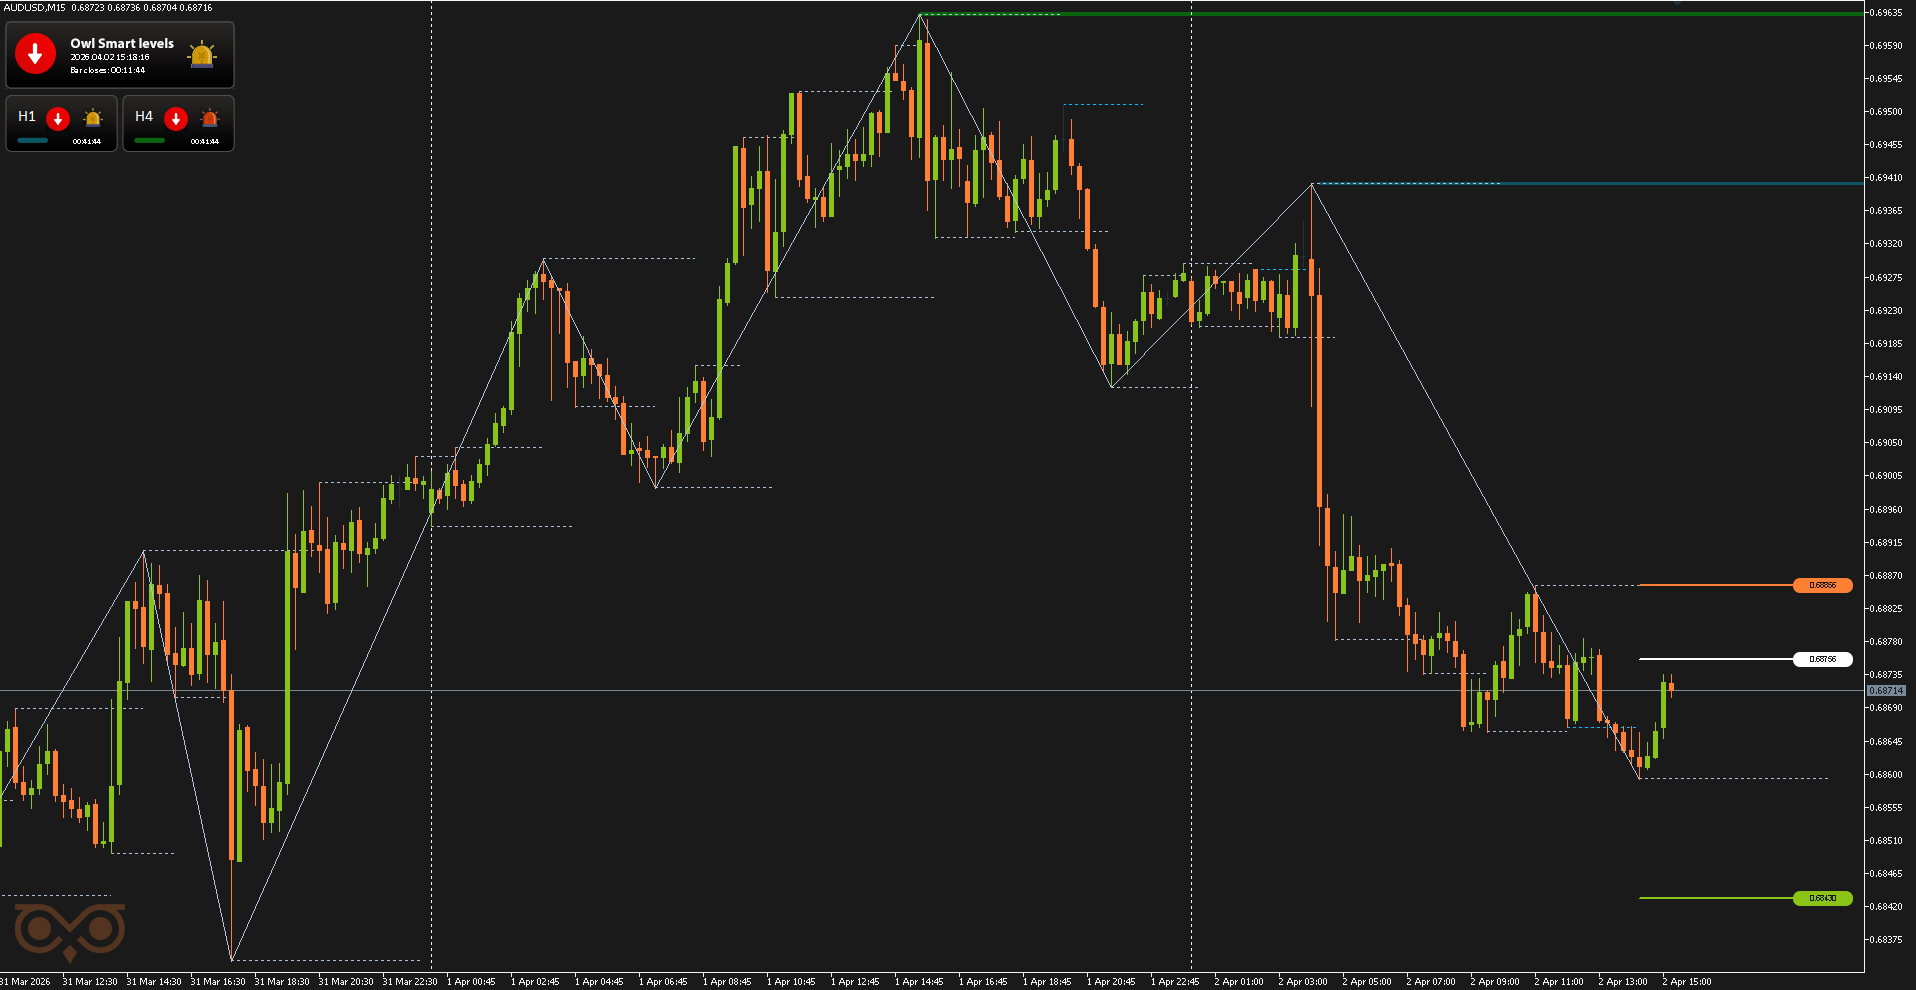
Fig. 11. Low-probability signal — extended move already completed
The fourth AUDUSD signal was received on April 3 and was of higher quality. This time, the signal formed near the H1 level, which strengthened the entry according to the system.
When a signal appears near a higher timeframe level, the market tends to react more clearly, so a sell trade was opened. This time, the move developed as expected, and the position was closed at TakeProfit.
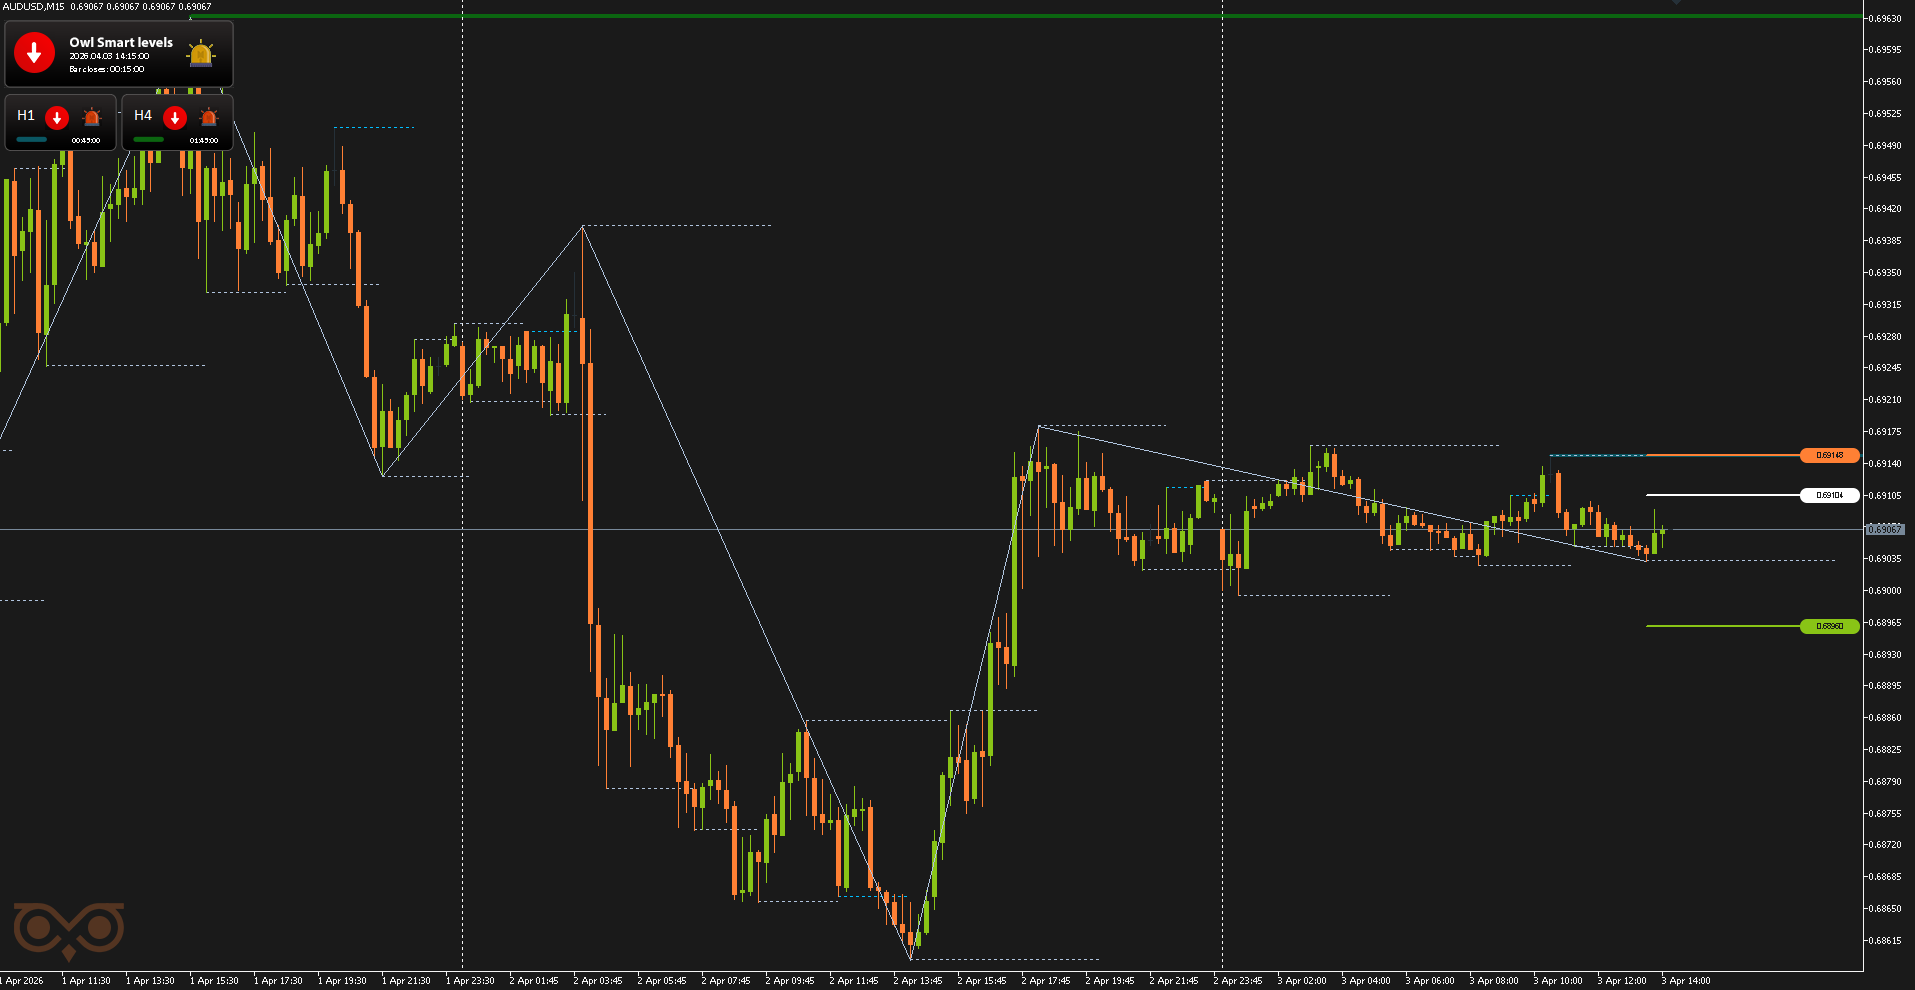
Fig. 12. AUDUSD SELL, Lot = 34.09, OpenPrice = 0.69104, StopLoss = 0.69148, TakeProfit = 0.68960, Profit = +$4 908.96
Summary:
The Forex results for the period from March 30 to April 3 once again showed that Owl Smart Levels is a complete trading system where not only the signal itself matters, but also proper filtering. That is why signals in this report were additionally divided into low- and high-probability, clearly showing which ones should be skipped and which ones are valid for trading.
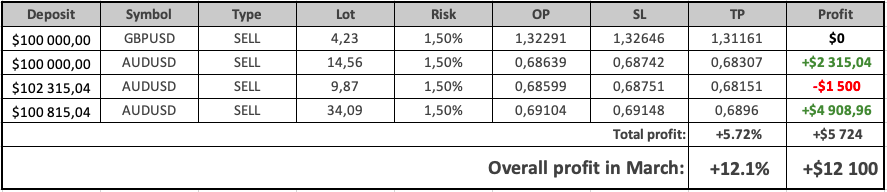
During the last trading week, 12 signals were received. Out of these, 8 were classified as low probability and were deliberately skipped according to the system rules. The remaining 4 signals were higher quality and were taken into trades.
Out of 4 trades, 2 closed in profit, 1 hit StopLoss, and 1 was closed at breakeven according to management rules. The total result was +$5 724.00.
If you want to better understand which signals are low probability and which have higher chances of success, you can read the following articles:
Detailed data for all positions and final results for each trade are shown in the summary table.

Indicator Owl Smart Levels MT5 | MT4 version
See other trading reviews using the Owl Smart Levels strategy:
I'm Sergei Ermolov, follow me and don't miss more useful tools for profitable trading on the Forex market.


 Trading Guide")

")