
Kumo Forge Pro — Adaptive Ichimoku Indicator with Confluence Scoring for MetaTrader

Introduction
The Ichimoku Kinko Hyo system is one of the most comprehensive single-indicator frameworks in technical analysis, combining trend direction, momentum, and support/resistance into a single visual overlay. Developed by Goichi Hosoda in the 1930s and published in the 1960s, it remains one of the few indicators that attempts to show the complete market picture in one chart layer. Yet most traders either abandon it after a few confusing sessions or use only the cloud for shading while ignoring the five components that make the system powerful.
The root cause is twofold. First, the standard 9/26/52 periods were calibrated for the six-day Japanese trading week of the 1960s and do not adapt to the 24-hour Forex market, the perpetual crypto market, or modern equity sessions. Second, Ichimoku produces five distinct signal types -- TK Cross, Kijun Bounce, Cloud Edge Bounce, Kumo Breakout, and Chikou Breakout -- and evaluating them in isolation leads to low-quality entries with poor win rates.
Kumo Forge Pro solves both problems. It replaces the fixed period system with an adaptive volatility engine that scales Ichimoku periods based on ATR(14) normalization, ensuring that the cloud, conversion line, and base line respond to current market conditions. It then passes every signal through a 9-factor confluence scoring system that evaluates price position, TK alignment, Chikou confirmation, cloud direction, Kumo thickness, volume participation, momentum alignment, momentum acceleration, and optional RSI filtering before printing an arrow on the chart.
Download the FREE indicator:
- MetaTrader 5: Kumo Forge PRO MT5
- MetaTrader 4: Kumo Forge PRO MT4
The non-repainting architecture ensures that every signal printed on the chart is permanent -- it evaluates conditions only on confirmed bars and never modifies or removes historical arrows. The built-in Smart TP/SL system calculates stop loss using three selectable modes (Kumo Edge, Kijun, ATR) and three take profit levels at configurable risk-reward ratios, with automatic hit detection and win rate tracking. A 22-28 row real-time dashboard displays Market Data, Ichimoku state, Signal details, Trade management, and Multi-Timeframe analysis in a persistent on-chart panel. Twenty-three alert conditions with webhook JSON support allow complete automation.
This article explains the technical concepts behind adaptive Ichimoku trading, walks through each component of the indicator, and provides a complete parameter reference for configuration across markets and timeframes.
What Is Ichimoku Cloud Trading
The Ichimoku Kinko Hyo system -- often shortened to "Ichimoku" -- translates roughly as "one-glance equilibrium chart." It was designed to give a trader everything needed to assess a market in a single view: trend direction, momentum, support, resistance, and forward-looking equilibrium zones. The system consists of five components, each serving a distinct analytical role.
Tenkan-sen (Conversion Line). Calculated as the midpoint of the highest high and lowest low over the conversion period (default 9 bars). This fastest component represents short-term equilibrium. It uses the midpoint of the range rather than the mean of closes, making it more responsive to breakouts and less sensitive to closing price noise.
Kijun-sen (Base Line). The midpoint over the base period (default 26 bars), representing medium-term equilibrium and the primary trend reference. A flat Kijun-sen indicates ranging; a rising one confirms an uptrend; a falling one confirms a downtrend. Price tends to revert toward the Kijun-sen during pullbacks, making it a natural dynamic support/resistance level. Many Ichimoku traders use it as a trailing stop loss reference.
Senkou Span A (Leading Span A). The average of Tenkan-sen and Kijun-sen, plotted 26 bars ahead. This faster cloud edge responds more quickly to price changes than Senkou Span B. When Senkou Span A is above Senkou Span B, the cloud is bullish (typically shaded green). When below, the cloud is bearish (typically shaded red).
Senkou Span B (Leading Span B). The midpoint over the Span B period (default 52 bars), plotted 26 bars ahead. This slowest component uses the longest lookback and forms the structural foundation of the cloud. The distance between Spans A and B defines cloud thickness, which serves as a proxy for trend strength and support/resistance robustness.
Chikou Span (Lagging Span). The current closing price plotted 26 bars behind. When above historical price, it confirms bullish momentum; when below, bearish. Its interaction with the cloud provides additional long-term trend confirmation.
These five components work together as a system. A "full Ichimoku signal" occurs when all five align: a TK cross in the signal direction, price on the correct side of the cloud, the cloud colored in the signal direction, and the Chikou Span confirming. This multi-dimensional confirmation is what makes Ichimoku uniquely powerful -- but it is also what makes it difficult to implement consistently without automation.
The Problem with Fixed 9/26/52 Settings
The standard Ichimoku periods -- 9 for the Tenkan-sen, 26 for the Kijun-sen, and 52 for the Senkou Span B -- were designed for the Japanese stock market in the 1960s. The six-day trading week meant 9 represented 1.5 weeks, 26 one month, and 52 two months. These were calibrated for a specific calendar structure that no longer exists.
The modern Forex market operates 24 hours a day, five days a week. The crypto market runs 24/7. US equities trade five days with extended sessions. None of these align with the six-day week that produced the original formula.
The consequences are measurable. A 9-period Tenkan-sen on M15 covers 2.25 hours -- spanning perhaps 15 pips in a quiet Asian session or 80 pips during London-New York overlap. The Tenkan treats both identically despite fundamentally different conditions. The Kijun-sen at 26 periods covers 6.5 hours on M15, roughly one day on H4, and about a month on D1. For a scalper on M5, 26 bars covers only 2 hours -- too short for meaningful equilibrium. For a position trader on D1, the same 26 bars may be appropriate for some instruments but too short for others.
The problem compounds with the cloud. Senkou Span B at 52 periods creates a forward-projected zone that may be too narrow in low-volatility environments (a thin ribbon that price passes through easily) or too wide in high-volatility environments (dominating the chart and rendering other lines invisible).
Some traders attempt to solve this by manually adjusting periods for each instrument and timeframe. Common alternatives include 7/22/44 for five-day markets, 10/30/60 for crypto, and 20/60/120 for higher timeframes. But these manual adjustments are static -- they work until volatility changes, at which point the trader must re-optimize. What is needed is a system that adjusts Ichimoku periods dynamically based on current market volatility, preserving the original ratios and relationships that Hosoda designed while scaling them to fit modern market conditions. This is precisely what the adaptive volatility engine in Kumo Forge Pro provides.
The Adaptive Volatility Engine
The adaptive engine replaces fixed periods with dynamically scaled periods based on ATR(14) normalization. The core insight is that Ichimoku periods should expand during high-volatility conditions (when bars carry more information) and contract during low-volatility conditions (when bars carry more noise). Rather than changing the fundamental Ichimoku ratios, the engine scales all periods proportionally.
The calculation proceeds in three steps.
Step 1: ATR Normalization. ATR(14) is divided by the current close price to produce a dimensionless "percentage volatility per bar" ratio. This normalization is critical because raw ATR on GBPJPY (which might read 1.50) is not comparable to ATR on EURUSD (which might read 0.0060). Dividing by price makes the reading comparable across all instruments.
Step 2: Volatility Ratio. The normalized ATR is compared to its own moving average over the Volatility Lookback period (default 50 bars). The ratio of current to average produces a scaling factor. The Adaptive Strength parameter (default 0.4) controls how aggressively periods respond: 0.0 keeps periods fixed regardless of volatility, 1.0 scales fully with the ratio, and 0.4 provides moderate adaptation that smooths noise while responding to genuine regime changes.
Step 3: Period Scaling. Each base period is multiplied by the adjusted volatility factor. The Conversion Period (base 9) might scale to 7 during low-volatility consolidation and to 12 during a high-volatility breakout. If the conversion period contracts by 22%, all other periods contract proportionally, preserving Hosoda ratios. Results are rounded to integers with a minimum of 2.
Two operating modes are available:
Adaptive Mode (default). Periods adjust on every bar based on ATR normalization. The cloud, Tenkan, Kijun, and displacement all breathe with volatility. Recommended for traders working across multiple instruments and timeframes.
Classic Mode. Periods remain fixed at base values (9/26/52/26). Reproduces traditional Ichimoku and is useful for traders with pre-optimized period sets or for comparison against the adaptive engine.
The practical effect is most visible during volatility transitions. When a market breaks out of consolidation, fixed periods produce a cloud calibrated for the quiet phase -- too narrow for the breakout. The adaptive engine expands periods as ATR rises, producing a thicker cloud with meaningful support/resistance. Conversely, when volatility contracts, the engine tightens the cloud to match the new regime, making Tenkan-Kijun interactions more responsive.
The 5 Signal Types
Kumo Forge Pro detects five distinct Ichimoku signal types, each representing a different market condition and entry opportunity. All signals are evaluated only on confirmed (closed) bars to ensure non-repainting integrity. Every signal must also pass the confluence scoring system before appearing on the chart.
Signal Type 1: TK Cross (Tenkan-Kijun Cross). The classic Ichimoku entry signal. A bullish TK Cross occurs when Tenkan crosses above Kijun, indicating short-term momentum has shifted above medium-term equilibrium. A bearish TK Cross occurs when Tenkan crosses below Kijun. The significance depends on position relative to the cloud: a cross above the cloud is "strong," inside is "neutral," below is "weak." This positional context is captured by the confluence scoring system. Always enabled.
Signal Type 2: Kijun Bounce (KB). Price pulls back to the Kijun-sen during a trend and bounces in the trend direction. In an uptrend, price dips to or slightly below the Kijun-sen and the next confirmed bar closes above it. Kijun Bounce signals are particularly valuable because they offer low-risk entries during established trends -- the stop loss can be placed just beyond the Kijun-sen, resulting in tight stops relative to potential reward. Enabled by default (KijunBounce = true).
Signal Type 3: Cloud Edge Bounce (CB). Price approaches the near edge of the Kumo (Senkou Span A in a bullish cloud, Senkou Span B in a bearish cloud) and reverses. In an uptrend with a bullish cloud, price may pull back to the upper cloud edge and bounce higher. Cloud Edge Bounce signals represent tests of the Kumo as support/resistance -- the strongest structural element of the Ichimoku system. A bounce off its edge confirms the cloud is functioning as intended. Enabled by default (CloudBounce = true).
Signal Type 4: Kumo Breakout (BK). Price closes decisively above or below the cloud after having been on the opposite side or inside it. The breakout is validated against a volume multiplier threshold (BreakVolMult = 1.3 by default) to confirm genuine market participation. An optional retest filter (ShowRetest = true) looks for post-breakout pullbacks to the cloud edge, which are often higher-probability entries than the initial breakout. Enabled by default (ShowBreakout = true).
Signal Type 5: Chikou Breakout (CK). The Chikou Span crosses above or below the historical price from 26 bars ago. A bullish Chikou Breakout means the current price has exceeded the price from that period, confirming positive momentum over the lookback window. Slower to trigger than TK Crosses but provides stronger trend confirmation. Disabled by default (ChikouBreak = false) because it generates fewer signals and is typically used as a confirmation layer.
Each signal type can be independently enabled or disabled. Traders preferring trend-continuation entries can enable only KB and CB. Those preferring breakouts can enable BK and CK. When multiple signal types fire on the same bar, the highest-priority signal displays (TK Cross > BK > KB > CB > CK).
The 9-Factor Confluence Scoring System
A raw Ichimoku signal -- a TK Cross, a Kijun Bounce, or a Kumo Breakout -- provides directional information but does not measure setup quality. A TK Cross during a thin cloud in a range is fundamentally different from one above a thick cloud with strong momentum and high volume. The confluence scoring system quantifies this difference.
Nine independent factors evaluate the market context surrounding every signal. Each contributes specific points to a total possible score of 110. The percentage of maximum determines the signal's grade.
Factor 1: Price vs Cloud (20 points). Where price sits relative to the Kumo. For buy signals, price above cloud earns full 20 points; inside earns partial; below earns zero. Most heavily weighted because the Kumo is the dominant structural element, and trading with the cloud's direction has a significantly higher success rate.
Factor 2: TK Alignment (15 points). Whether Tenkan is correctly positioned relative to Kijun for the signal direction. Tenkan above Kijun earns full points for buy signals; below earns zero. Captures the momentum dimension of the system.
Factor 3: Chikou Confirmation (15 points). Whether the Chikou Span confirms the signal direction relative to historical price from 26 bars ago. Provides a unique backward-looking confirmation no other component offers.
Factor 4: Cloud Direction (10 points). Whether the cloud itself is trending in the signal direction. A bullish (green) cloud supports buy signals; a bearish (red) cloud supports sell signals.
Factor 5: Kumo Thickness (8 points). Thick clouds indicate strong support/resistance and well-established trends. Thin clouds indicate weak structure and transitional markets. Points assigned based on relative thickness compared to recent history.
Factor 6: Volume Participation (10 points). Whether current volume exceeds the recent average, indicating broad market participation. Above-average volume supports validity; below-average suggests the move may lack institutional commitment.
Factor 7: Momentum Alignment (12 points). The Momentum Pulse Engine reading must be positive for buy signals and negative for sell signals. A strong reading in the signal direction earns full points; a weak or contrary reading earns partial or zero.
Factor 8: Momentum Acceleration (10 points). Whether momentum is accelerating in the signal direction. Measured as the rate of change of the Momentum Pulse reading. Increasing momentum supports the signal; decreasing suggests the move may be losing steam.
Factor 9: RSI Filter (10 points, optional). When enabled (RSIFilter = true, disabled by default), checks whether RSI supports the signal direction without being at an extreme. For buy signals, RSI should be above 50 but below overbought. Adds a momentum oscillator dimension to the trend-focused Ichimoku system.
The total possible score is 110 with all factors enabled (100 without RSI). The percentage maps to a grade:
- Strong: 80% or higher. All or nearly all factors confirm. Highest-conviction setups.
- Standard: 50% to 79%. A majority confirm but some headwinds exist. Acceptable entries with normal risk.
- Weak: Below 50%. Fewer than half the factors confirm. Treat with caution or skip.
The MinScore input (default 40) sets the minimum percentage for a signal to appear on the chart. Raising MinScore to 60 or 70 produces fewer but higher-quality signals. Lowering it to 20 or 30 allows more signals at the cost of lower average quality. The grade and score display on every signal label and in the dashboard.
The Momentum Pulse Engine
While the Ichimoku cloud system excels at identifying trend direction and equilibrium, it provides limited information about momentum intensity and acceleration. The Momentum Pulse Engine fills this gap by synthesizing three components into a single normalized reading from -100 to +100.
Component 1: TK Spread. The distance between Tenkan and Kijun normalized by ATR to produce a dimensionless ratio. When Tenkan is far above Kijun, the spread is strongly positive, indicating aggressive bullish momentum. The ATR normalization ensures comparability across instruments with different price scales.
Component 2: Acceleration. The rate of change of TK Spread. A positive and rising TK Spread (positive acceleration) indicates intensifying buying pressure. A positive but falling TK Spread (negative acceleration) suggests the trend is slowing and a reversal or consolidation may be approaching.
Component 3: Cloud Slope. The normalized slope of Senkou Span A provides a structural anchor that prevents the pulse from oscillating too rapidly during minor pullbacks. A rising cloud slope confirms upward trend projection; falling confirms downward.
These three components are combined with equal weighting and smoothed through EMA(5). The resulting reading ranges:
- +50 to +100: Strong bullish momentum. Strongly favors buy signals.
- +10 to +50: Moderate bullish momentum. Buy signals valid with normal conviction.
- -10 to +10: Neutral zone. Momentum is indeterminate. Signals carry above-average risk.
- -10 to -50: Moderate bearish momentum. Sell signals valid with normal conviction.
- -50 to -100: Strong bearish momentum. Strongly favors sell signals.
The Momentum Pulse feeds into confluence Factors 7 (Momentum Alignment) and 8 (Momentum Acceleration), contributing up to 22 additional points for signals during strong, accelerating momentum. This ensures the confluence score reflects not just the structural setup but also the dynamic momentum environment. The dashboard displays the current value, state label (Strong Bullish, Moderate Bullish, Neutral, Moderate Bearish, Strong Bearish), and a visual bar.
Smart TP/SL System
Every signal generated by Kumo Forge Pro includes a complete risk management framework with a configurable stop loss and three take profit levels. Unlike simple ATR-based systems, the Smart TP/SL system offers three distinct stop loss modes, each leveraging different aspects of the Ichimoku structure.
SL Mode 1: Kumo Edge (default). The stop loss is placed at the opposite edge of the cloud from the signal direction. For a buy signal, the stop is at the lower Kumo edge beneath price; for a sell, at the upper edge. This uses the cloud itself as a structural risk boundary. The advantage is genuine structural significance; the disadvantage is that distance varies with cloud thickness.
SL Mode 2: Kijun. The stop is placed at the Kijun-sen level. This produces more consistent distances than Kumo Edge because the Kijun-sen moves more gradually. Particularly effective for Kijun Bounce signals, where the entry occurs near the Kijun-sen and the stop can be placed a small distance beyond it.
SL Mode 3: ATR. The stop is placed at a fixed ATR(14) multiple from entry (SLAtrMult = 0.5 default). For a buy: entry - (ATR * SLAtrMult) . This ignores Ichimoku structure entirely, producing the most consistent distances across all conditions. The 0.5x multiplier produces a relatively tight stop; traders preferring wider stops can increase to 1.0 or 1.5.
Three take profit levels are calculated as fixed risk-reward ratios relative to the stop loss distance:
- TP1 at 1.5x risk-reward (default) -- the first target is 1.5 times the SL distance from entry.
- TP2 at 2.5x risk-reward (default) -- the second target is 2.5 times the SL distance.
- TP3 at 4.0x risk-reward (default) -- the third target is 4.0 times the SL distance.
The indicator automatically tracks whether each level has been reached by monitoring price on every tick. When price touches TP1, TP2, or TP3, the dashboard marks that level as hit with a checkmark. If the stop loss is hit, the trade is marked as closed with a loss. A running win rate (percentage of trades reaching at least TP1 before SL) accumulates across all signals on the current chart.
The multi-target approach supports partial position management: close one-third at TP1 (1.5R), move stop to breakeven, close another third at TP2 (2.5R), and let the final third run to TP3 (4.0R). The blended return on a fully successful three-part trade is approximately 2.67R against 1.0R risk. The TP/SL system can be hidden entirely (ShowTPSL = false) for traders who use external risk management.
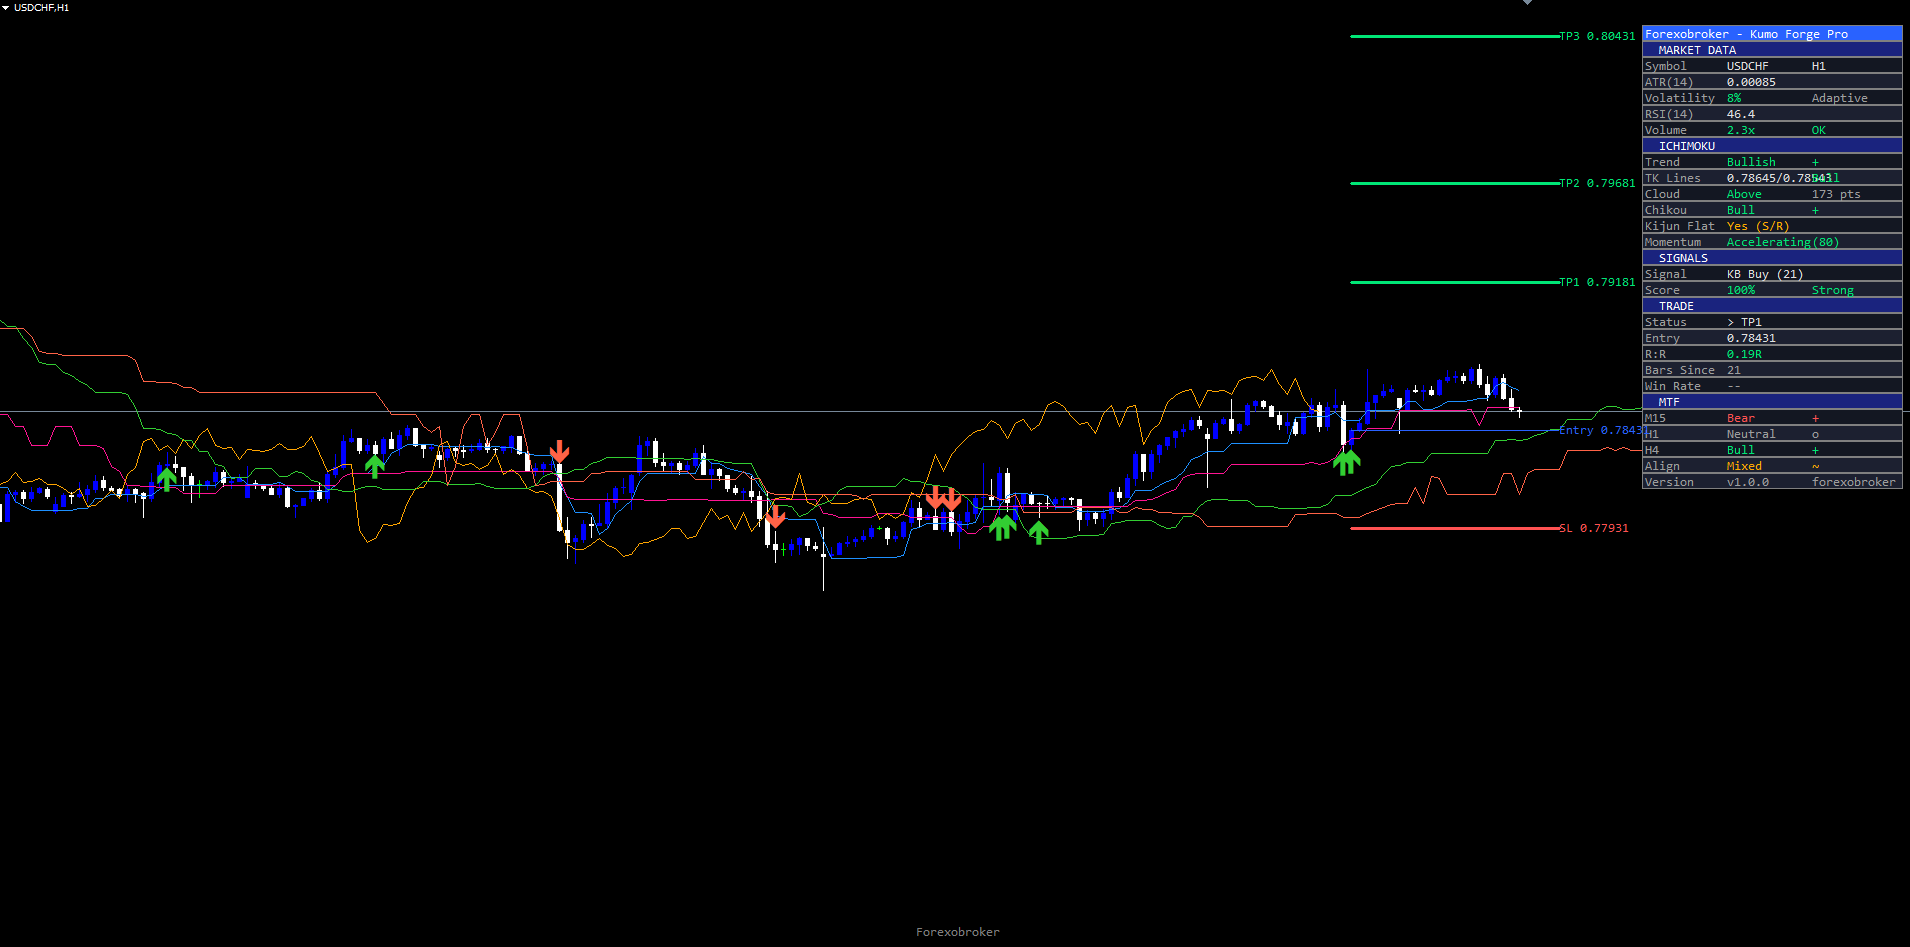
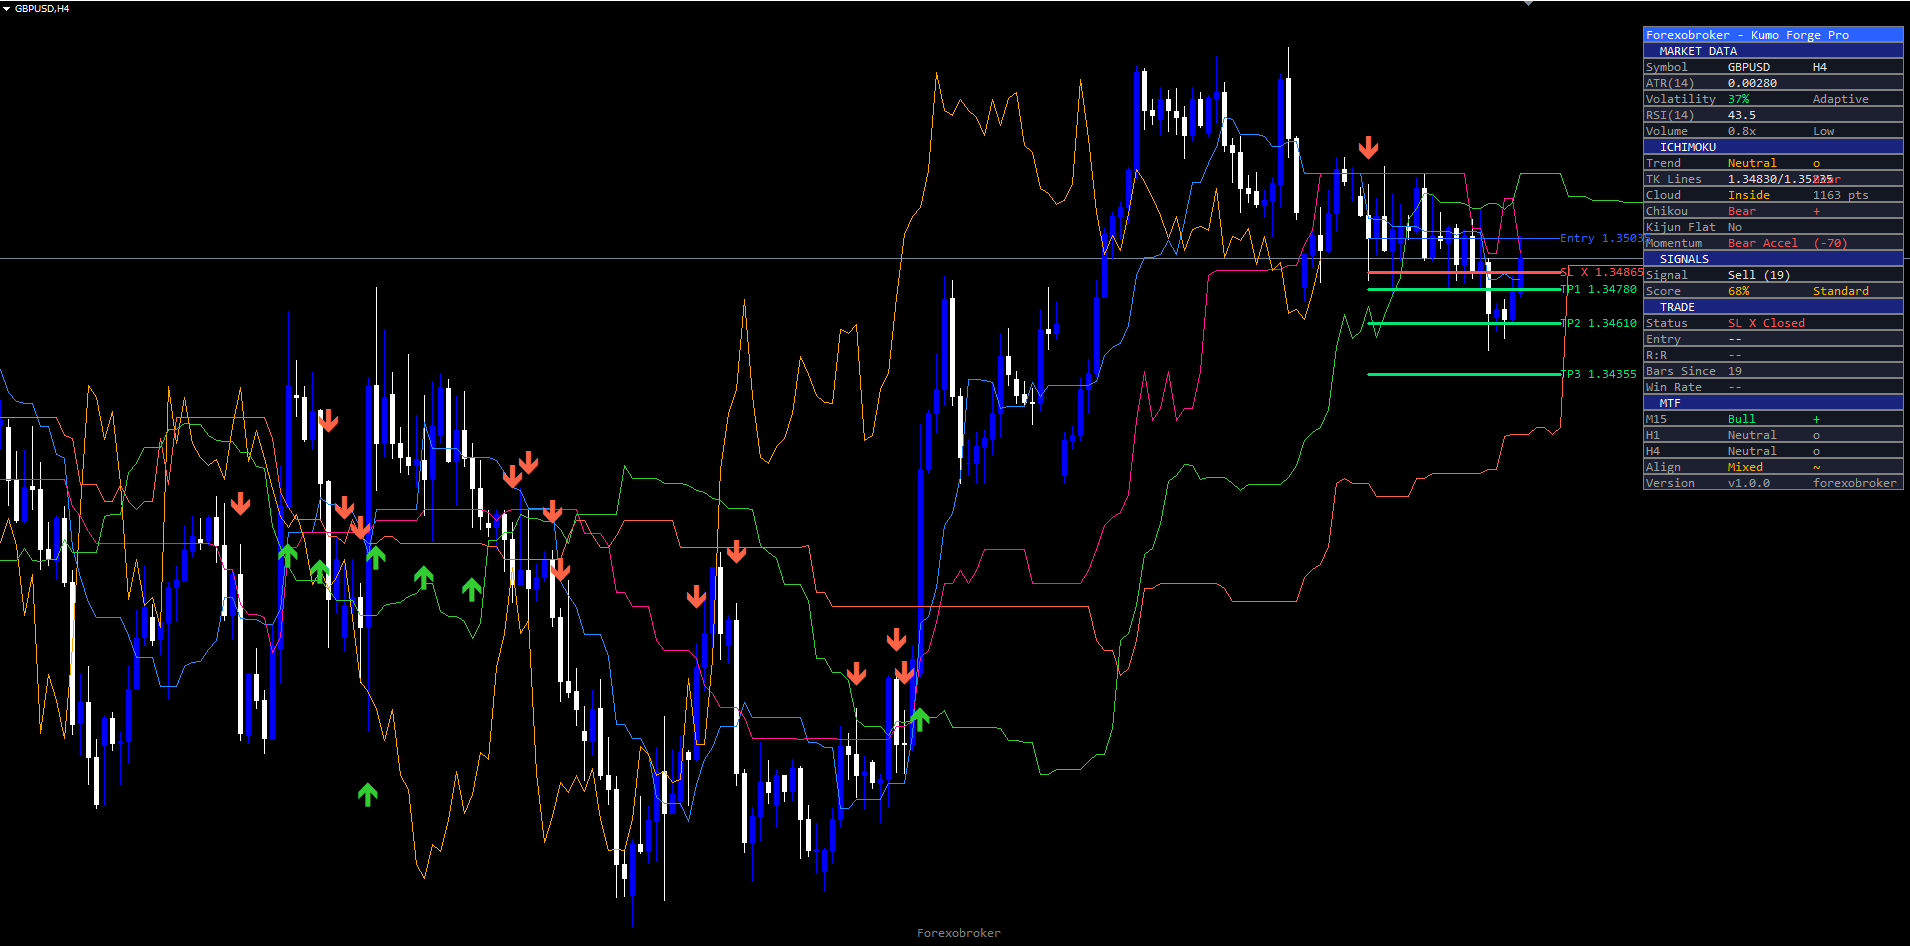
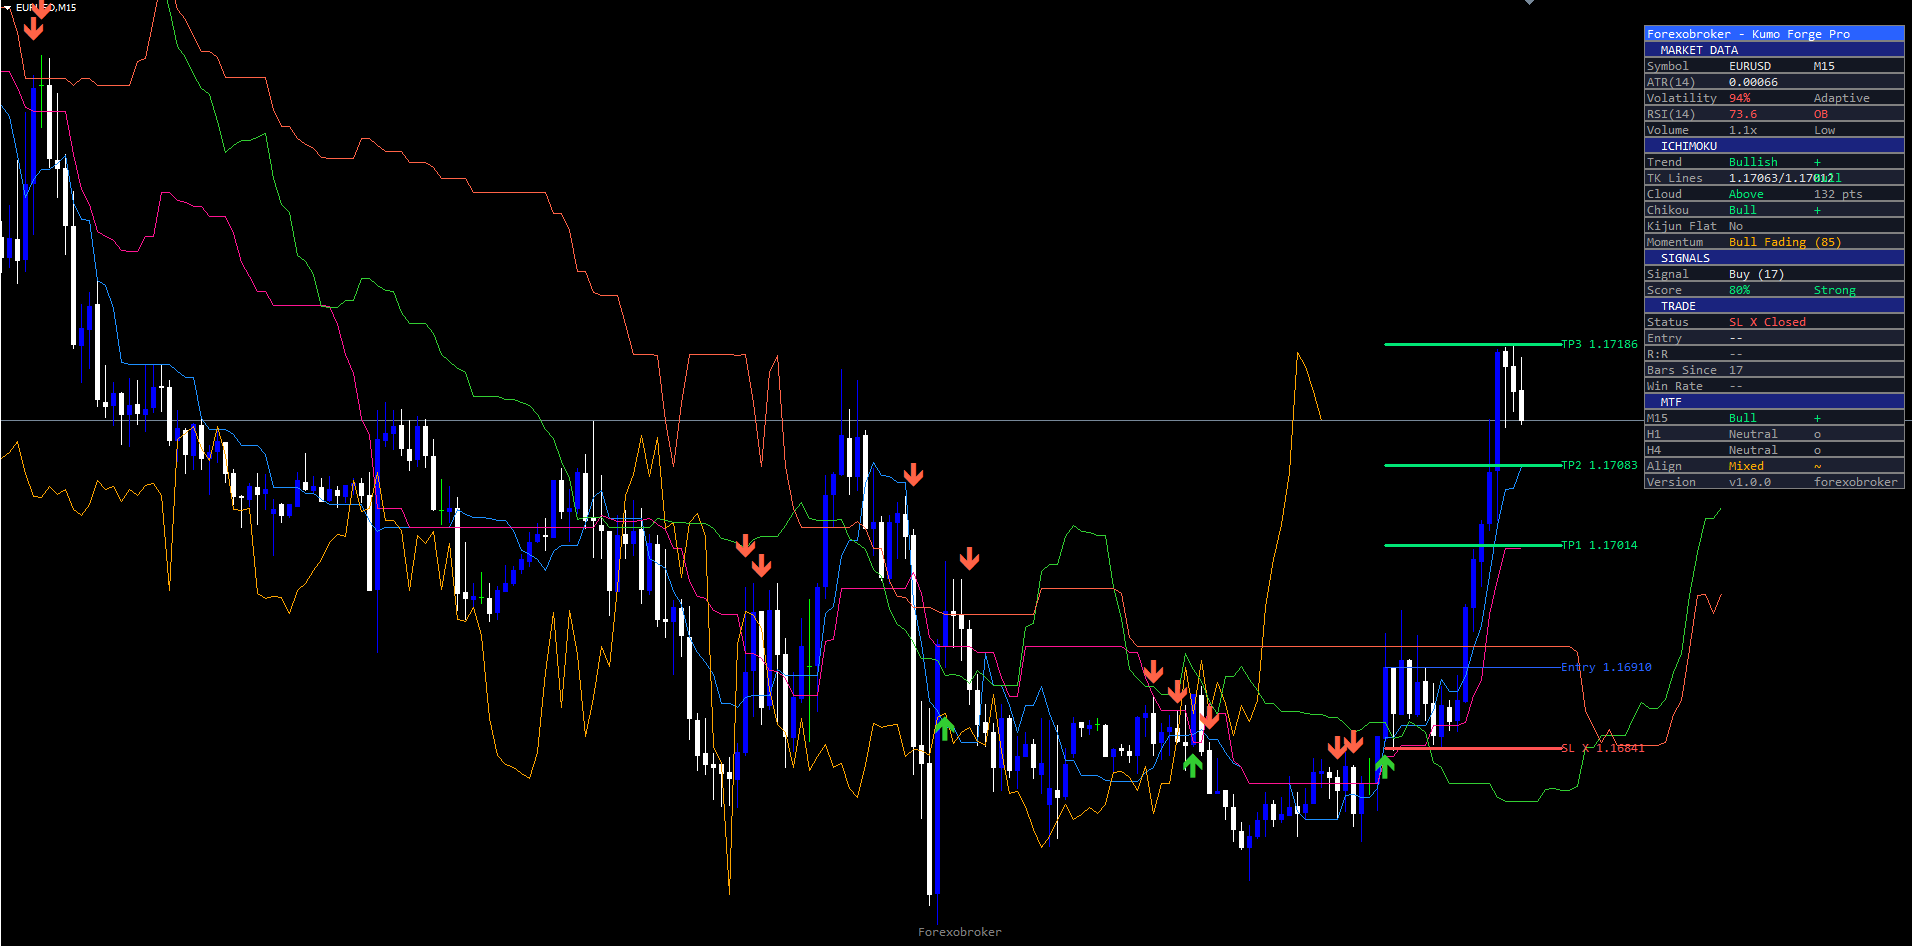
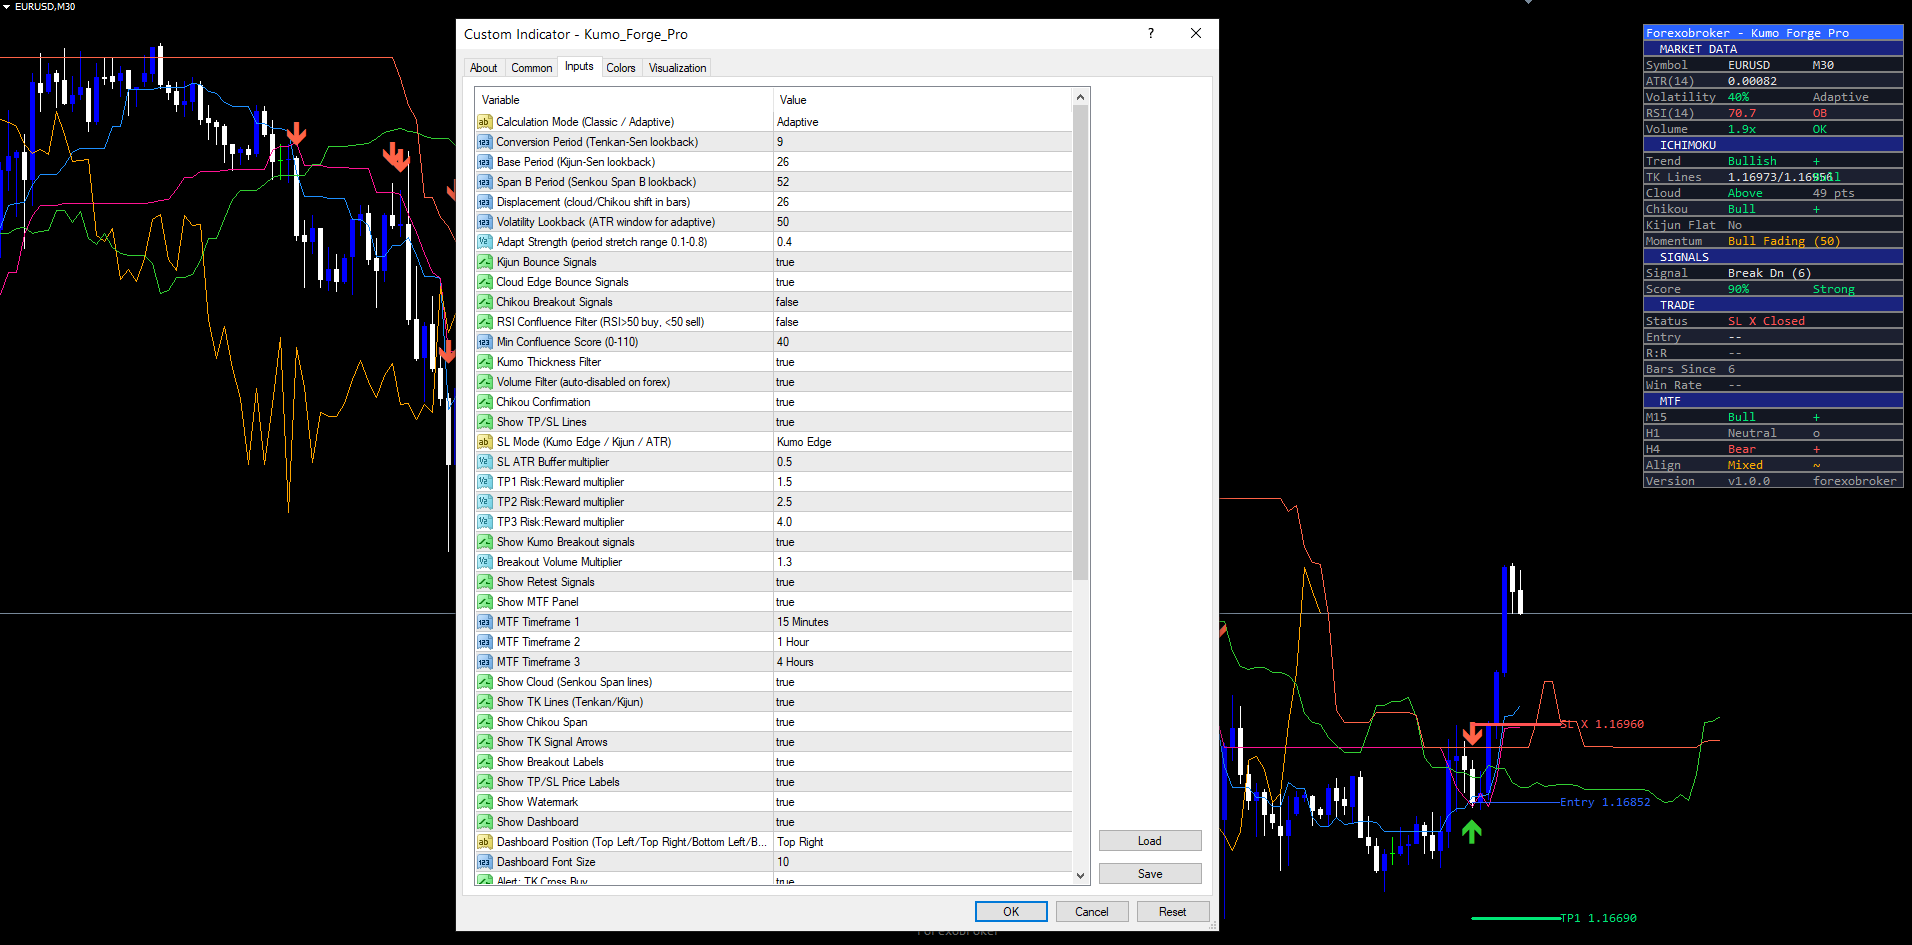
The Real-Time Dashboard
The dashboard is a persistent panel displayed in the top-right corner of the chart by default (Position = "Top Right"). It provides a comprehensive overview of Ichimoku state, signal conditions, trade management, and multi-timeframe analysis in a structured, color-coded format. Depending on enabled features, the dashboard displays 22 to 28 rows organized into five sections.
Section 1: Market Data. Symbol name, current timeframe, bid/ask prices, spread, ATR(14) value, and current bar volume relative to its moving average.
Section 2: Ichimoku State. Tenkan-sen and Kijun-sen values with their relationship (above/below), Senkou Span A and B values, cloud direction (bullish/bearish), cloud thickness (thin/medium/thick), Chikou Span position relative to historical price, and operating mode (Adaptive or Classic). In Adaptive mode, dynamically scaled period values are shown alongside base periods (e.g., "Conv Period: 9 -> 7").
Section 3: Signal Information. Signal type (TK Cross, KB, CB, BK, or CK), direction (Long/Short/Waiting), confluence score (raw points and percentage), grade (Strong/Standard/Weak), Momentum Pulse value and state, and individual factor scores.
Section 4: Trade Management. Entry price, stop loss price with active SL mode label, TP1/TP2/TP3 prices with their R:R ratios, hit tracking checkmarks, and cumulative win rate. TP values color-coded green, SL in red.
Section 5: Multi-Timeframe (MTF) Panel. When enabled (ShowMTF = true), displays cloud direction, TK alignment, most recent signal, and Momentum Pulse state from three configurable timeframes (default M15, H1, H4). A signal on M15 aligned with bullish conditions on H1 and H4 carries significantly more conviction than one contradicting higher timeframes.
The dashboard dynamically adjusts row count based on enabled features. Disabling the MTF panel removes approximately 6 rows; disabling the RSI filter removes its row. This prevents wasted chart space from empty or irrelevant rows. All objects are anchored to CORNER_LEFT_UPPER with absolute pixel coordinates computed from chart width and height, avoiding the common MetaTrader pitfall where objects anchored to other corners extend off-screen. The Position input lets traders choose Top Right, Top Left, Bottom Right, or Bottom Left placement. The font size can be set to Normal or smaller for traders who want to minimize the dashboard footprint.
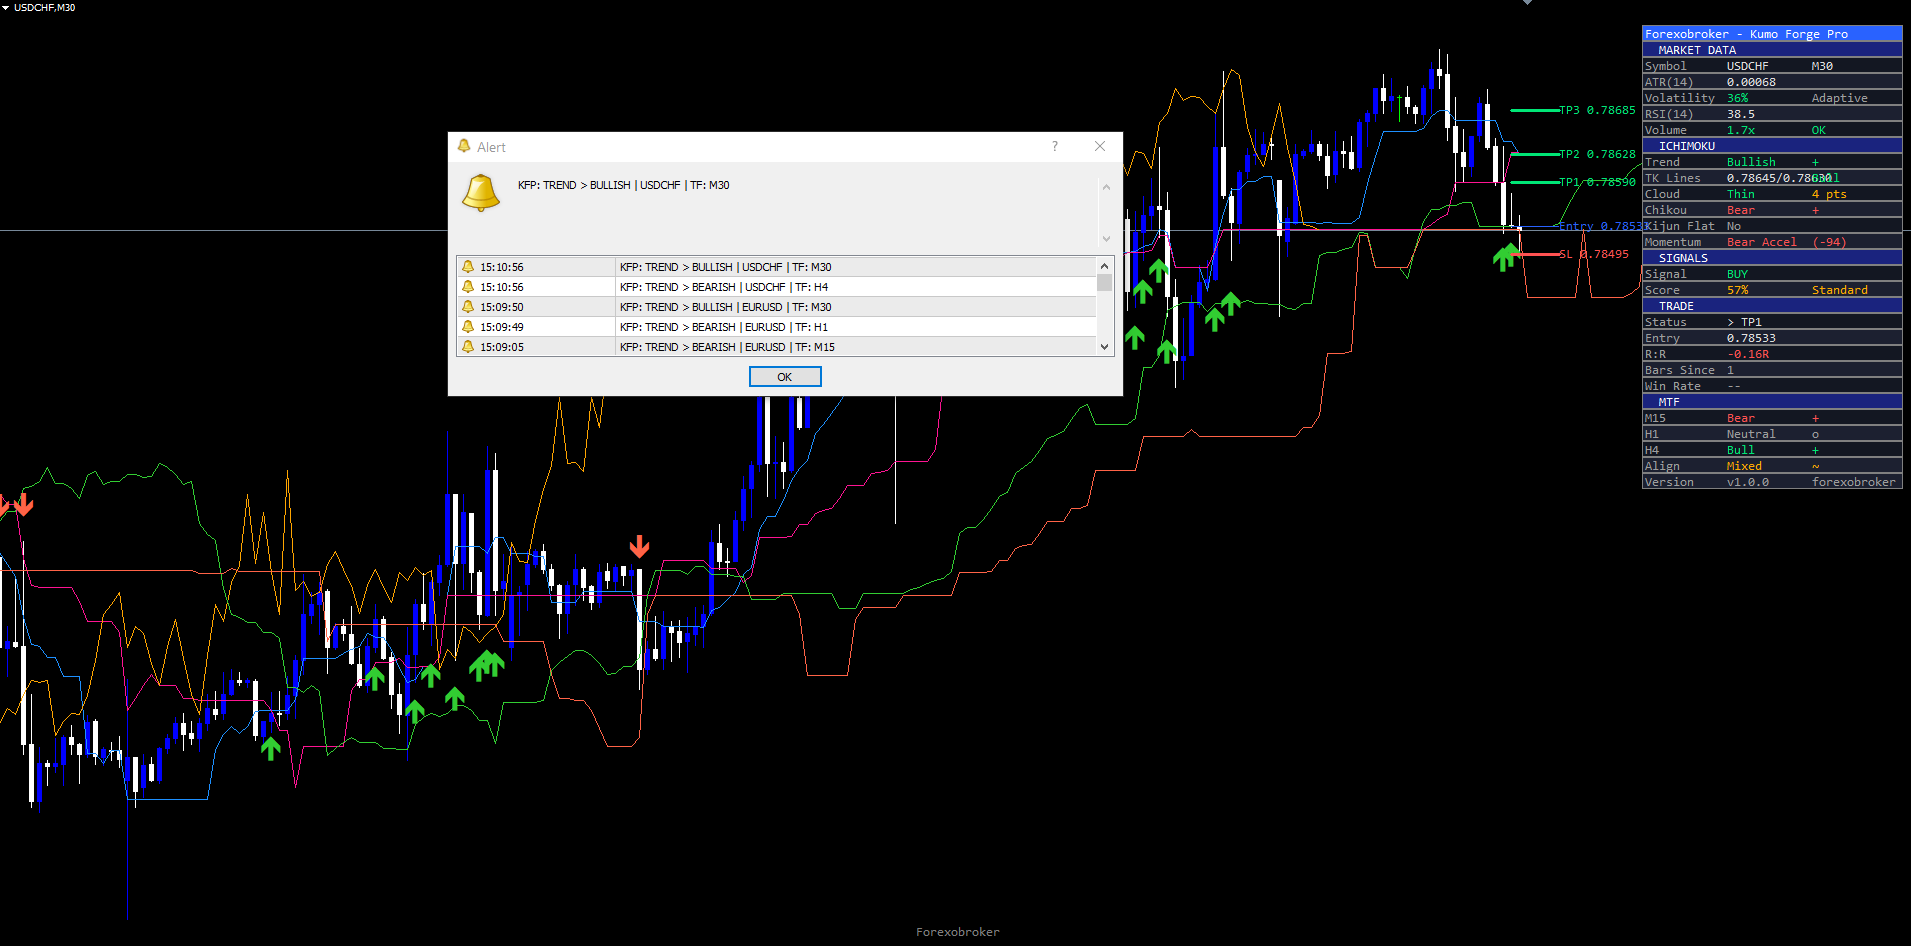
The Alert System
Kumo Forge Pro supports twenty-three distinct alert conditions organized across signal, trade management, and system events. Each alert supports four delivery channels and optional webhook JSON output for integration with external trading systems.
Signal Alerts (10 conditions). Each of the five signal types (TK Cross, Kijun Bounce, Cloud Edge Bounce, Kumo Breakout, Chikou Breakout) has both a buy and sell variant. Each alert includes signal type, direction, confluence score, grade, entry price, stop loss, and all three take profit levels.
Trade Management Alerts (8 conditions). TP1 Hit, TP2 Hit, TP3 Hit, and SL Hit each have separate alerts. These fire when price reaches the respective level during an active trade. Each alert includes the original entry price, triggered level, and current P/L in pips.
System Alerts (5 conditions). Cloud color change (bullish to bearish or vice versa), Kumo twist (Senkou Span A crosses Senkou Span B in the projected future), Kijun direction change, Chikou Span cross, and Momentum Pulse state change. These provide early warning of structural shifts before they mature into full signals.
| Channel | Default | Description |
|---|---|---|
| Popup (on-screen dialog) | Enabled | Standard MetaTrader alert dialog |
| Sound (alert.wav) | Enabled | Audible notification |
| Push notification (mobile) | Disabled | MetaTrader mobile app notification |
| Disabled | Email through MetaTrader mail settings |
All alerts support webhook JSON output. When configured, each alert generates a structured JSON payload containing symbol, timeframe, signal type, direction, confluence score, grade, entry price, SL, TP1, TP2, TP3, and a timestamp. This payload can be consumed by external services, trading bots, or notification platforms like Telegram or Discord through webhook integration. All alerts are guarded by a once-per-bar mechanism that prevents duplicate notifications on volatile bars where price may cross and recross a level multiple times.
Practical Trading Workflow
Understanding each component individually is important, but applying them in a structured workflow produces consistent results. The following six-step workflow describes how to use Kumo Forge Pro in daily trading.
Step 1: Add the indicator. Find Kumo Forge Pro in Navigator > Indicators > Market. Drag onto any chart. Start with H1 or H4 for clearly defined cloud structures and well-spaced signals. Allow 100-200 bars for warmup.
Step 2: Choose mode. If you trade multiple instruments with varying volatility, keep the default Adaptive mode. If you have already optimized your own Ichimoku periods, switch to Classic mode.
Step 3: Configure signals and filters. Enable signal types matching your trading style. For trend-following traders, enable KB and CB as primary signals for low-risk re-entries. For breakout traders, ensure BK is enabled with ShowRetest = true. Adjust MinScore: 40 (balanced), 60 (Standard+Strong only), 80 (Strong only).
Step 4: Check dashboard and MTF panel. When a signal fires, review the confluence score and grade. Check individual factor scores to see which dimensions support the trade. Verify higher-timeframe alignment -- a buy signal on M15 with bullish conditions on H1 and H4 is significantly stronger than one contradicting higher timeframes.
Step 5: Set trade management alerts. Enable push or email alerts for TP1/TP2/TP3/SL hits to monitor progression without watching the chart. Consider scaling out at TP1 (1.5R) and TP2 (2.5R), with the final portion targeting TP3 (4.0R).
Step 6: Monitor and review. The dashboard updates in real time with checkmarks and cumulative win rate. Review performance periodically; increase MinScore if win rate drops below expectations.
Timeframe Recommendations
On lower timeframes (M5, M15), the adaptive engine responds to intraday volatility shifts, producing cloud structures that breathe with session changes. Signals are more frequent but trade duration is shorter. The MTF panel showing H1 and H4 conditions is essential for filtering lower-timeframe noise.
On medium timeframes (M30, H1, H4), the indicator produces well-spaced signals with meaningful cloud structures reflecting multi-day to multi-week trends. The Kijun-sen on H1 covers approximately one day, providing a natural intraday equilibrium reference. Best balance of signal frequency and quality for swing traders.
On higher timeframes (D1, W1), each signal carries significant structural weight but signals are infrequent. The adaptive engine scales periods based on daily or weekly volatility cycles. Wider stops, longer holds for position traders.
Multi-Chart Setup
Because the indicator operates independently on each chart, traders can add it to multiple instruments and timeframes simultaneously. Each instance maintains its own Ichimoku calculations, signal state, dashboard, and TP/SL tracking. Combined with push notification alerts, this allows monitoring a watchlist of 10 or more instruments without manually switching between charts. A practical approach is to set up the indicator on the H1 chart for each primary trading instrument with AlertPush enabled. When a notification arrives, open the chart to review the dashboard and confluence details.
Parameter Reference
All 35+ input parameters are listed below, grouped by function. Default values match the source code exactly.
Main Ichimoku Settings
| Parameter | Default | Description |
|---|---|---|
| Mode | Adaptive | Operating mode: Adaptive (ATR-scaled) or Classic (fixed periods) |
| ConvPeriod | 9 | Base conversion line (Tenkan-sen) period |
| BasePeriod | 26 | Base line (Kijun-sen) period |
| SpanBPeriod | 52 | Senkou Span B period |
| Displacement | 26 | Cloud displacement (bars shifted forward) |
| Source | close | Price source for calculations |
Adaptive Engine
| Parameter | Default | Description |
|---|---|---|
| VolatilityLookback | 50 | Bars for ATR normalization baseline |
| AdaptStrength | 0.4 | Scaling aggressiveness (0.0 = fixed, 1.0 = full adaptation) |
Signal Types
| Parameter | Default | Description |
|---|---|---|
| KijunBounce | true | Enable Kijun-sen bounce signals (KB) |
| CloudBounce | true | Enable cloud edge bounce signals (CB) |
| ChikouBreak | false | Enable Chikou Span breakout signals (CK) |
| RSIFilter | false | Enable RSI as additional confluence factor |
Signal Filters
| Parameter | Default | Description |
|---|---|---|
| MinScore | 40 | Minimum confluence score % for signal display |
| KumoFilter | true | Require price position relative to cloud to match signal direction |
| VolFilter | true | Require above-average volume for signal validation |
| ChikouFilter | true | Require Chikou Span confirmation for signals |
TP/SL Settings
| Parameter | Default | Description |
|---|---|---|
| ShowTPSL | true | Display TP/SL lines and zones on the chart |
| SLMode | "Kumo Edge" | Stop loss mode: "Kumo Edge", "Kijun", or "ATR" |
| SLAtrMult | 0.5 | ATR multiplier for SL (when SLMode = "ATR") |
| TP1 / TP2 / TP3 | 1.5 / 2.5 / 4.0 | Risk-reward ratios relative to SL distance |
Breakout Settings
| Parameter | Default | Description |
|---|---|---|
| ShowBreakout | true | Enable Kumo Breakout signal display |
| BreakVolMult | 1.3 | Volume multiplier threshold for breakout validation |
| ShowRetest | true | Enable post-breakout cloud retest detection |
Multi-Timeframe Panel
| Parameter | Default | Description |
|---|---|---|
| ShowMTF | true | Display the multi-timeframe analysis panel |
| TF1 / TF2 / TF3 | M15 / H1 / H4 | MTF timeframes |
Dashboard
| Parameter | Default | Description |
|---|---|---|
| ShowDash | true | Display the real-time dashboard panel |
| Position | "Top Right" | Chart corner for dashboard placement |
| FontSize | Normal | Dashboard font size |
Recommended Configuration Profiles
Scalping (M5-M15, high frequency): MinScore = 30, all signal types enabled including ChikouBreak = true, TP 1.0/1.5/2.5 for tighter targets, SLMode = "ATR" with SLAtrMult = 0.3, MTF M5/M15/H1, AdaptStrength = 0.5 for faster response.
Swing Trading (H1-H4, balanced): All defaults. Adaptive mode, MinScore = 40, KB and CB enabled, SLMode = "Kumo Edge", TP 1.5/2.5/4.0, MTF M15/H1/H4. Best balance of signal frequency and quality.
Conservative (H4-D1, fewer but stronger signals): MinScore = 70, RSIFilter = true, only TK Cross and KB enabled, SLMode = "Kijun", TP 2.0/3.5/5.0 for wider targets, MTF H4/D1/W1. Infrequent but high-conviction signals.
Installation
Kumo Forge Pro is distributed through the MQL5.com Market and installs automatically after purchase.
- Purchase from the MQL5.com Market product page.
- The indicator downloads and installs automatically into MetaTrader.
- Open the Navigator panel (Ctrl+N) and expand the Indicators section.
- Find Kumo Forge Pro under Indicators > Market.
- Drag the indicator onto any chart, adjust parameters, click OK.
Works on all timeframes and all instruments supported by your broker. No manual file copying required. Allow 150-250 bars for initial warmup. Ensure the chart has at least 500 bars of historical data for full cloud projection. For the MTF panel, MetaTrader must have historical data available for the three configured timeframes. All graphical objects use a consistent prefix and are automatically cleaned up when the indicator is removed.
Conclusion
Kumo Forge Pro transforms the traditional Ichimoku Kinko Hyo system from a static, subjective framework into an adaptive, quantified trading tool. The adaptive volatility engine solves the fundamental problem of fixed 9/26/52 periods by dynamically scaling all Ichimoku components based on ATR(14) normalization, ensuring the cloud, conversion line, base line, and displacement respond to current market conditions rather than assumptions from a 1960s trading calendar.
The 9-factor confluence scoring system replaces subjective "Ichimoku checklist" analysis with an objective, point-based evaluation grading every signal from Weak through Standard to Strong. Five signal types -- TK Cross, Kijun Bounce, Cloud Edge Bounce, Kumo Breakout, and Chikou Breakout -- cover the full spectrum of Ichimoku opportunities. The Smart TP/SL system with three SL modes and three TP levels provides built-in trade management with automatic hit tracking and win rate calculation. The 22-28 row dashboard with MTF panel delivers comprehensive analysis in a single panel. Twenty-three alert conditions with webhook JSON support enable full automation.
The non-repainting architecture ensures every signal on the chart represents a genuine confirmed-bar evaluation, providing reliable backtesting data and trustworthy live trading signals. The indicator is designed for traders who want a systematic, adaptive approach to Ichimoku cloud trading across Forex, Crypto, Stocks, Commodities, and Indices. All 35+ input parameters are fully configurable, allowing the indicator to be tuned from aggressive scalping setups with low confluence thresholds to conservative position trading configurations with strict multi-factor filtering. Whether used as a primary signal source or as a confirmation tool alongside other analysis methods, the adaptive Ichimoku framework provides a foundation for disciplined, rule-based trading built on one of the most time-tested technical analysis systems in existence.
Download the indicator:
- MetaTrader 5: Kumo Forge PRO MT5
- MetaTrader 4: Kumo Forge PRO MT4
CONTACT & SUPPORT
- Email: info@forexobroker.com
- Questions: Use the Comments section on the product page or send a private message
- Bug Reports: Please include your broker name, account type, and a screenshot
-
✅ All MQL Tools: https://www.mql5.com/en/users/forexobroker/ ✅
--------------------------------------------------------------------------------------------------------------
🏦 **Broker I use**: https://icmarkets.com/?camp=55869
🏦 **Broker For EU Traders I use 1**: https://www.ictrading.com?camp=91414
🏦 **Broker I use 2**: https://one.exnessonelink.com/boarding/sign-up/a/c_thuv62ocfq
💻 **VPS**: https://chocoping.com/processing/aff.php?aff=738
💼 **Companies I use for getting funded**:
Fundednext: https://fundednext.com/?fpr=kestutis39
The5ers: https://www.the5ers.com/?afmc=16kl
FTMO: https://trader.ftmo.com/?affiliates=nRAyOhmFRnEnFdOpdLeh
Risk Disclaimer. Trading financial instruments carries a high level of risk and may not be suitable for all investors. Past indicator signals do not guarantee future results. The information provided in this article and by the indicator is for educational and informational purposes only and should not be construed as investment advice. No indicator can predict future price movements with certainty, and all trading involves the risk of loss. Always use proper risk management, position sizing appropriate to your account, and never risk more than you can afford to lose. Consult a qualified financial advisor before making trading decisions. Test any new indicator thoroughly on a demo account before applying it to live trading.


")
