
HyperTrend PRO: Adaptive SuperTrend Indicator with 5-Factor Confluence Scoring for MT4 and MT5

Introduction
Identifying trend direction remains one of the most difficult tasks in active trading. Every trader has experienced the frustration of watching a clear trend develop, entering confidently, and then watching the move reverse. The challenge is not recognizing a trend after it has matured -- that is easy in hindsight. The challenge is recognizing it early enough to capture a meaningful portion of the move, while filtering out the false starts and choppy consolidations that plague every instrument on every timeframe. Enter too early and you catch every whipsaw. Wait for absolute confirmation and you absorb the bulk of pullback risk. The space between these extremes is where most trend-following systems succeed or fail.
Single-indicator approaches compound the problem. A moving average crossover works in clean trends but generates dozens of false signals during sideways conditions. A momentum oscillator catches early reversals but chops the account to pieces in a range. Each tool captures one dimension of a multi-dimensional phenomenon, and relying on any single dimension leaves the trader exposed to the exact conditions that dimension cannot measure.
HyperTrend PRO was built to address this fundamental limitation. At its core, the indicator runs an adaptive SuperTrend engine that uses ATR-based bands to track directional bias. But rather than passing every SuperTrend flip as a trade signal, the indicator routes each raw crossover through a 5-factor confluence scoring system. Five independent measurements -- MACD histogram momentum, EMA cloud direction, ADX trend strength, volume participation, and HMA momentum -- must collectively validate the signal before an arrow appears. Each factor contributes one point to a score between 0 and 5, and traders set a minimum threshold to control selectivity.
- MetaTrader 5: Hyper Trend PRO MT5
- MetaTrader 4: Hyper Trend PRO MT4
Every signal is non-repainting -- conditions are evaluated only on confirmed (closed) bars and never modified afterward. The built-in risk management module calculates ATR-based stop loss and three take profit levels with automatic hit detection and visual chart zones. A 9-row dashboard displays multi-timeframe trend alignment, market state, volatility, session detection, and the current signal with its score. Nine alert conditions cover buy, sell, any signal, strong signal, stop loss hit, TP1/TP2/TP3 hit, and trend change, delivered through popup, sound, push, and email channels.
Additional modules include a Contrarian RSI system using a smoothed RSI with Fibonacci-scaled Bollinger bands, a WaveTrend-based pullback signal system for re-entry during established trends, a Trend Tracer line for dominant trend direction, and candle coloring based on MACD histogram strength relative to ATR.
This article explains the technical concepts behind each component, walks through the logic, and provides a complete parameter reference for configuring HyperTrend PRO across markets, timeframes, and trading styles.
What Is Trend Following
Trend following is built on a single premise: once a market begins moving in a direction, it is more likely to continue than to reverse. This is a statistical observation supported by decades of data across equities, commodities, currencies, and fixed income. Markets exhibit serial correlation -- price movements in one direction tend to cluster rather than alternate randomly -- and trend-following systems are designed to exploit this clustering.
A trend-following trader does not predict tops or bottoms. The trader waits for evidence that a directional move has started, enters in that direction, and stays until evidence emerges that the move has ended. Profits come from the middle of large moves; losses come from the inevitable false starts.
What makes trend following difficult in practice is not the concept but the implementation. The evidence that a trend has started is always ambiguous. A moving average may turn upward, but the turn could be a minor fluctuation within a larger range. A breakout above resistance may be genuine or may immediately reverse. Any single measurement of trend can be fooled by noise.
The solution adopted by institutional trend-following systems is confluence -- requiring multiple independent measurements to agree before committing capital. When a moving average, momentum, volume, and trend strength all align, the probability of a random false alignment is geometrically lower than any individual measurement being wrong. If a single indicator has a 60% accuracy rate, requiring five independent confirmations dramatically reduces false positives. The trade-off is that requiring multiple confirmations also filters out some genuine signals, reducing overall frequency. This is the fundamental tension: more filters mean fewer but better signals.
HyperTrend PRO implements this through its 5-factor scoring system, where the SuperTrend engine provides the directional signal and five independent filters validate the environment. The configurable minimum score threshold lets traders choose their own position on the frequency-quality spectrum.
The Problem with Single-Indicator Systems
Every technical indicator measures one specific aspect of price behavior. A moving average tracks the average price over a lookback period. The RSI measures the ratio of upward to total movement. The ADX measures the strength of directional movement without regard to direction. Each tool is well-designed for the specific question it answers, but none answers the complete question of whether a high-quality trend is underway.
Consider a 50-period EMA crossover system. During a clean uptrend, the system performs well -- price stays above the EMA, pullbacks bounce, and the trader remains on the right side. But during a six-month sideways consolidation, the same system generates buy signal after buy signal as price crosses above the EMA, only to fall back days later. The EMA correctly identifies direction when a trend exists but has no mechanism to determine whether a trend exists at all.
Adding an RSI helps in certain conditions but creates new problems. An RSI reading of 30 in a multi-month downtrend is not a buy signal -- it is a symptom of persistent selling pressure. An RSI of 70 during an early-stage breakout is not a sell signal -- it reflects strong buying momentum. Without context from a trend filter, the oscillator generates signals that fight the dominant direction.
Volume adds another dimension but says nothing about direction -- it only indicates participation. The MACD captures the rate of momentum change but lags and cannot distinguish trending from ranging conditions. The HMA smooths price with minimal delay but does not measure whether momentum is supported by volume, broader trend agreement, or a trending market state.
This is why confluence matters. By combining MACD momentum direction, EMA cloud trend alignment, ADX trend strength, volume participation, and HMA price momentum, HyperTrend PRO constructs a composite view no single indicator provides. A signal passing all five factors means momentum, trend, strength, participation, and price dynamics all agree. The scoring system transforms a subjective "the setup looks good" into an objective score from 0 to 5.
SuperTrend Engine Explained
The SuperTrend is an ATR-based trend-following indicator that creates two bands around the closing price and flips between them to signal directional changes. Rather than fixed-width channels, it scales band width using the Average True Range, automatically widening during volatile conditions and narrowing during quiet ones.
HyperTrend PRO's SuperTrend uses two configurable parameters: Sensitivity (default 3.1) and Tuner (default 25). The Sensitivity parameter is the ATR multiplier that controls how far the bands are placed from the closing price. A higher value places bands further from price, making the indicator less sensitive to small fluctuations and producing fewer but more significant direction changes. A lower value places bands closer, making the indicator more responsive but also more prone to whipsaw. The Tuner parameter sets the ATR lookback period -- a value of 25 means the ATR is calculated over the last 25 bars, providing a stable volatility estimate that does not overreact to individual large bars.
Calculation. On each bar, two raw bands are computed: upper band = close + (Sensitivity x ATR), lower band = close - (Sensitivity x ATR). These raw bands are then ratcheted:
- Lower band (support): If the new raw lower band is higher than the previous, or if the previous close was below the previous lower band, the new value is used. Otherwise, the previous band is retained. The lower band can only move upward during an uptrend -- it follows price up but locks during pullbacks.
- Upper band (resistance): Mirror logic. During a downtrend, the upper band can only move downward -- it follows price down but locks during bounces.
The directional flip occurs when price closes beyond the active band. If bullish (tracking lower band) and price closes below it, direction flips bearish. If bearish and price closes above the upper band, direction flips bullish.
These flips are the raw signals processed through the confluence scoring system. Without the confluence layer, a SuperTrend system generates too many flips during range-bound conditions. The scoring acts as a quality gate.
The default Sensitivity of 3.1 (slightly above the common 3.0) provides a fractionally wider band that reduces noise-induced flips. The 25-bar ATR lookback (longer than the standard 14) smooths out individual high-range or low-range bars. Traders wanting faster signals can reduce both values (e.g., Sensitivity 2.0, Tuner 14). Those wanting only major trend changes can increase both (e.g., Sensitivity 4.0, Tuner 30). Combined with the 5-factor score, this provides two-stage control: coarse filtering through band width, fine filtering through confluence requirements.
5-Factor Confluence Scoring
The confluence scoring system is the core innovation of HyperTrend PRO. When the SuperTrend produces a directional flip, five independent technical factors are evaluated, each contributing one point to a score from 0 to 5.
Factor 1: MACD Histogram (12, 26, 9). For a buy signal, the histogram must be above zero AND rising (current > previous bar). This two-part condition ensures momentum is not only bullish but accelerating. A positive but declining histogram suggests weakening momentum -- less favorable for new entries. For sells, the histogram must be below zero AND falling.
Factor 2: EMA Cloud Direction. The 150-period EMA must be above the 250-period EMA for buy signals (bullish cloud), or below for sell signals (bearish cloud). During sideways conditions where the EMAs are interleaved, neither direction gets a consistent point, naturally suppressing signal quality in ranging markets.
Factor 3: ADX Trend Strength (14). When ADX exceeds 20, the market is trending and both buy/sell factors score a point. Below 20, the market is range-bound and neither direction receives the point. The threshold of 20 is the standard institutional benchmark for trend presence.
Factor 4: Volume Participation. Current bar tick volume must exceed its 20-period SMA. This ensures signals fire during active participation rather than thin conditions. Low-volume breakouts are statistically more likely to fail. If tick volume is unavailable (zero), the factor defaults to pass.
Factor 5: HMA Direction (55). The Hull Moving Average (HMA = WMA(2 x WMA(close, 27) - WMA(close, 55), 7)) must be rising for buys (current HMA > HMA two bars ago) or falling for sells. This captures near-term smoothed price direction as confirmation that price is actually moving in the signal direction.
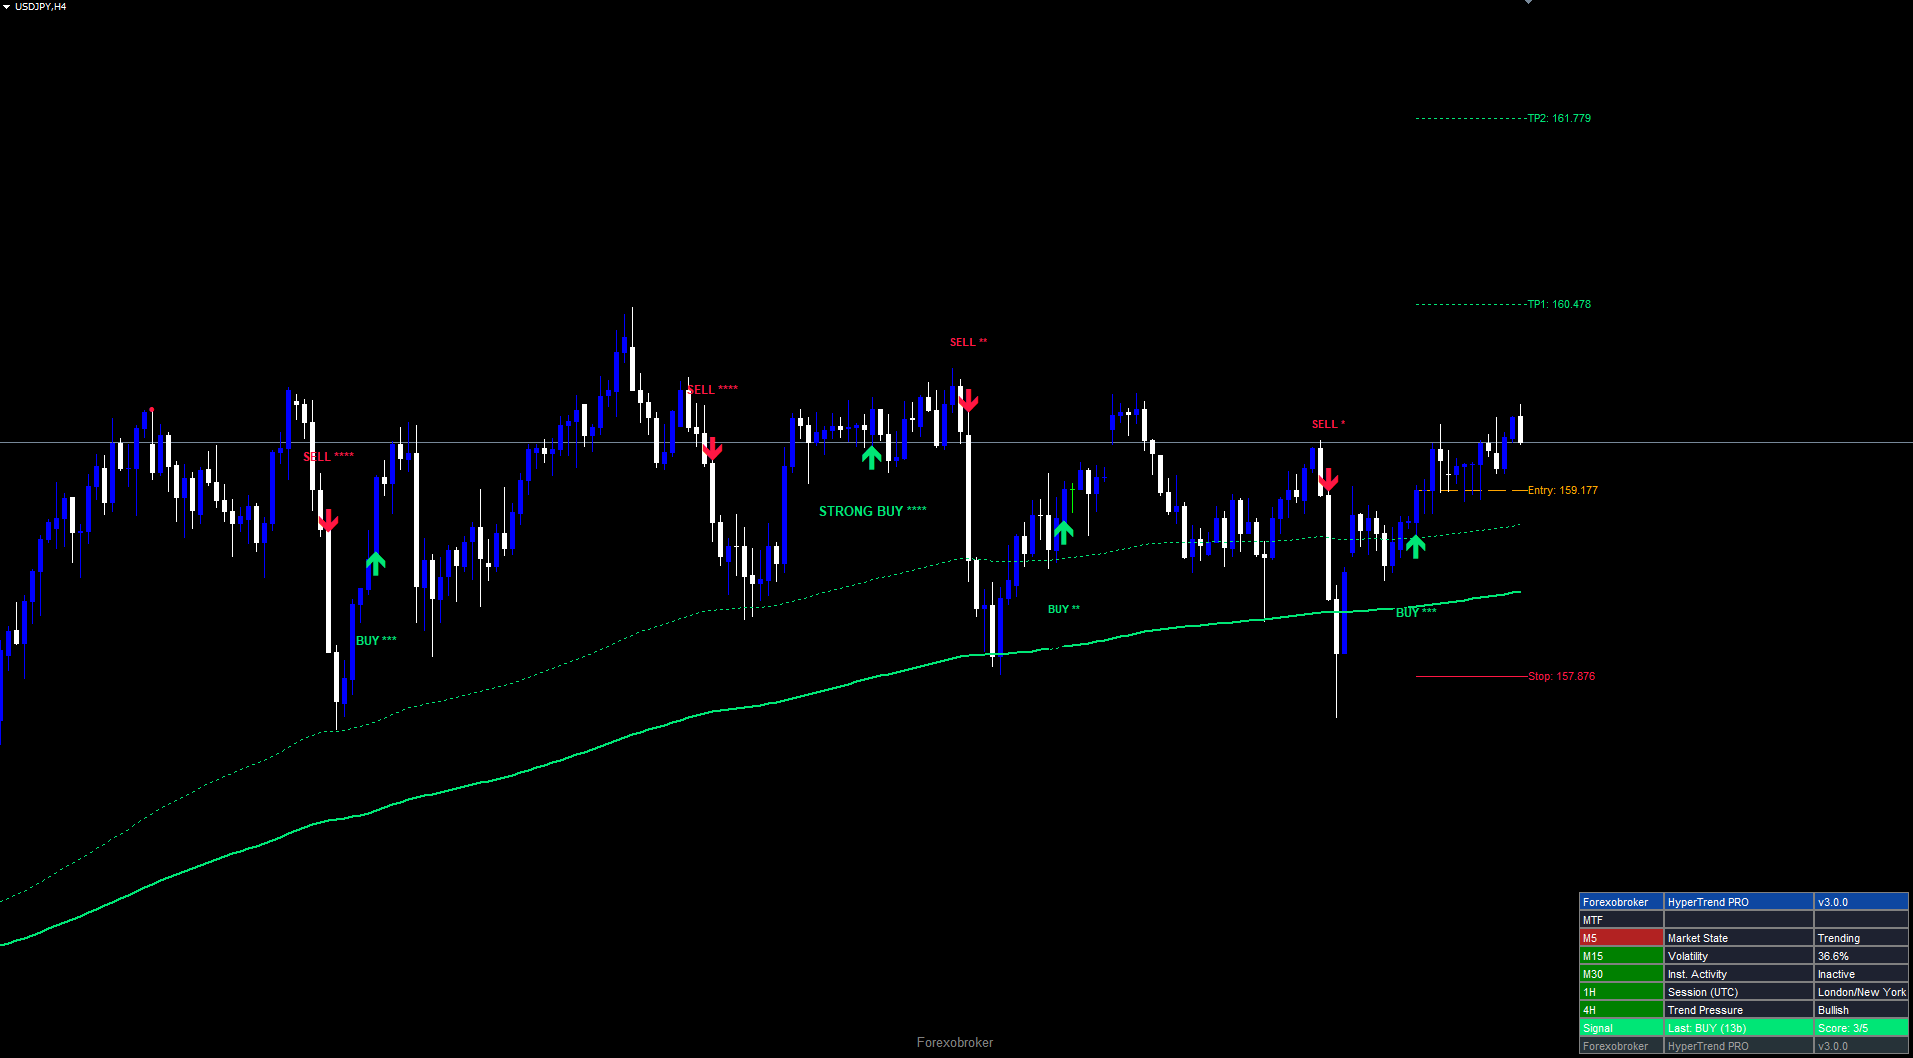
The score is displayed alongside each signal arrow using asterisks. A score of 3 appears as "BUY ***", a score of 5 as "BUY *****". Strength labels: Weak (0-1), Fair (2), Good (3), Strong (4), Ultra (5). Signals scoring 4+ with price beyond the 200 EMA display as "STRONG BUY/SELL" with a larger font.
Three presets configure the minimum threshold: All Signals (minimum 0) allows every flip through, Quality+ (minimum 3) requires majority agreement, Strong+ (minimum 4) produces only high-conviction signals. A fourth preset, Trend Scalper, uses minimum 2 with scalper-specific logic. Traders can also set a custom minimum (0-5) via the Minimum Signal Strength parameter, which overrides the preset if higher.
Non-Repainting Architecture
Repainting is the most common source of false confidence in technical indicators. An indicator that evaluates conditions on the currently forming bar can show a buy arrow that disappears when the bar closes at a different price. During the bar's formation, price may temporarily trigger the SuperTrend to flip, causing an arrow to appear. If price reverses before the close, the arrow vanishes as if it never existed. In backtesting, repainting indicators appear perfectly timed because all incorrect signals have been silently erased. In live trading, the trader experiences every false signal in real time.
HyperTrend PRO eliminates repainting through a strict confirmed-bar evaluation rule. The key line is barConfirmed = (shift > 0) . Signal evaluation only occurs on bars that have already closed. The rightmost bar on the chart (shift 0), which is still forming, is excluded from signal generation. Once an arrow is placed at a specific bar and price level, it never moves, changes color, or disappears regardless of what happens on subsequent bars.
This means signals appear one bar after the initial SuperTrend flip. If the SuperTrend flips during bar N, the arrow appears at bar N's close when bar N+1 begins forming. The entry price in the dashboard corresponds to the close of bar N. This one-bar delay is the cost of non-repainting integrity -- every non-repainting indicator pays it. Serious traders universally prefer the certainty of a permanent signal that appears slightly later over the illusion of a perfectly timed signal that exists only in hindsight.
The non-repainting principle extends to every component. The confluence score displayed on the signal label is the score as it was at bar close -- it does not retroactively change if subsequent bars alter the MACD histogram or HMA direction. TP/SL levels are calculated from entry price and ATR at signal time and remain fixed for the duration of the trade. The dashboard updates in real time for current conditions, but historical signals on the chart are permanent records. This permanence makes the indicator suitable for visual backtesting -- a trader can scroll through and see every signal exactly as it would have appeared in real time.
4 Cloud Styles
HyperTrend PRO offers four EMA Cloud styles. The cloud fills the area between two moving averages with the bull color when the faster average is above the slower one, and bear color when inverted.
Smooth (default). EMA(150) and EMA(250) -- the same pair used in Factor 2 of the scoring system. The widest and most stable style, changing direction infrequently. Best for swing traders on H1, H4, D1 who want broad structural trend context. The cloud acts as a dynamic support/resistance zone during pullbacks.
Scalping. Uses a secondary SuperTrend band pair with Sensitivity 2.0 and ATR period 10. This produces a tight, responsive cloud that hugs price closely and flips direction quickly. The cloud boundaries act as immediate dynamic support and resistance. Designed for short-term traders on M5, M15, M30 who need rapid trend context.
Scalping+. Uses HMA(21) and HMA(55). The HMA reduces lag compared to standard moving averages, making this cloud more responsive than Smooth while remaining smoother than Scalping. It is a middle ground for M15 to H1 traders who find the Scalping cloud too volatile and the Smooth cloud too slow.
Swing. Uses EMA(50) and EMA(200) -- the classic institutional "golden cross / death cross" pair. This cloud changes direction very infrequently, making it suitable for position traders on H4, D1, W1 who are interested only in major trend changes. Price crossing from one side to the other represents a substantial structural shift.
| Cloud Style | Fast MA | Slow MA | Best Timeframes | Responsiveness |
|---|---|---|---|---|
| Smooth | EMA(150) | EMA(250) | H1, H4, D1 | Medium |
| Scalping | SuperTrend(2.0, 10) | Close | M5, M15, M30 | High |
| Scalping+ | HMA(21) | HMA(55) | M15, M30, H1 | Medium-High |
| Swing | EMA(50) | EMA(200) | H4, D1, W1 | Low |
All four styles are purely visual -- they change the cloud display but do not affect signal generation. The 5-factor scoring always uses the EMA(150)/EMA(250) pair for Factor 2 regardless of which cloud style is selected for display. This separation is deliberate: the cloud provides visual context for chart reading, while the scoring system uses a fixed set of indicators for consistent quality assessment.
Traders who want the cloud direction to influence signal generation can enable the Cloud-Aligned Signals Only filter. When active, this requires the EMA(150) to be above the EMA(250) for buy signals and below for sell signals, making the cloud a mandatory requirement rather than just a visual reference. Note that this filter always uses the Smooth cloud's underlying EMAs, regardless of which visual style is displayed.
ATR Risk Management
Every signal includes a complete risk management framework with stop loss and three take profit levels, all ATR-scaled to adapt automatically to instrument volatility.
Stop Loss: Calculated as the signal bar's low minus 2.2x ATR(14) for buys, or high plus 2.2x ATR(14) for sells. For example, if EURUSD H1 ATR is 25 pips, the stop is approximately 55 pips from the bar low. On GBPJPY with 60-pip ATR, approximately 132 pips. This adaptive scaling eliminates the common mistake of fixed-pip stops that are too tight on volatile instruments or too wide on calm ones.
Alternatively, percentage-based stop loss mode (Use % for SL) places the stop at a configurable percentage of price (default 1.0%), useful for stocks or indices where percentage moves are more intuitive.
Three Take Profit levels as risk-reward multiples of the stop loss distance:
- TP1 at 1.0x risk-reward (1:1 ratio -- recovers the risk)
- TP2 at 2.0x risk-reward (standard swing target)
- TP3 at 3.0x risk-reward (runner target for extended moves)
The indicator tracks whether each level is reached. The trade closes automatically when TP3 is hit or when the stop loss is triggered. Each TP level can be independently enabled or disabled.
An optional trailing stop (Show Trailing Stop = false by default) ratchets behind price using the same 2.2x ATR(14) formula. For buy trades, the trailing lower band can only move upward -- it never falls back. For sell trades, the trailing upper band can only move downward. The trailing stop resets when a new signal fires. When active, it replaces the fixed stop loss for hit tracking purposes.
Each take profit level can be independently enabled or disabled (Use TP1 = true, Use TP2 = true, Use TP3 = true). A trader who prefers a single target can disable TP2 and TP3. A trader who manages partial closes can keep all three active and scale out at each level.
Visual lines on the chart show the entry price (orange dashed), stop loss (red solid), and each enabled take profit level (green dotted), extending from the signal bar to the current bar. Price labels at the right edge display the exact price for each level. With default multipliers (1.0, 2.0, 3.0), the system creates a tiered reward structure: the first target recovers the risk, the second provides twice the risk as profit, and the third provides three times the risk. A trader closing equal portions at each level achieves an average 2:1 risk-reward, meaning the system can tolerate a win rate below 50% and remain profitable -- a fundamental characteristic of trend-following approaches.
The TP/SL system integrates with the alert module. When TP1, TP2, TP3, or the stop loss is reached, the corresponding alert fires through all configured channels, creating a complete signal-to-exit notification workflow that does not require the trader to watch the chart continuously.
Dashboard and Session Detection
The dashboard is a 9-row, 3-column panel displayed in a configurable position (default: Bottom Right), providing real-time market conditions, multi-timeframe trend alignment, and signal state at a glance.
Row 0: Header. "Forexobroker" | "HyperTrend PRO" | "v3.0.0" on blue background.
Row 1: MTF Label. Introduces the multi-timeframe section.
Rows 2-6: Multi-Timeframe Trend and Market Data. The left column shows timeframe labels (M5, M15, M30, 1H, 4H) colored green (close above 200 EMA) or red (below). All five green = strong multi-timeframe bullish alignment. Mixed colors = conflicting signals.
The middle and right columns display:
- Market State (ADX-based): "No Trend" (ADX < 15), "Ranging" (15-25), "Trending" (> 25).
- Volatility: Normalized ATR(10) percentage relative to its 20-bar statistical distribution. ~50% = average, >70% = elevated, <30% = compressed.
- Institutional Activity: Current tick volume vs 21-bar RMA. "Active" when volume exceeds 144% of average; "Inactive" otherwise.
- Session (UTC): Sydney (21:00-06:00), Tokyo (00:00-09:00), London (07:00-16:00), New York (13:00-22:00). Overlapping sessions displayed as combined labels (e.g., "London/New York").
- Trend Pressure: EMA(9) direction -- "Bullish" if current > 2 bars ago, "Bearish" if below, "Flat" if equal.
Row 7: Signal. Bull/bear colored background. Displays current signal direction with stars and "Score: X/5."
Row 8: Footer. "Forexobroker" | "HyperTrend PRO" | "v3.0.0" on dark background.
The dashboard repositions automatically when the chart is resized. Internally, all objects use CORNER_LEFT_UPPER with absolute pixel coordinates calculated from chart width and height, avoiding the common MetaTrader pitfall where objects anchored to other corners extend off-screen. Six position options are available: Top Right, Middle Right, Bottom Right (default), Top Left, Middle Left, and Bottom Left.
The two-object pattern (RECTANGLE_LABEL for background, LABEL for text) is used for every cell. This is necessary because OBJLABEL in MetaTrader does not support background color -- the only way to create colored cells is to layer a text label on top of a rectangle label. All objects use the "HTP" prefix and are automatically cleaned up when the indicator is removed from the chart.
The dashboard's value lies in consolidating information that would otherwise require opening multiple charts, indicator windows, and data panels. A single glance answers the questions that matter: Is the market trending? Is volatility expanding or compressing? Are institutions active? What session are we in? What does the multi-timeframe picture look like? And what is the current signal with its quality score?
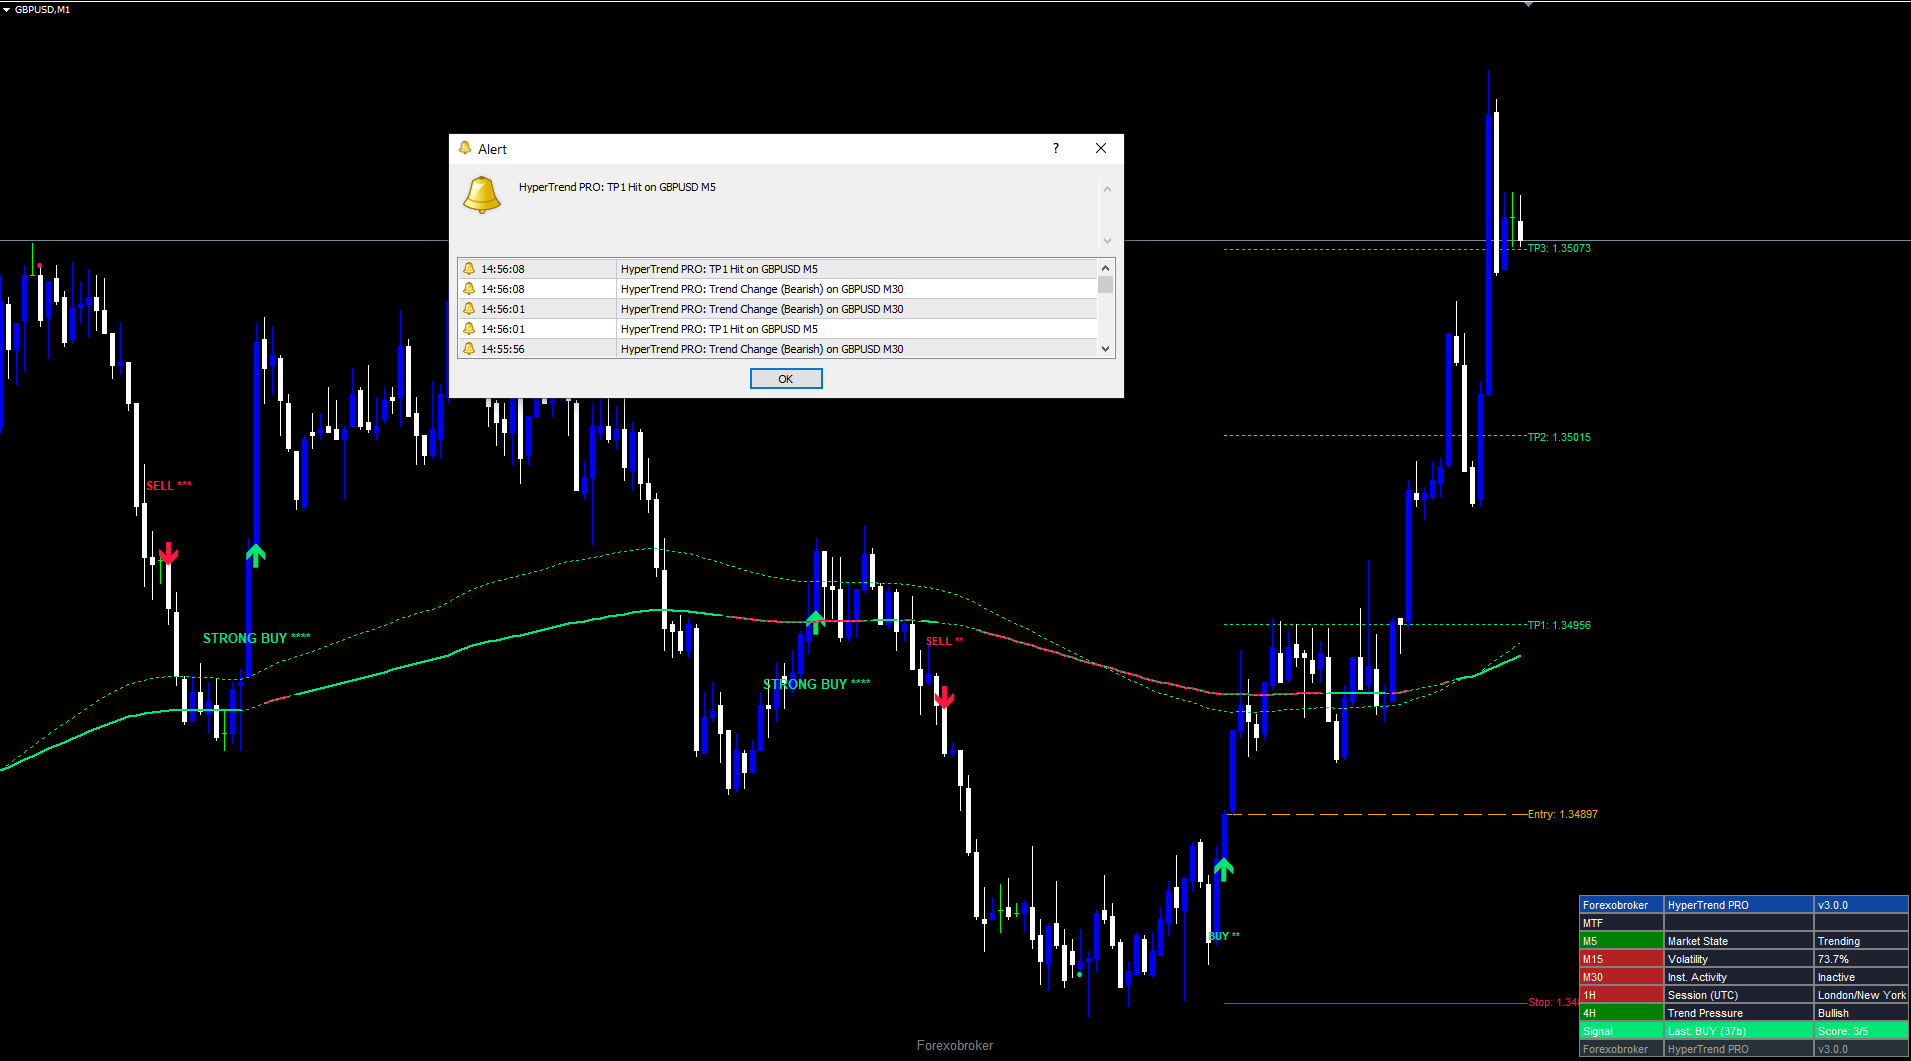
Alert System
HyperTrend PRO supports nine alert conditions covering the complete signal lifecycle:
- Buy Signal -- SuperTrend flip to bullish passes all requirements on a confirmed bar.
- Sell Signal -- SuperTrend flip to bearish passes all requirements on a confirmed bar.
- Any Signal -- fires on either buy or sell.
- Strong Signal -- score 4+ AND price beyond the 200 EMA in signal direction.
- SL Hit -- price reaches the stop loss level.
- TP1 Hit -- price reaches the first take profit.
- TP2 Hit -- price reaches the second take profit.
- TP3 Hit -- price reaches the third take profit.
- Trend Change -- EMA(150) crosses EMA(250), independent of the SuperTrend engine. On higher timeframes this may occur only a few times per year.
Alert messages include symbol, timeframe, confluence score, entry price, stop loss, and TP1 price for signal alerts, allowing traders to act without opening the chart.
| Channel | Default | Parameter |
|---|---|---|
| Popup (on-screen dialog) | Enabled | Popup Alert = true |
| Sound (alert.wav) | Enabled | Sound Alert = true |
| Push notification (mobile) | Disabled | Push Notification = false |
| Disabled | Email Alert = false |
All alerts are guarded by a once-per-bar mechanism. Each condition stores the timestamp of the last bar on which it fired. If the same condition triggers again on the same bar -- which can happen during volatile bars where price crosses and recrosses a TP or SL level -- the alert will not fire a second time. The master switch (Enable Alerts = true) must be active for any alerts to fire. Alerts evaluate only on shift 1 (the just-completed bar), maintaining consistency with the non-repainting architecture.
A recommended configuration for active monitoring is to enable Push Notification for signal alerts and keep Popup and Sound enabled for desktop awareness. For traders who want only the highest-quality notifications, the Strong Signal alert filters to signals with a score of 4 or higher that are also positioned beyond the 200 EMA. The Trend Change alert is unique because it is independent of the SuperTrend engine -- it fires when the EMA(150) crosses the EMA(250), representing a shift in cloud direction that often precedes a cluster of signals in the new direction.
Practical Trading Workflow
Step 1: Add the indicator to a chart. Find HyperTrend PRO in the Navigator panel under Indicators > Market, drag onto any chart. Default settings work on most instruments. Start with H1 or H4 for well-defined signals.
Step 2: Select a preset and cloud style. Begin with All Signals and Smooth cloud to see signal frequency. Progress to Quality+ (minimum 3) or Strong+ (minimum 4) as confidence develops. Match cloud style to trading horizon: Scalping for M5-M30, Scalping+ for M15-H1, Smooth for H1-D1, Swing for H4+.
Step 3: Wait for a signal. When a confirmed bar produces a SuperTrend flip meeting the minimum threshold, a buy/sell arrow appears with star count and strength label. Do not anticipate signals before bar close.
Step 4: Check the dashboard. Scan MTF alignment, Market State ("Trending" is most favorable), session detection, and signal score.
Step 5: Configure alerts. Enable push notifications for Buy/Sell and TP/SL conditions to monitor multiple instruments hands-free.
Step 6: Manage the trade. Use the chart's TP/SL lines for scaling: close one-third at TP1 (1:1), move stop to breakeven, close another third at TP2 (1:2), let the rest run to TP3 (1:3). Or enable the trailing stop for automated management.
Timeframe Considerations
On lower timeframes (M5, M15), flips are frequent -- Scalping/Scalping+ cloud and confluence scoring filter out low-quality entries. On medium timeframes (M30, H1, H4), signals are well-spaced with strong trend context; scores of 3+ tend to have good follow-through. On higher timeframes (D1, W1), signals are infrequent but carry substantial weight; ATR-based stops will be wider, requiring appropriate position sizing.
Multi-Chart Setup
Because the indicator operates independently on each chart, traders can deploy it across multiple instruments and timeframes simultaneously. Each instance maintains its own SuperTrend state, confluence scores, TP/SL levels, and dashboard data. Combined with push notification alerts, this enables monitoring a watchlist of 10 or more instruments without manually switching between charts.
A practical approach is to set up the indicator on the 1-hour chart for each primary instrument with Push Notification enabled and Popup Alert disabled. You receive a mobile notification when any instrument generates a signal, then open MetaTrader to review the dashboard and chart context before deciding whether to enter.
Preset Recommendations by Trading Style
Day traders (M15-H1): Quality+ preset, Scalping+ cloud, pullback signals enabled, trailing stop on. Enable Pullback Signals for re-entry opportunities during established trends.
Swing traders (H1-H4): Default All Signals, Smooth cloud, default TP multipliers (1.0, 2.0, 3.0). The EMA(150)/EMA(250) cloud provides excellent structural reference for multi-day trades. Check MTF alignment before entering -- all five timeframes showing the same color provides the highest confidence.
Position traders (D1-W1): Strong+ preset, Swing cloud, Strong Signals Only and Trending Market Only enabled. Increase Sensitivity to 4.0 for wider SuperTrend bands. Use percentage-based SL (Use % for SL = true) at 2.0% for broader stops appropriate to daily timeframes.
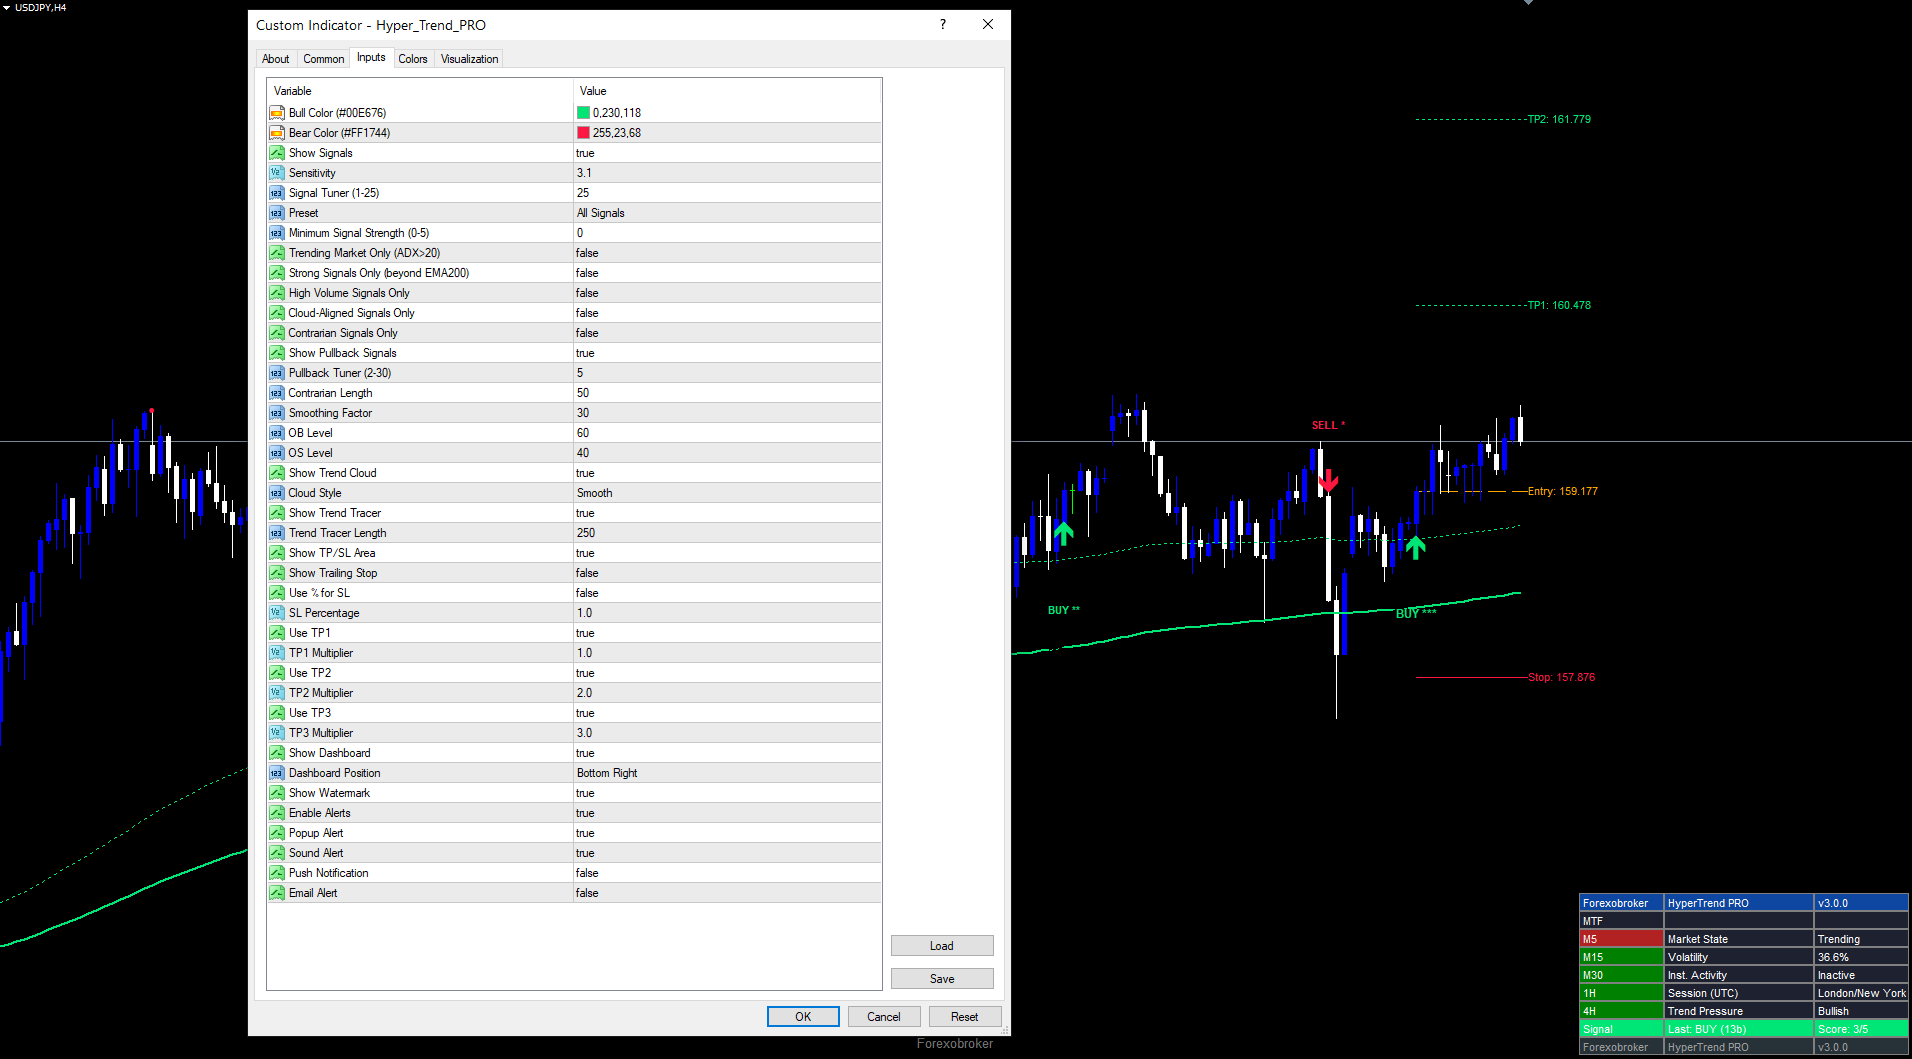
Parameter Reference
All 39 input parameters are listed below. Default values match the source code exactly.
Colors
| Parameter | Default | Description |
|---|---|---|
| Bull Color | C'0,230,118' | Color for bullish signals, tracer, and cloud |
| Bear Color | C'255,23,68' | Color for bearish signals, tracer, and cloud |
Main Settings
| Parameter | Default | Range | Description |
|---|---|---|---|
| Show Signals | true | -- | Display buy/sell arrow markers on the chart |
| Sensitivity | 3.1 | 0.1+ | SuperTrend ATR multiplier (higher = fewer signals) |
| Signal Tuner | 25 | 1-25 | ATR lookback period for SuperTrend bands |
| Preset | All Signals | All Signals / Quality+ / Strong+ / Trend Scalper | Minimum confluence threshold preset |
Signal Filters
| Parameter | Default | Description |
|---|---|---|
| Minimum Signal Strength | 0 | Manual minimum score override (0-5) |
| Trending Market Only | false | Require ADX > 20 for signals |
| Strong Signals Only | false | Require price beyond EMA(200) in signal direction |
| High Volume Signals Only | false | Require tick volume above SMA(20) |
| Cloud-Aligned Signals Only | false | Require EMA cloud in signal direction |
| Contrarian Signals Only | false | Require Contrarian RSI oversold (buy) or overbought (sell) |
Pullback Signals
| Parameter | Default | Range | Description |
|---|---|---|---|
| Show Pullback Signals | true | -- | Display WaveTrend-based pullback dots |
| Pullback Tuner | 5 | 2-30 | Controls WaveTrend channel (5x) and average (10x) lengths |
Contrarian Engine
| Parameter | Default | Range | Description |
|---|---|---|---|
| Contrarian Length | 50 | 5+ | RSI lookback period for contrarian system |
| Smoothing Factor | 30 | 1+ | EMA smoothing applied to raw RSI |
| OB Level | 60 | 50-95 | Overbought threshold for contrarian filter |
| OS Level | 40 | 5-50 | Oversold threshold for contrarian filter |
Trend Cloud
| Parameter | Default | Description |
|---|---|---|
| Show Trend Cloud | true | Display the EMA cloud fill on the chart |
| Cloud Style | Smooth | Smooth / Scalping / Scalping+ / Swing |
Trend Tracer
| Parameter | Default | Range | Description |
|---|---|---|---|
| Show Trend Tracer | true | -- | Display the trend tracer line |
| Trend Tracer Length | 250 | 10+ | EMA period for the tracer line |
Risk Management
| Parameter | Default | Description |
|---|---|---|
| Show TP/SL Area | true | Display TP/SL lines and labels on the chart |
| Show Trailing Stop | false | Display and activate the trailing stop line |
| Use % for SL | false | Calculate stop loss as percentage (if false, uses ATR x 2.2) |
| SL Percentage | 1.0 | Stop loss as percentage of price (when Use % for SL = true) |
| Use TP1 | true | Enable the first take profit level |
| TP1 Multiplier | 1.0 | TP1 risk-reward ratio relative to stop loss distance |
| Use TP2 | true | Enable the second take profit level |
| TP2 Multiplier | 2.0 | TP2 risk-reward ratio relative to stop loss distance |
| Use TP3 | true | Enable the third take profit level |
| TP3 Multiplier | 3.0 | TP3 risk-reward ratio relative to stop loss distance |
Dashboard
| Parameter | Default | Description |
|---|---|---|
| Show Dashboard | true | Display the real-time dashboard panel |
| Dashboard Position | Bottom Right | Top Right / Middle Right / Bottom Right / Top Left / Middle Left / Bottom Left |
| Show Watermark | true | Display the Forexobroker watermark on the chart |
Alerts
| Parameter | Default | Description |
|---|---|---|
| Enable Alerts | true | Master switch for all alert conditions |
| Popup Alert | true | Show on-screen popup dialog |
| Sound Alert | true | Play alert.wav sound file |
| Push Notification | false | Send push notification to mobile |
| Email Alert | false | Send email notification |
Recommended Configuration Profiles
Conservative (fewer signals, highest quality): Preset = Strong+, enable Trending Market Only and Strong Signals Only. Cloud Style = Smooth on H4 or D1.
Default (balanced): All default values. Preset = All Signals, no optional filters. Suitable for most Forex pairs on H1 and H4.
Aggressive (more signals): Sensitivity = 2.0, Signal Tuner = 14, Minimum Signal Strength = 0. Scalping or Scalping+ cloud on M15 to H1.
Scalper: Preset = Trend Scalper, Cloud Style = Scalping, pullback signals enabled, Trend Tracer Length = 100. Use on M5 or M15 with tight TP multipliers (0.5, 1.0, 1.5).
Download the indicator:
- MetaTrader 5: Hyper Trend PRO MT5
- MetaTrader 4: Hyper Trend PRO MT4
Conclusion
HyperTrend PRO combines an adaptive SuperTrend engine with a 5-factor confluence scoring system to transform raw trend signals into scored, validated trade entries. By requiring MACD momentum, EMA cloud direction, ADX trend strength, volume participation, and HMA price momentum to collectively confirm each signal, the indicator addresses the fundamental weakness of single-indicator trend detection.
The non-repainting architecture ensures every arrow represents a genuine signal evaluated on a closed bar. ATR-based risk management provides automatic stop loss and three take profit levels adapting to any instrument's volatility. The 9-row dashboard delivers multi-timeframe alignment, market state, session detection, and signal data in a single panel. Nine alert conditions with four delivery channels enable hands-free monitoring across multiple instruments.
Four cloud styles, configurable presets, six optional signal filters, pullback signals, a contrarian RSI engine, and a trailing stop provide layers of customization that allow the indicator to serve scalpers on M5 through position traders on D1. Whether used as a primary signal source with the Quality+ or Strong+ preset, or as a confirmation overlay in All Signals mode alongside other analysis methods, the systematic approach to trend scoring provides a foundation for disciplined, rule-based trading. All 39 input parameters are fully documented and adjustable through the indicator's Input tab.
The indicator works on all instruments supported by MetaTrader -- Forex, Crypto, Stocks, Commodities, and Indices -- and adapts its ATR-based calculations to the volatility characteristics of each market automatically. It performs well on timeframes from M5 through W1, though the confluence scoring is most effective on M30, H1, and H4 where the component indicators (MACD, EMA, ADX, Volume, HMA) have sufficient data to produce meaningful readings. The Trend Tracer, pullback signals, and Contrarian RSI engine provide additional analytical layers beyond the core SuperTrend and scoring system.
Risk Disclaimer. Trading financial instruments carries a high level of risk and may not be suitable for all investors. Past indicator signals do not guarantee future results. The information provided in this article and by the indicator is for educational and informational purposes only and should not be construed as investment advice. No indicator can predict future price movements with certainty, and all trading involves the risk of loss. Always use proper risk management, position sizing appropriate to your account, and never risk more than you can afford to lose. Consult a qualified financial advisor before making trading decisions. Test any new indicator thoroughly on a demo account before applying it to live trading.
CONTACT & SUPPORT
- Email: info@forexobroker.com
- Questions: Use the Comments section on the product page or send a private message
- Bug Reports: Please include your broker name, account type, and a screenshot
-
✅ All MQL Tools: https://www.mql5.com/en/users/forexobroker/ ✅
--------------------------------------------------------------------------------------------------------------
🏦 **Broker I use**: https://icmarkets.com/?camp=55869
🏦 **Broker For EU Traders I use 1**: https://www.ictrading.com?camp=91414
🏦 **Broker I use 2**: https://one.exnessonelink.com/boarding/sign-up/a/c_thuv62ocfq
💻 **VPS**: https://chocoping.com/processing/aff.php?aff=738
💼 **Companies I use for getting funded**:
Fundednext: https://fundednext.com/?fpr=kestutis39
The5ers: https://www.the5ers.com/?afmc=16kl
FTMO: https://trader.ftmo.com/?affiliates=nRAyOhmFRnEnFdOpdLeh


")
