
Quadra Zone Entries: The 8-EMA Ribbon Indicator with ATR Trade Zones, Multi-Symbol Screener, and Multi-Timeframe

1. Introduction
Most retail traders spend the first hour of their session doing the same manual work: scrolling through chart after chart, checking whether the EURUSD is trending, whether GBPJPY has flipped, whether USDJPY is still in the trade they entered yesterday. By the time they finish, the signal they were waiting for on AUDUSD has already closed above its trigger level and moved twenty pips without them.
The problem is not discipline. The problem is architecture. A single trader watching nine currency pairs across five timeframes is managing 45 separate data streams with no system to filter noise from signal. Even a disciplined analyst using a clean EMA-based method will miss crossovers, misread ribbon colors, and misalign entries with higher-timeframe trend because the information is spread across too many charts with too many manual steps between observation and action.
The Quadra Zone Entries Indicator was designed to collapse that workflow into a single chart view. It combines an 8-period EMA ribbon that shifts color with trend direction, an ATR-based trade zone system that draws entry, take profit, and stop loss levels automatically on every signal, a nine-symbol screener that shows state at a glance in the top-right corner, and a multi-timeframe trend dashboard in the bottom-right corner. Alerts fire once per confirmed bar through up to four channels so you catch signals in real time without watching the screen.
The indicator is available for both MetaTrader 4 and MetaTrader 5:
- MetaTrader 5: Quadra Zone Entries Indicator MT5
- MetaTrader 4: Quadra Zone Entries Indicator MT4
The sections that follow explain the underlying concepts before walking through the indicator's features. If you already understand EMA ribbons and ATR-based risk sizing, skip to Section 6.
2. What Is EMA Ribbon Trading?
An exponential moving average smooths a price series by applying heavier weighting to recent bars and lighter weighting to older ones. A single EMA line shows whether price is trading above or below a smoothed reference level, but a single line cannot tell you whether a trend is strong, weak, or transitioning.
EMA ribbon trading solves this by plotting a family of EMAs with increasing periods on the same chart. When all the lines are ordered correctly — shortest period on top for a rising market, longest period on top for a falling market — the ribbon is said to be "fanned." A fanned ribbon indicates that multiple lookback windows agree on trend direction. When the lines are tangled or reversing order, the trend is transitional or absent.
The ribbon concept was popularized partly through the work of Daryl Guppy, whose GMMA (Guppy Multiple Moving Average) system used two groups of EMAs — a fast group representing trader activity and a slow group representing investor positioning. The key insight is not any one crossing between lines but the collective agreement or disagreement among the group.
For trading purposes, the ribbon gives you four types of information:
1. Trend direction — whether the fanning is upward-ordered or downward-ordered.
2. Trend strength — the width of the ribbon. A wide, well-separated fan means strong momentum. Compressed, tangled lines mean consolidation or uncertainty.
3. Transition timing — when the short-period lines cross through the longer-period lines, the ribbon is changing state. This transition zone is where entry signals form.
4. Support and resistance context — when price pulls back into the ribbon during a trend, the band of EMAs acts collectively as a dynamic support or resistance zone.
Combining these four readings with a clear visual color cue — warm amber/orange for bullish, neutral gray for bearish or transitional — makes trend assessment near-instant even on a busy chart.
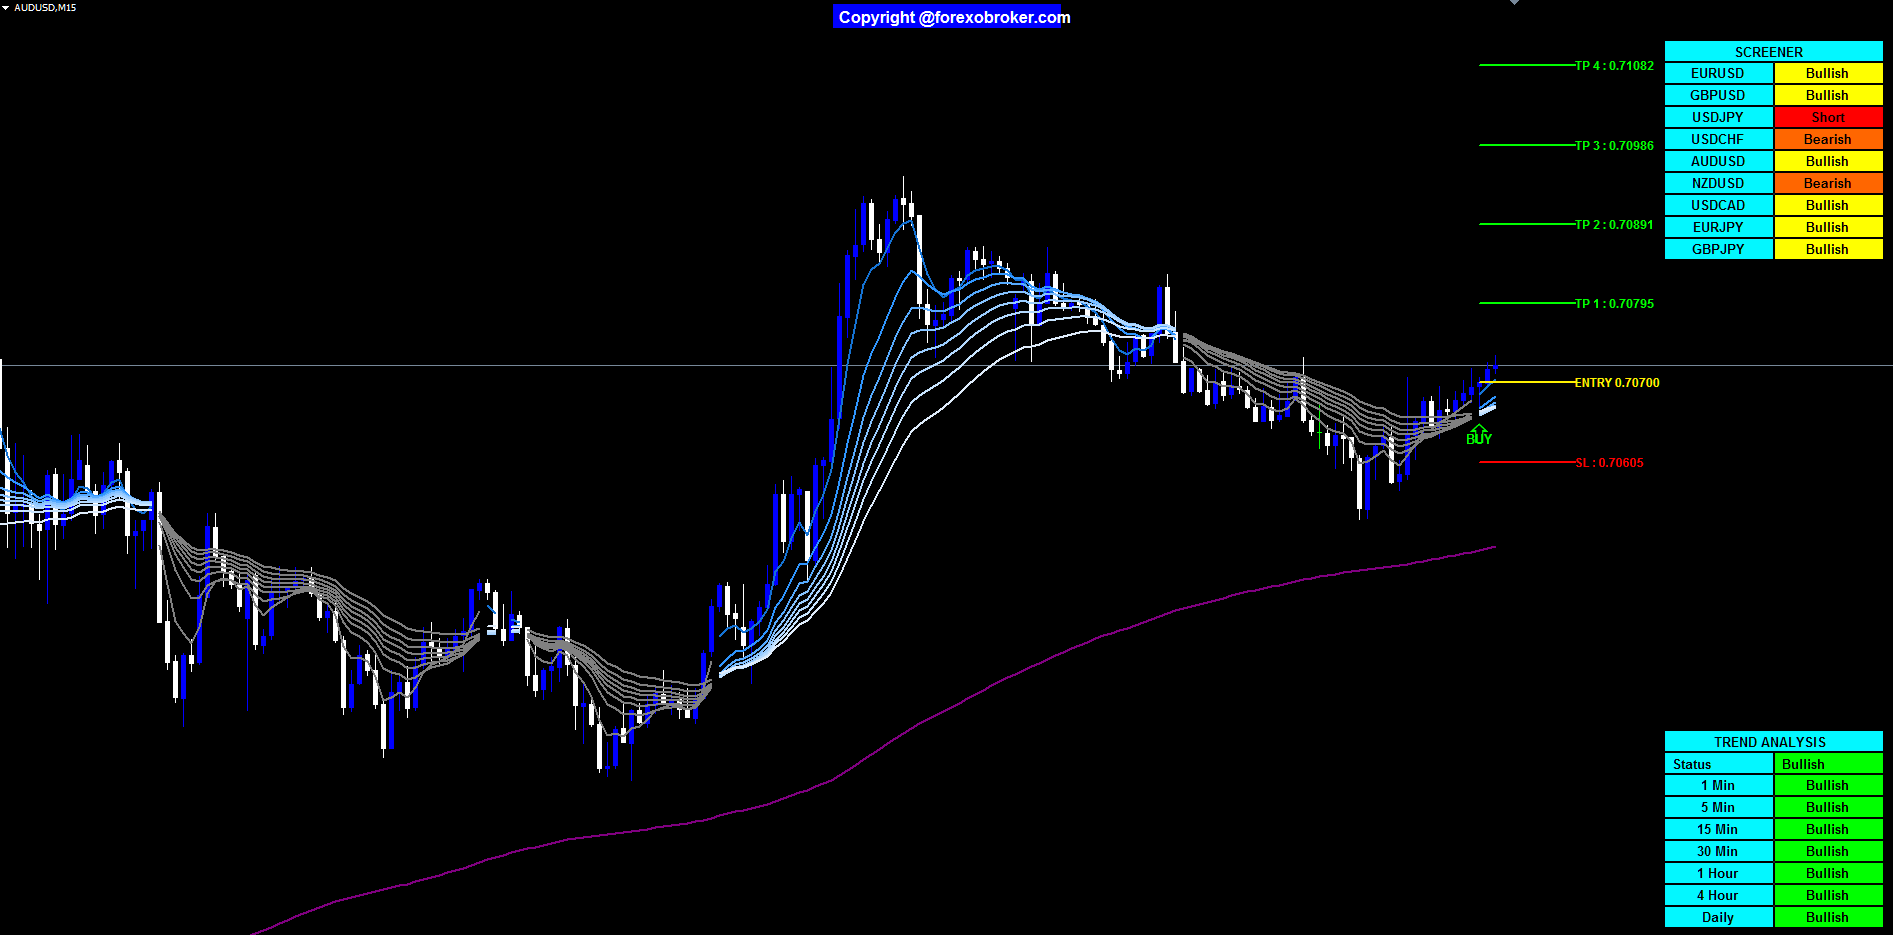
Figure 1: AUDUSD M15 with a fully fanned amber ribbon following a sharp rally. All eight EMA lines are stacked in correct bullish order with the 5-period line leading and the 34-period line trailing. The live BUY trade zone is visible on the right edge of the chart, and both the screener (top-right) and the trend dashboard (bottom-right) are active.
3. The 8-Period EMA System Explained
The Quadra Zone ribbon uses eight EMAs with periods 5, 11, 15, 18, 21, 24, 28, and 34. These periods are not arbitrary. They span a short-term range that captures fast momentum through the 5-period line while including a longer reference through the 34-period line without overlapping into the macro trend territory where the 200-period EMA sits.
In the indicator, the lines are internally labeled EMA1 through EMA8, corresponding to periods 5 through 34. The crossover signal is generated when EMA2 (period 11) crosses over or under EMA8 (period 34). This pairing is deliberate: the 11-period line is reactive enough to catch early trend turns while the 34-period line is stable enough to filter noise. Using the second-shortest and the longest line as the signal pair means the trigger only fires when the leading edge of the ribbon has fully cleared the trailing edge — a condition that indicates the fan has completed its transition.
BUY signal: EMA2 crosses above EMA8. The ribbon begins re-ordering to bullish. An upward arrow labeled "BUY" is printed on the chart at the close of the signal bar.
SELL signal: EMA2 crosses below EMA8. The ribbon begins re-ordering to bearish. A downward arrow labeled "SELL" is printed at the close of the signal bar.
Ribbon color meaning: When the ribbon is in bullish alignment — shorter EMAs above longer ones — the ribbon lines glow in warm amber and orange tones. When the ribbon is in bearish alignment, all lines display in neutral gray. The color switch is immediate and unconditional; the chart tells you the regime without any inspection of individual line positions.
A ninth line, EMA 200, is plotted in purple. This line is visual reference only and is not used in crossover signal generation. Its role is to show the macro trend regime at a glance — when price is above the purple line the bias is structurally bullish; when below, structurally bearish.
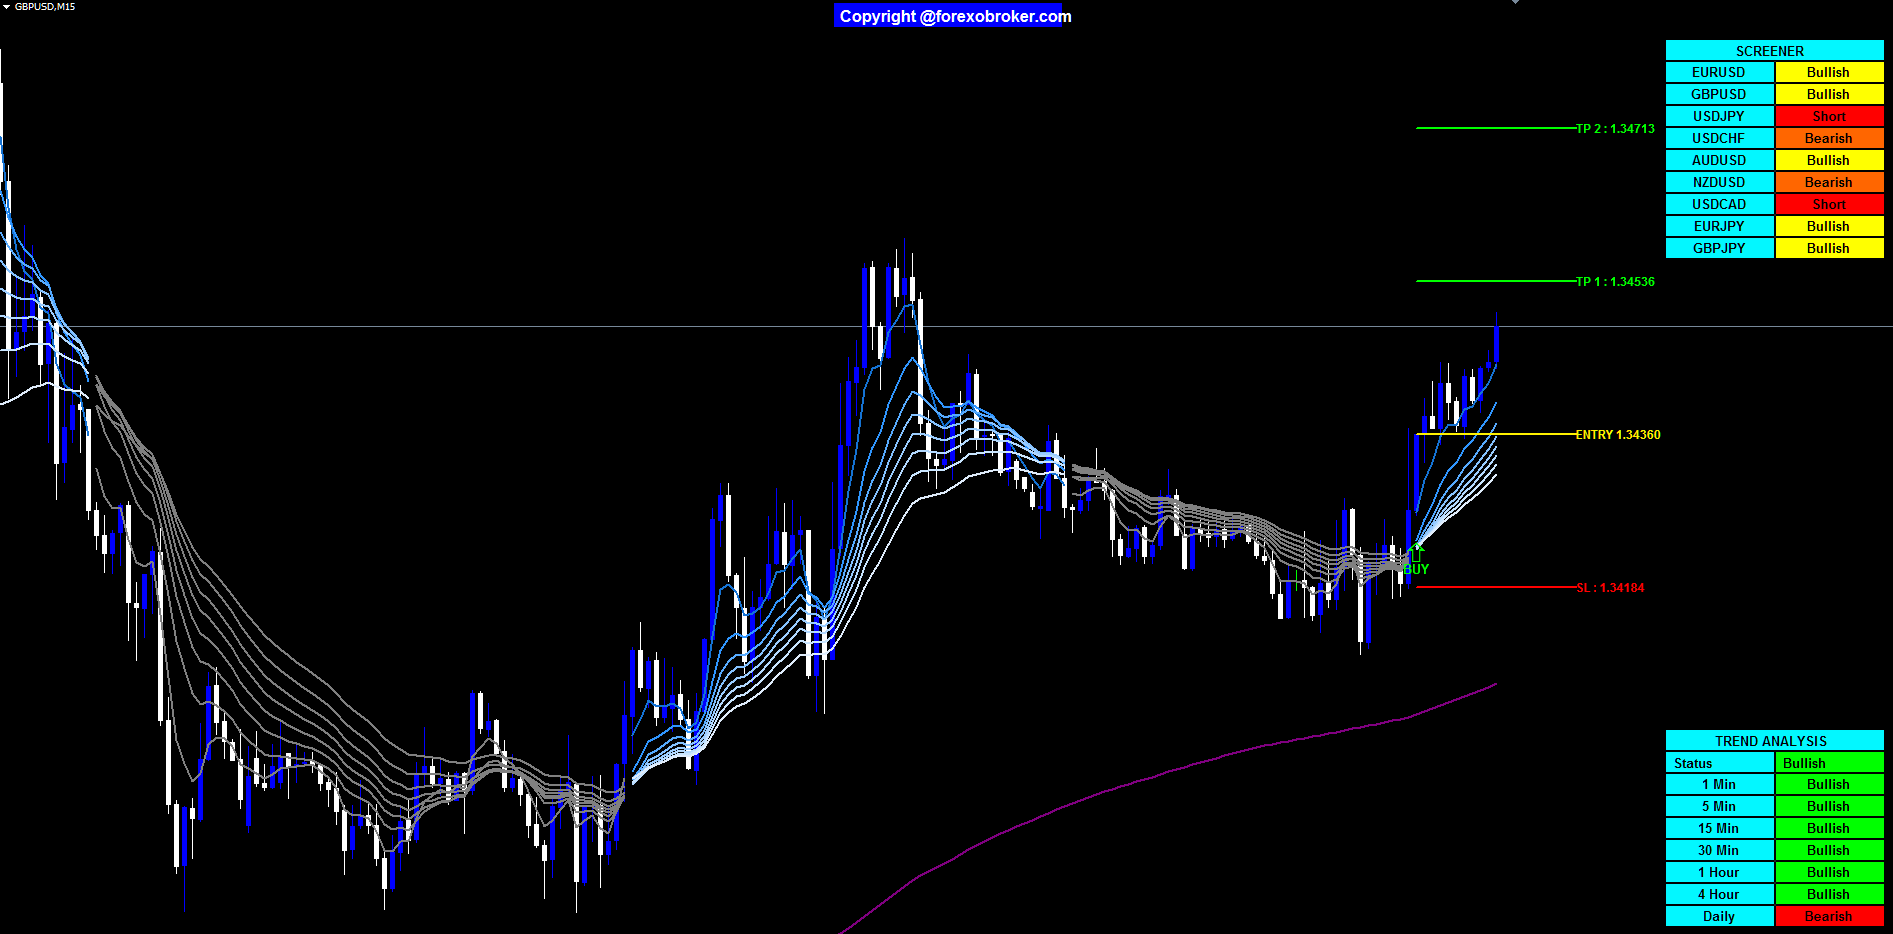
Figure 2: GBPUSD M15 with a BUY signal at the base of a pullback. The ribbon is completing its transition from gray to amber as EMA2 clears EMA8. The yellow Entry line, four green TP levels, and red SL line are drawn automatically from the ATR value at signal bar close. The purple EMA 200 line sits below price, confirming structural bullish bias.
4. ATR-Based Trade Zone System
Every BUY or SELL signal draws a complete trade zone on the chart: an entry line, up to four take profit levels, and a stop loss line. The levels are calculated from the Average True Range (ATR), not from fixed pip distances.
Why ATR Instead of Fixed Pips
Fixed pip stop losses are symmetric in nominal terms but not symmetric in volatility terms. A 30-pip stop on EURUSD during a quiet London morning represents a very different risk than a 30-pip stop during a FOMC release. The trade that was sized correctly at 0.3% equity risk in low volatility becomes a much larger bet when true range expands.
ATR solves this by measuring what price actually does. The 14-period ATR calculates the average of the true range over the past 14 bars, where true range accounts for gaps between sessions. When ATR is wide, stops expand. When ATR is narrow, stops compress. Risk stays proportional to current market conditions rather than to an arbitrary pip count.
How the Trade Zones Are Calculated
At the moment of a BUY signal:
- Entry line (yellow): The close of the signal bar. This is the reference price from which all other levels are calculated.
- Stop Loss line (red): Entry price minus (ATR × ATR_SL_Mult). Default multiplier is 2.0, so the stop sits two ATR units below entry.
- TP1 through TP4 (green lines with labels): Each level is spaced by (ATR × ATR_TP_Factor) from the previous level. With the default factor of 1.0, TP1 is Entry + 1×ATR, TP2 is Entry + 2×ATR, TP3 is Entry + 3×ATR, TP4 is Entry + 4×ATR.
The number of TP levels drawn is controlled by the TP_Count parameter (default 4, maximum 4).
The zone is visually reinforced by two shaded boxes:
- Green TP box: Extends from the entry price up to TP4, filled with translucent green. The right edge of the box extends bar-by-bar as new candles form, so the zone remains live on the chart until the trade closes.
- Red SL box: Extends from the entry price down to the stop loss level, filled with translucent red. Extends identically.
This box-extension behavior means you always see whether current price is inside the trade zone, above the TP levels, or below the stop loss — even if the signal arrow is many bars back on the chart. For SELL signals, the geometry inverts: the stop loss is above entry, TP levels step downward, the green box extends downward, and the red box extends upward.
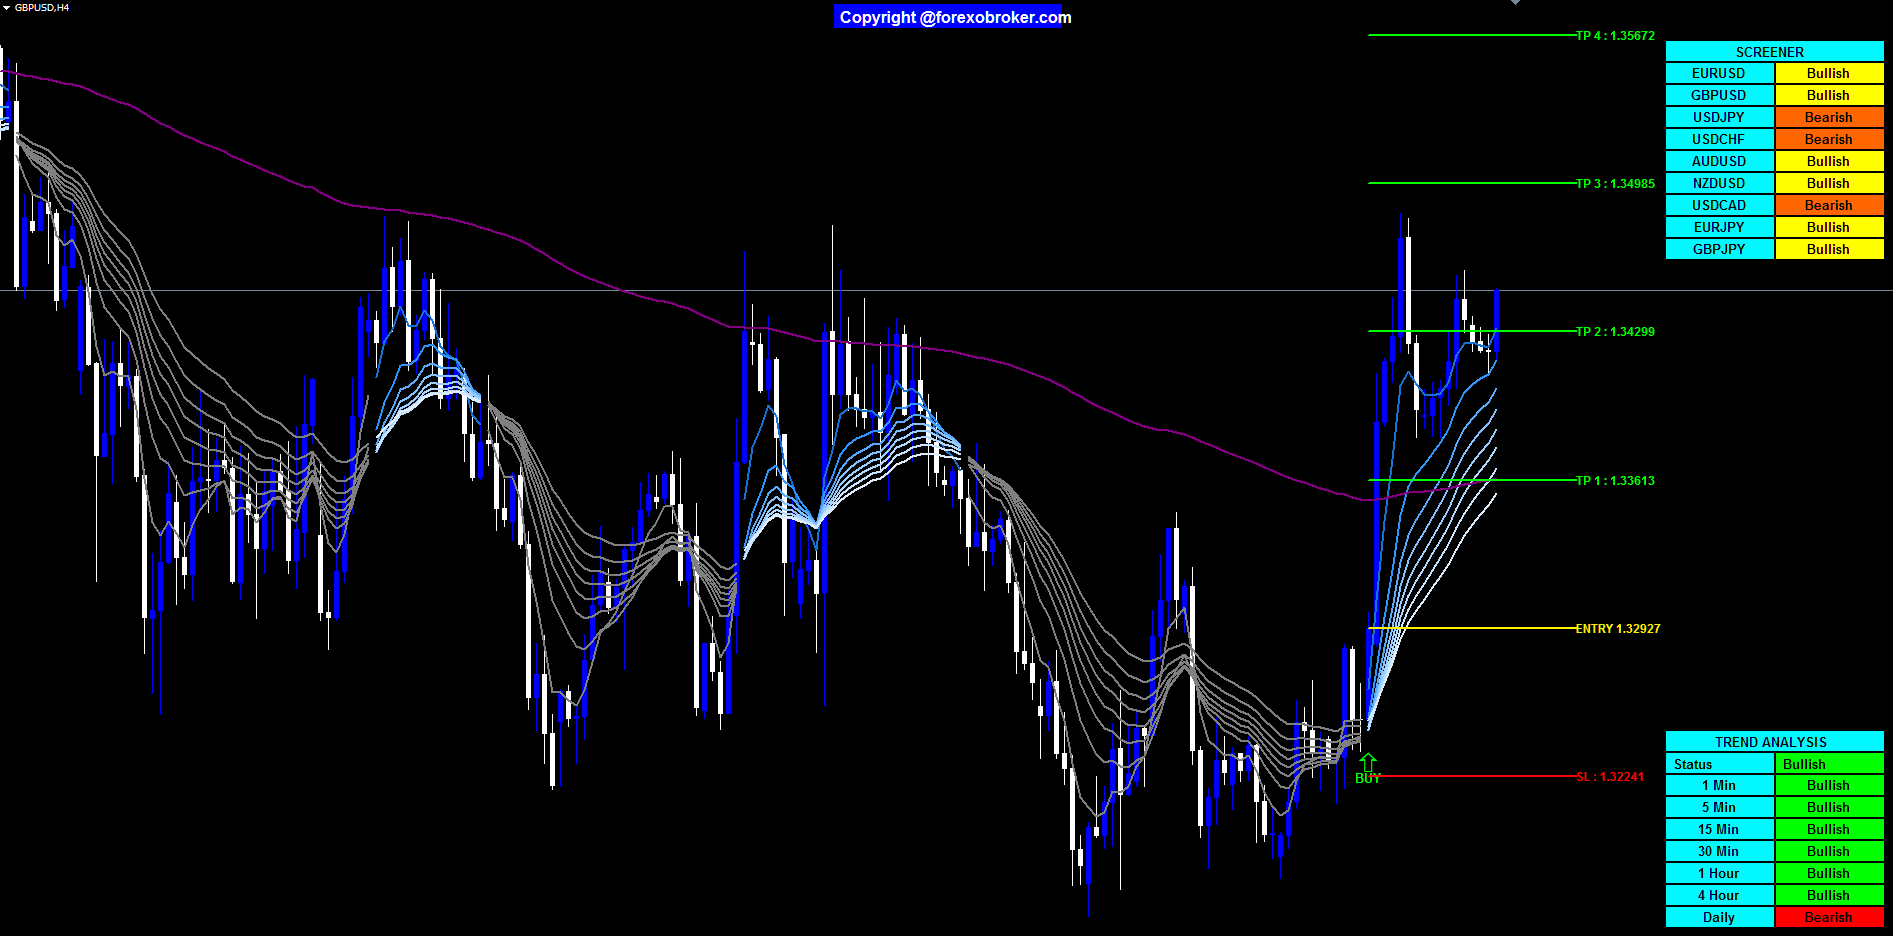
Figure 3: GBPUSD H4 BUY signal. All four TP levels extend to the right in green, the stop loss sits below entry in red, and the yellow Entry line marks the signal bar close. The screener top-right shows uniform bullish state across the nine monitored pairs, and the trend dashboard bottom-right confirms bullish alignment across every timeframe from 5m through Daily — a maximum-confluence setup.
5. Why Manual Multi-Symbol Tracking Fails
Consider a trader running a nine-pair watchlist: EURUSD, GBPUSD, USDJPY, USDCHF, AUDUSD, NZDUSD, USDCAD, EURJPY, GBPJPY. To confirm a trade, they typically want trend agreement on at least two timeframes — say H1 and H4. That is 18 charts to check before entering a position. If they are also referencing a Daily filter, the number rises to 27.
Manual scanning across 27 charts before each trade is not a workflow; it is a second job. The practical outcome is one of three failure modes:
Failure mode 1 — Selective blindness. Traders develop unconscious bias toward pairs they have been watching, missing signals on pairs they scanned last. Recency and fatigue both distort attention.
Failure mode 2 — Timing drift. A crossover that forms on the H1 at 09:00 may be 20 pips into a move by the time a manual scanner reaches that chart at 09:15. The entry price has changed, the risk-reward ratio has changed, and the stop now requires a wider placement to avoid the close of the signal candle.
Failure mode 3 — Inconsistent application. Discretionary scanning means the same trader applies the entry rules slightly differently on different days depending on how fresh they are. Win rate data from backtesting becomes meaningless because live execution does not replicate test conditions.
A screener eliminates all three failure modes. When the scanning logic runs identically on all nine pairs on every tick and presents results in a fixed-position table, the trader's job reduces from observation to decision.
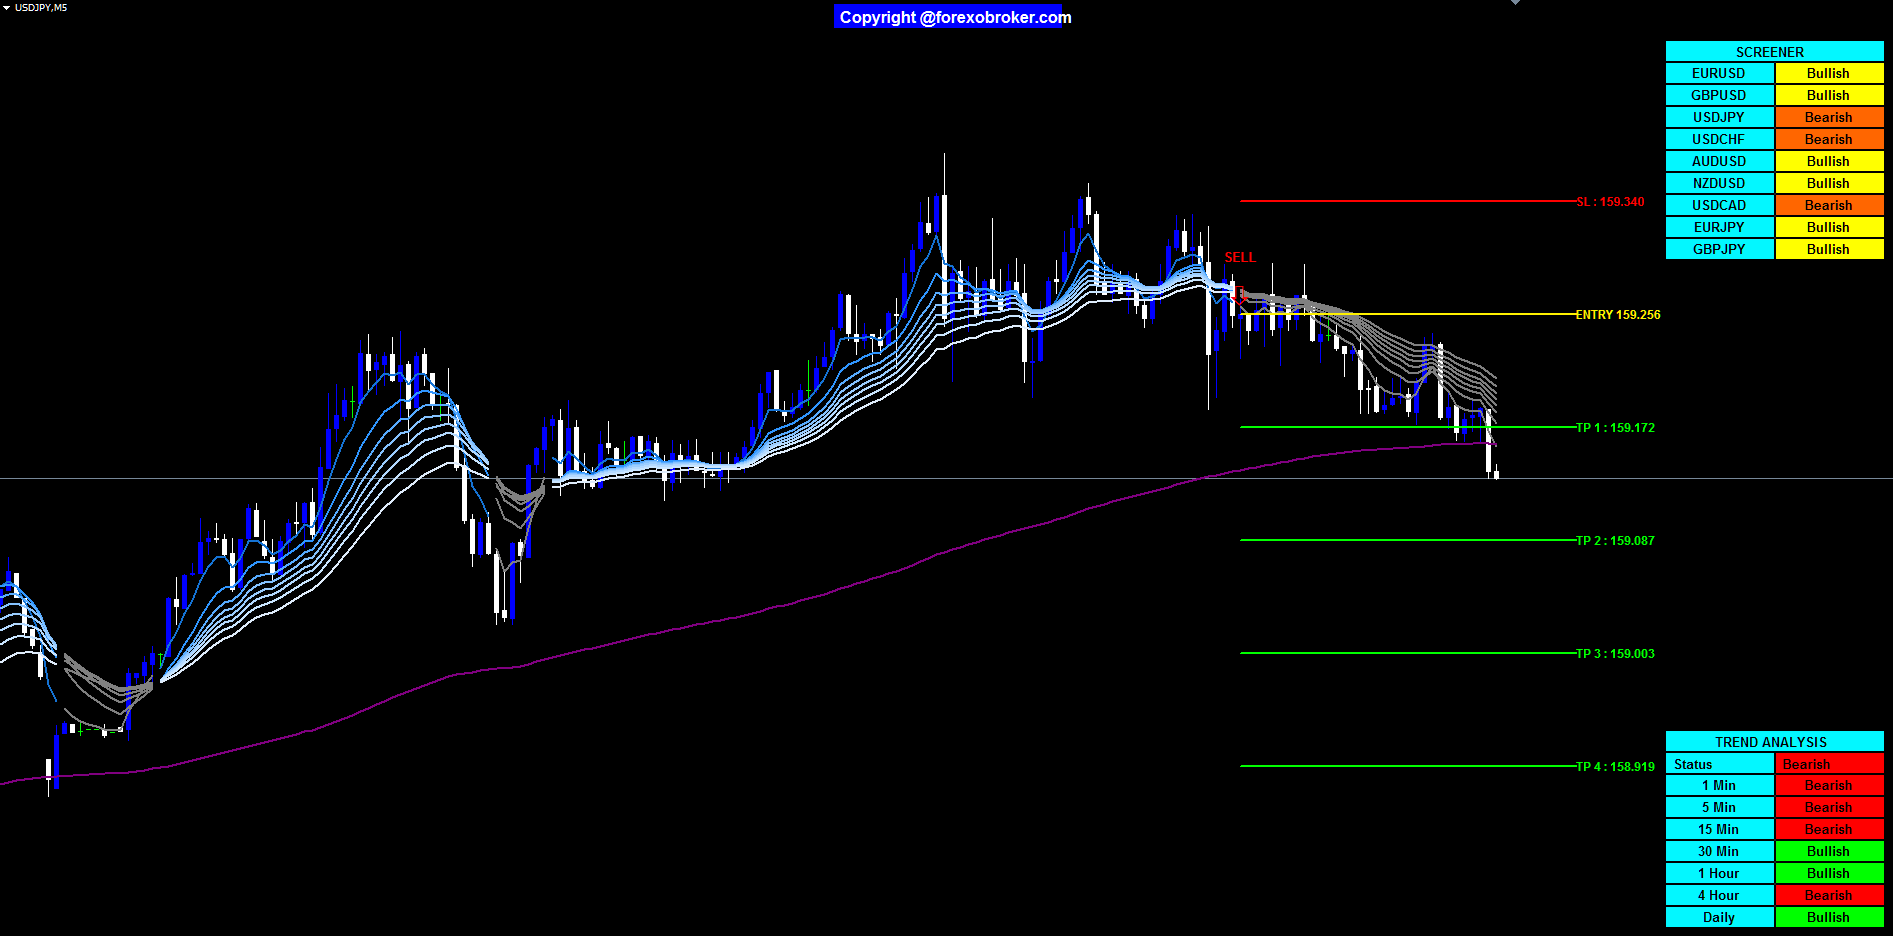
Figure 4: USDJPY M5 SELL signal. The ribbon is gray and the four TP levels step downward below entry with the red SL line above. The screener top-right shows a mix of Bullish and Bearish states across the monitored pairs, giving immediate comparative context that manual chart rotation across nine symbols cannot replicate — each pair's state is snapshotted at the same moment in time.
6. Introducing the Quadra Zone Entries Indicator
The Quadra Zone Entries Indicator brings together every component described above into a single indicator file for both MetaTrader 4 and MetaTrader 5.
Core features:
- 8-line EMA ribbon with automatic amber/gray color switching based on trend alignment
- EMA 200 reference line in purple (visual only, not used in signals)
- BUY/SELL signal arrows at EMA2/EMA8 crossovers — confirmed on closed bars, no repainting
- ATR-based Entry, TP1-TP4, and Stop Loss lines on every signal
- Color-coded TP (green) and SL (red) shaded boxes that extend bar-by-bar until the trade resolves
- 9-symbol screener table showing Long / Short / Bullish / Bearish per symbol (top-right panel)
- Multi-timeframe trend dashboard: fixed 5m, 15m, 30m, 1h, Daily rows plus a combined Status row from majority vote of three user-chosen timeframes (bottom-right panel)
- 4-channel alert system: popup, sound, email, push — fires once per confirmed signal bar
- Fully configurable: all EMA periods, ATR multipliers, TP count, symbols, timeframes, and panel positions are exposed as input parameters
Available on MQL5.com Market for both platforms:
- MetaTrader 5: Quadra Zone Entries Indicator MT5
- MetaTrader 4: Quadra Zone Entries Indicator MT4
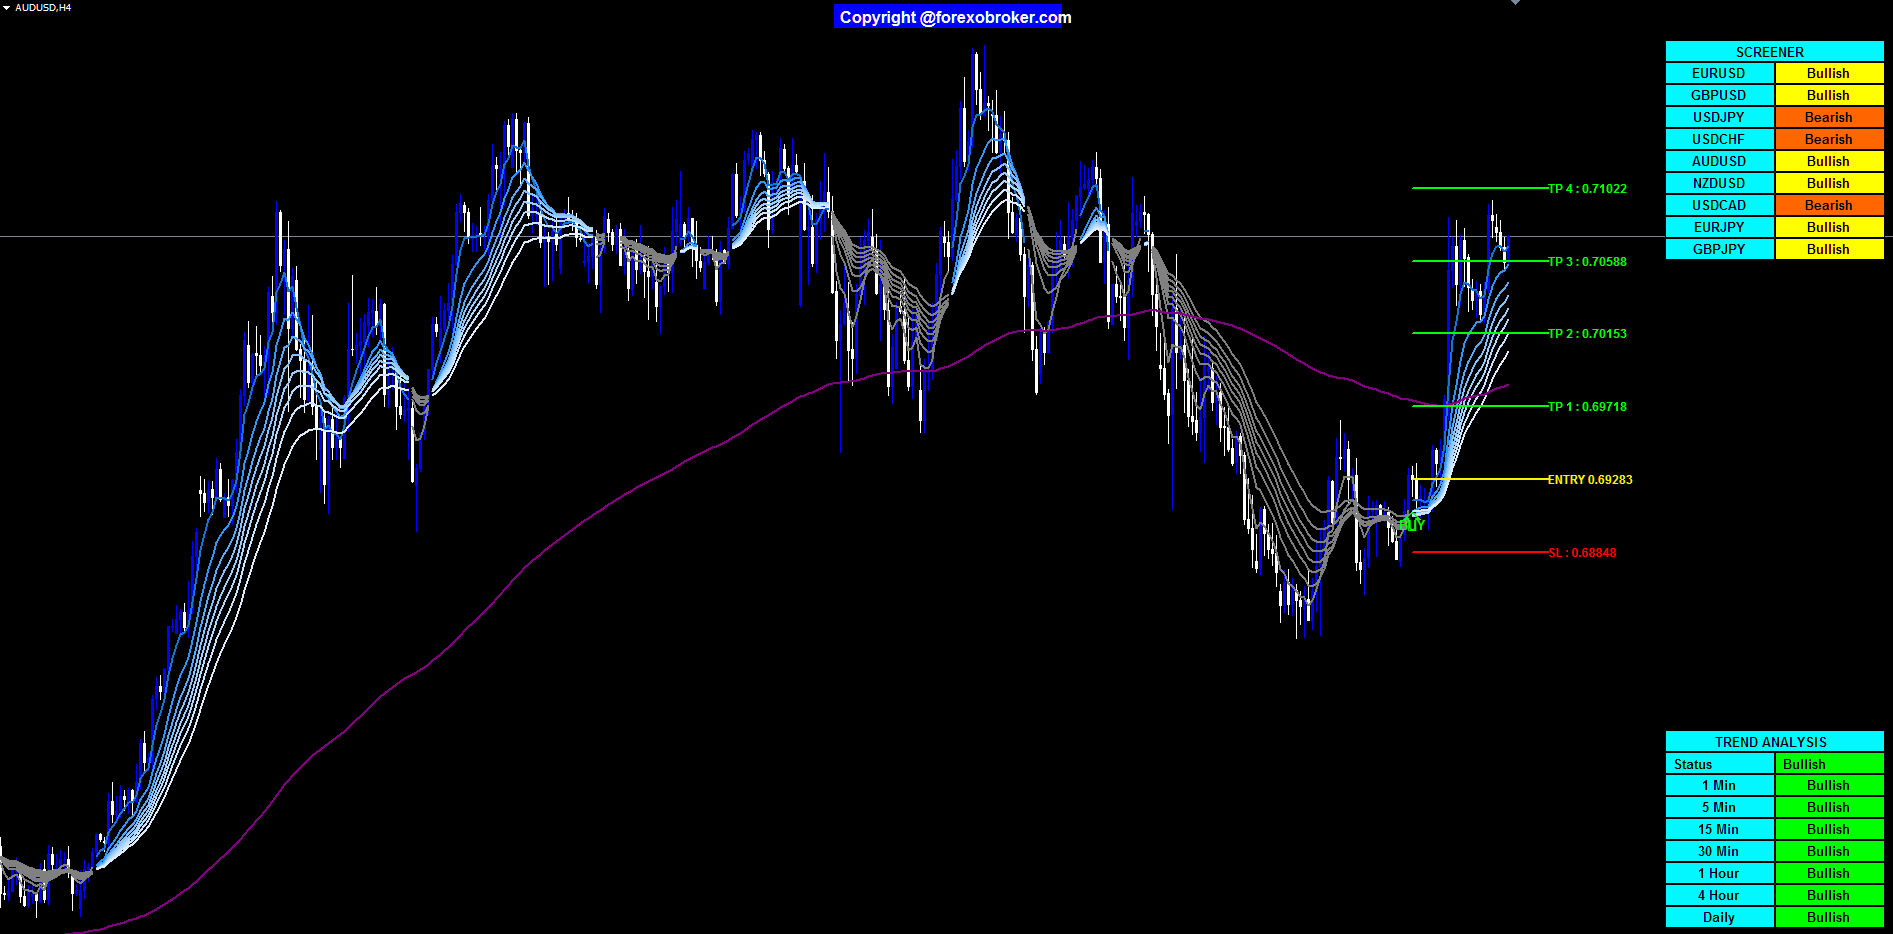
Figure 5: AUDUSD H4. A BUY signal fires as the ribbon begins transitioning from gray to amber after a pullback into the purple EMA 200. The yellow Entry line is marked, four green TP levels step upward, and the red SL line sits below. The screener top-right shows widespread Bullish states across the nine pairs, and the trend dashboard bottom-right reports bullish alignment across the monitored timeframes — the classic high-confidence setup where signal, screener, and dashboard agree in a single chart view.
7. How the Signal Engine Works
Crossover Detection
On each bar close, the indicator compares EMA2 (period 11 by default) against EMA8 (period 34 by default). A BUY crossover is confirmed when EMA2 is above EMA8 on the current closed bar and was below EMA8 on the previous bar. A SELL crossover confirms the inverse. Because the comparison happens on fully closed bars, the signal arrow never moves or repaints after it is drawn.
The one-bar confirmation requirement is significant. Many EMA crossover systems draw signals mid-bar, when the fast EMA has crossed the slow EMA at the current tick price. These signals vanish if the bar closes back on the other side of the slow line. The Quadra Zone Entries system only prints after the bar closes with the crossover confirmed, which means every visible arrow on the chart represents a crossover that actually held through bar close.
Trade Zone Drawing
When a signal arrow is printed, the indicator captures four values:
- The close price of the signal bar (Entry)
- The ATR value at the signal bar (calculated using the last 14 bars by default)
- The timestamp of the signal bar
- The direction (BUY or SELL)
From these four values, it calculates all zone levels and draws the following graphical objects:
- One horizontal line at Entry (yellow)
- One horizontal line at Stop Loss (red)
- Up to four horizontal lines at TP1-TP4 (green) with text labels
- One shaded rectangle from Entry to SL (red)
- One shaded rectangle from Entry to TP4 (green)
After the initial draw, on every subsequent tick the right edge of both rectangles is extended to the current bar. This gives the live impression of the trade zone "following" the chart in real time. When a new crossover signal appears in the opposite direction, the previous trade zone stops extending.
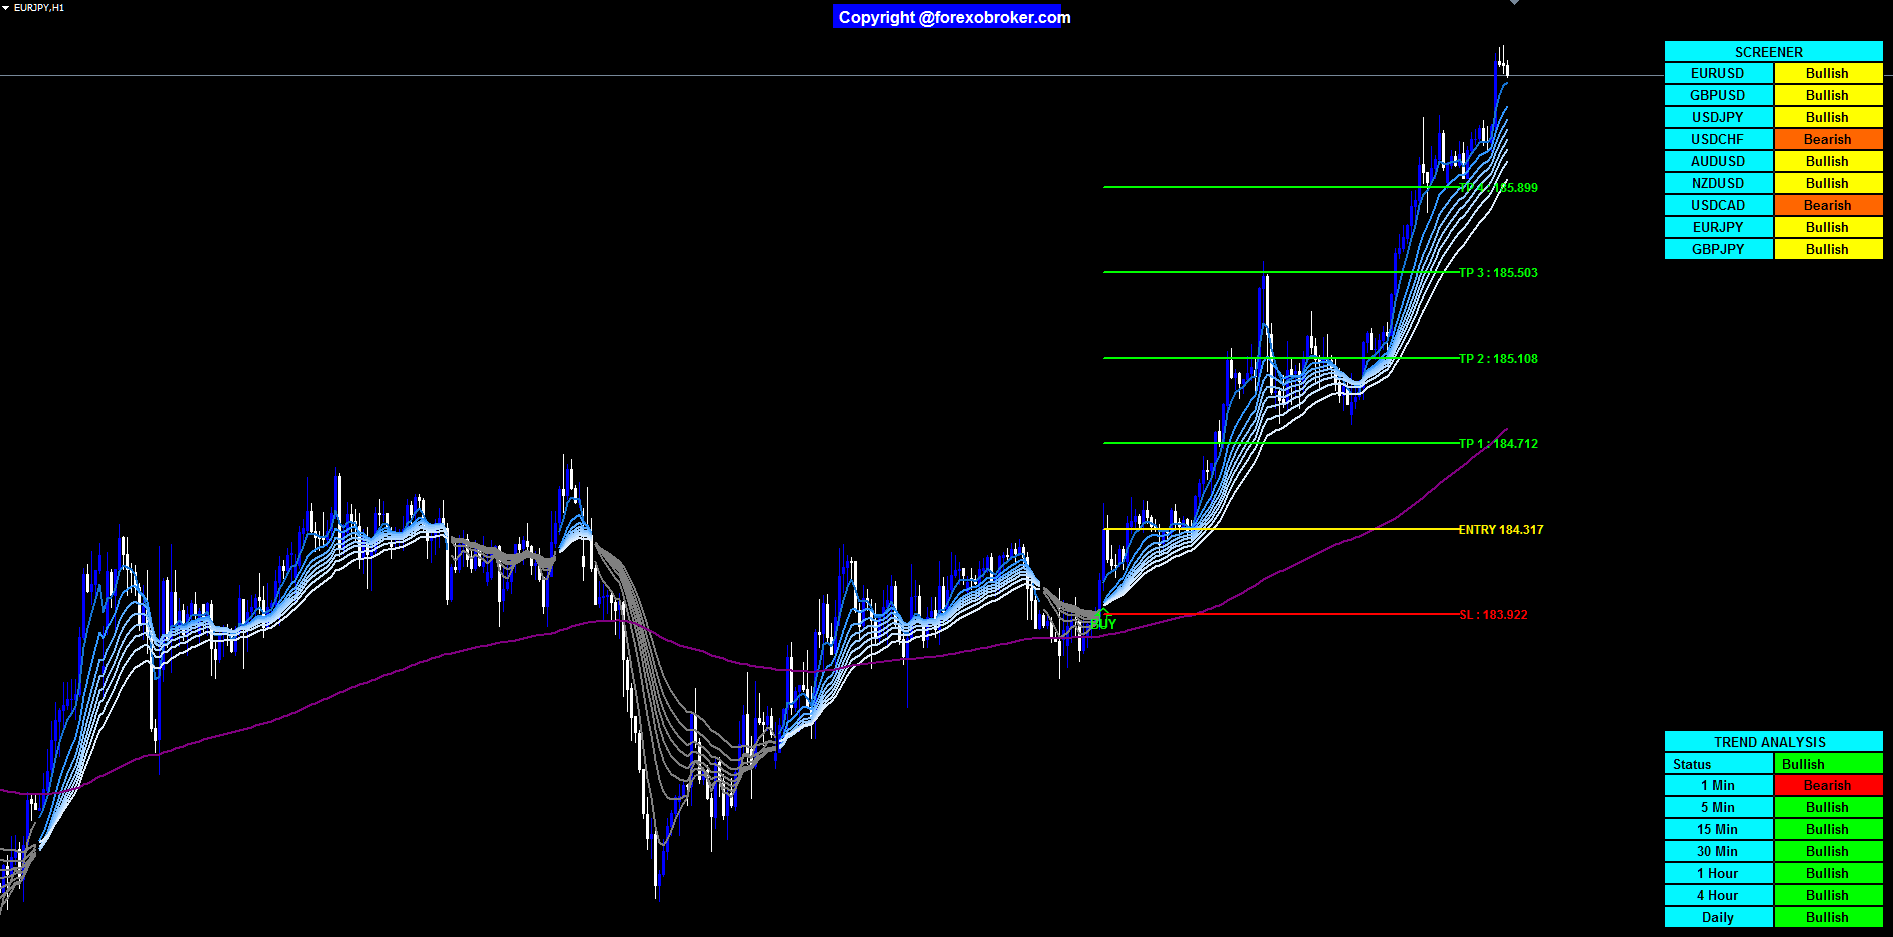
Figure 6: EURJPY H1. A BUY arrow prints as the ribbon completes its transition to full amber. All four TP levels are drawn immediately from ATR at signal bar close, with the red SL line below the yellow Entry line. The trade zone extends right with each new bar, and the screener top-right confirms uniform bullish state across the monitored pairs while the trend dashboard bottom-right shows agreement on all timeframes.
8. The Multi-Symbol Screener
What It Shows
The screener occupies a table panel in the top-right corner of the chart. It displays one row per configured symbol (up to 9) and shows the current state of that symbol on the chart's active timeframe.
Each row displays one of four states:
| State | Meaning |
|---|---|
| Long | A BUY signal has fired and the trade zone is still active |
| Short | A SELL signal has fired and the trade zone is still active |
| Bullish | The ribbon is in amber alignment but no active trade zone |
| Bearish | The ribbon is in gray alignment but no active trade zone |
The color coding reinforces the state: green tones for Long and Bullish, amber/yellow for neutral Bullish, red/orange for Short and Bearish.
How to Use the Screener
The screener is a prioritization tool, not a signal generator. When you open the platform and see that seven of nine pairs show Bullish and two show Long, you know the session has broad bullish momentum. You can prioritize the Long pairs for active management and watch the Bullish pairs for a fresh BUY setup.
When the screener shows mixed states — some Bullish, some Bearish — it signals that the market lacks directional consensus. This warns you against forcing trades and suggests waiting for a cleaner alignment session.
The nine default symbols (EURUSD, GBPUSD, USDJPY, USDCHF, AUDUSD, NZDUSD, USDCAD, EURJPY, GBPJPY) cover the major and major cross pairs. Any symbol available in your broker's Market Watch can be substituted through the Symbol1 through Symbol9 input parameters.
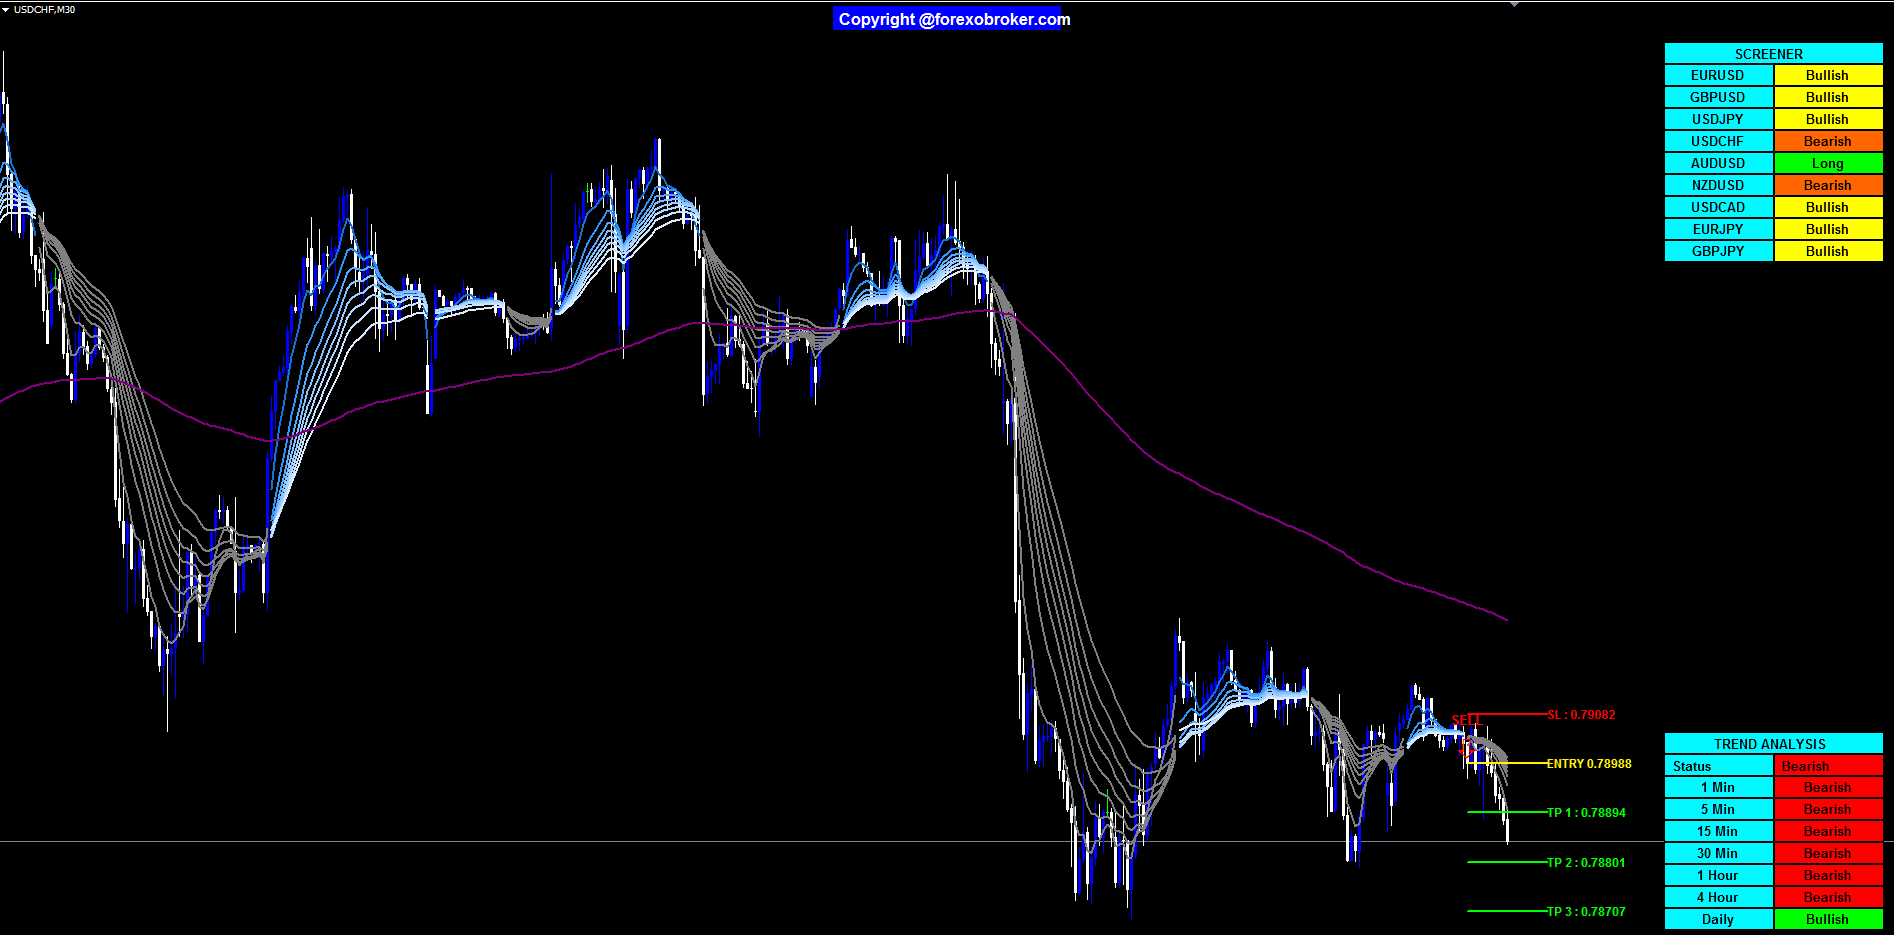
Figure 7: USDCHF M30 SELL signal at the breakdown of an amber-to-gray ribbon transition. The four TP levels step downward below the yellow Entry line and the red SL sits above. The screener in the top-right illustrates the full range of states the panel can display — a mix of Long (live short trade zones on other pairs), Bullish (amber ribbon with no active trade), and Bearish (gray ribbon with no active trade). The trader sees nine parallel narratives at once without switching charts.
9. The Multi-Timeframe Trend Dashboard
Panel Layout
The trend dashboard sits in the bottom-right corner of the chart. It contains a fixed set of rows — one for each monitored timeframe — plus a combined status row at the top.
| Row | Timeframe |
|---|---|
| Status | Combined majority vote |
| 5m | 5-minute |
| 15m | 15-minute |
| 30m | 30-minute |
| 1h | 1-hour |
| Daily | Daily |
Each cell shows whether the ribbon is in bullish or bearish alignment on that timeframe for the active symbol. Green for bullish, red for bearish.
The Combined Status Row
The Status row shows the majority vote of three user-chosen timeframes. The default combination is 5m, 15m, and 30m, configured through CombinedTF1 , CombinedTF2 , and CombinedTF3 . If two or three of the three chosen timeframes are bullish, Status shows Bullish. If two or three are bearish, it shows Bearish.
This single cell answers the core multi-timeframe question without requiring you to read and mentally synthesize multiple rows.
Practical Application
The dashboard and screener serve different axes of the same question. The screener answers "which symbols are trending?" The dashboard answers "on which timeframes is this symbol trending?"
A high-confidence setup occurs when:
- The screener shows the symbol as Long or Bullish
- The dashboard shows bullish alignment on the higher timeframes you use for context
- The Status row shows Bullish
- A BUY signal arrow has just printed on the active timeframe
All four conditions are visible in a single chart view without switching windows.
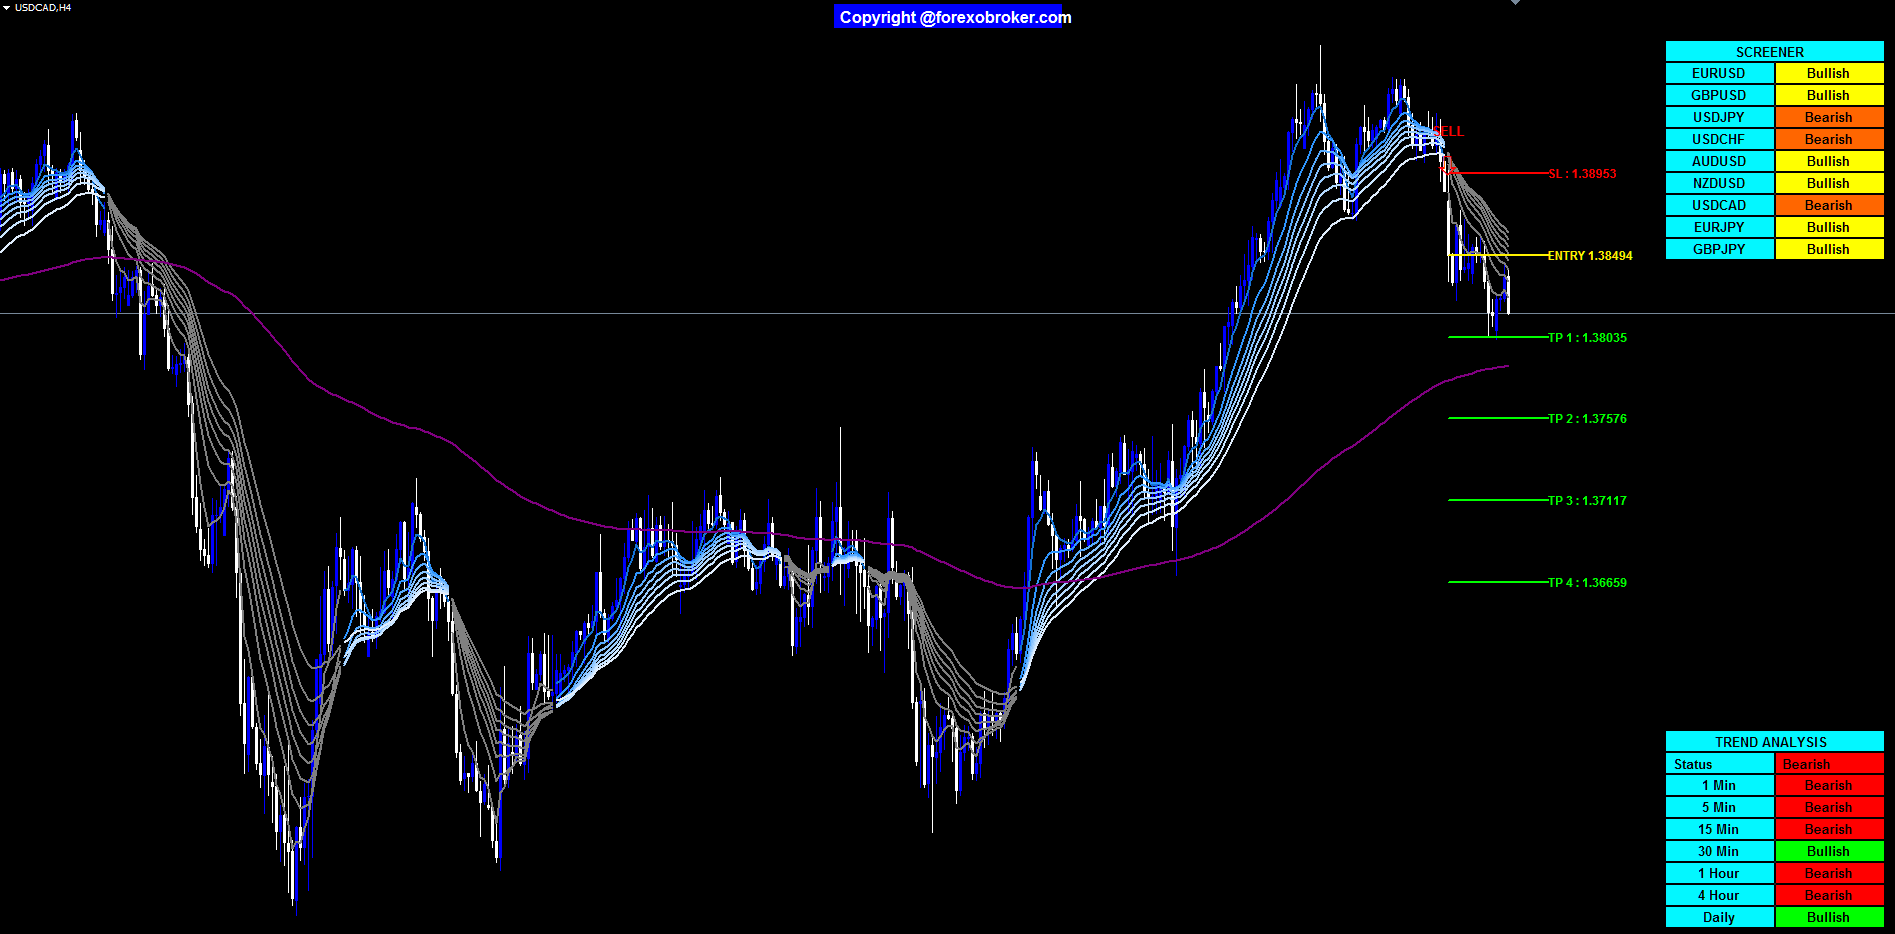
Figure 8: USDCAD H4 SELL signal. The yellow Entry line is marked at signal bar close, four green TP levels step downward toward the lower right of the chart, and the red SL sits above entry. The trend dashboard in the bottom-right reports the ribbon state for USDCAD on 5m, 15m, 30m, 1h, and Daily — each cell color-coded bullish or bearish — with the Status row summarizing the majority vote of the three chosen timeframes.
10. The 4-Channel Alert System
The indicator supports four independent alert delivery methods. Each can be enabled or disabled separately.
| Channel | Input Parameter | Default | Delivery |
|---|---|---|---|
| Popup | EnablePopupAlert | true | On-screen dialog box in MetaTrader |
| Sound | EnableSoundAlert | true | System sound via MetaTrader audio |
| EnableEmailAlert | false | Email via MT4/MT5 configured SMTP server | |
| Push | EnablePushAlert | false | Push notification to MetaTrader mobile app |
Alert Timing
Alerts fire once per signal, after the bar closes with the crossover confirmed. This is consistent with the signal drawing logic: the alert fires at the same moment the arrow is printed, and only once. No alert fires on intermediate ticks before bar close, and no repeat alert fires on subsequent ticks of the same signal bar.
This means you can leave sound and popup alerts active on a background chart without being flooded by multiple alerts for a single signal. Each BUY or SELL event generates exactly one alert across all enabled channels.
Alert Message Format
The alert message includes: the symbol name, the timeframe, the signal direction (BUY or SELL), and the signal price. This gives you enough information to act — or to decide not to act — without opening the chart.
Email and Push Configuration
Email alerts require MetaTrader's SMTP configuration under Tools > Options > Email. Push notifications require a linked MetaQuotes ID under Tools > Options > Notifications. These are platform-level settings independent of the indicator.
11. Practical Trading Workflow
The following six-step workflow describes how to use the indicator in a live session, trading EMA crossover signals with ATR-based risk filtered by multi-timeframe trend confirmation.
Step 1 — Set your trading timeframe. Attach the indicator to the chart of your primary trading timeframe. Common choices are M15 for intraday traders, H1 for swing traders who want several signals per week, and H4 for position traders.
Step 2 — Scan the screener at session open. Read the screener table. Identify which pairs are Bullish or Long (for buy bias) or Bearish or Short (for sell bias). Pairs showing opposite color to your session bias can be deprioritized.
Step 3 — Check the dashboard for timeframe confluence. For your preferred pairs, check the trend dashboard. Confirm that the higher timeframes (H1, Daily) agree with the direction you are considering. When the Status row matches the signal direction, confluence is present.
Step 4 — Wait for a fresh signal arrow. Do not enter manually. Let the indicator print a BUY or SELL arrow on a closed bar. This ensures you are acting on a confirmed crossover, not a mid-bar formation that may reverse before close.
Step 5 — Use the trade zone for risk sizing. When the signal arrow prints, the entry, TP1-TP4, and SL lines are drawn automatically. Use the SL distance to calculate your position size based on your account risk percentage. Enter at or near the Entry line.
Step 6 — Manage with the zone boxes. After entry, the green and red boxes extend with each new bar. When price reaches TP1, consider moving the stop to breakeven. At TP2, consider partial closure. The remaining position can ride to TP3 or TP4, with the active zone boxes always showing how much room remains.
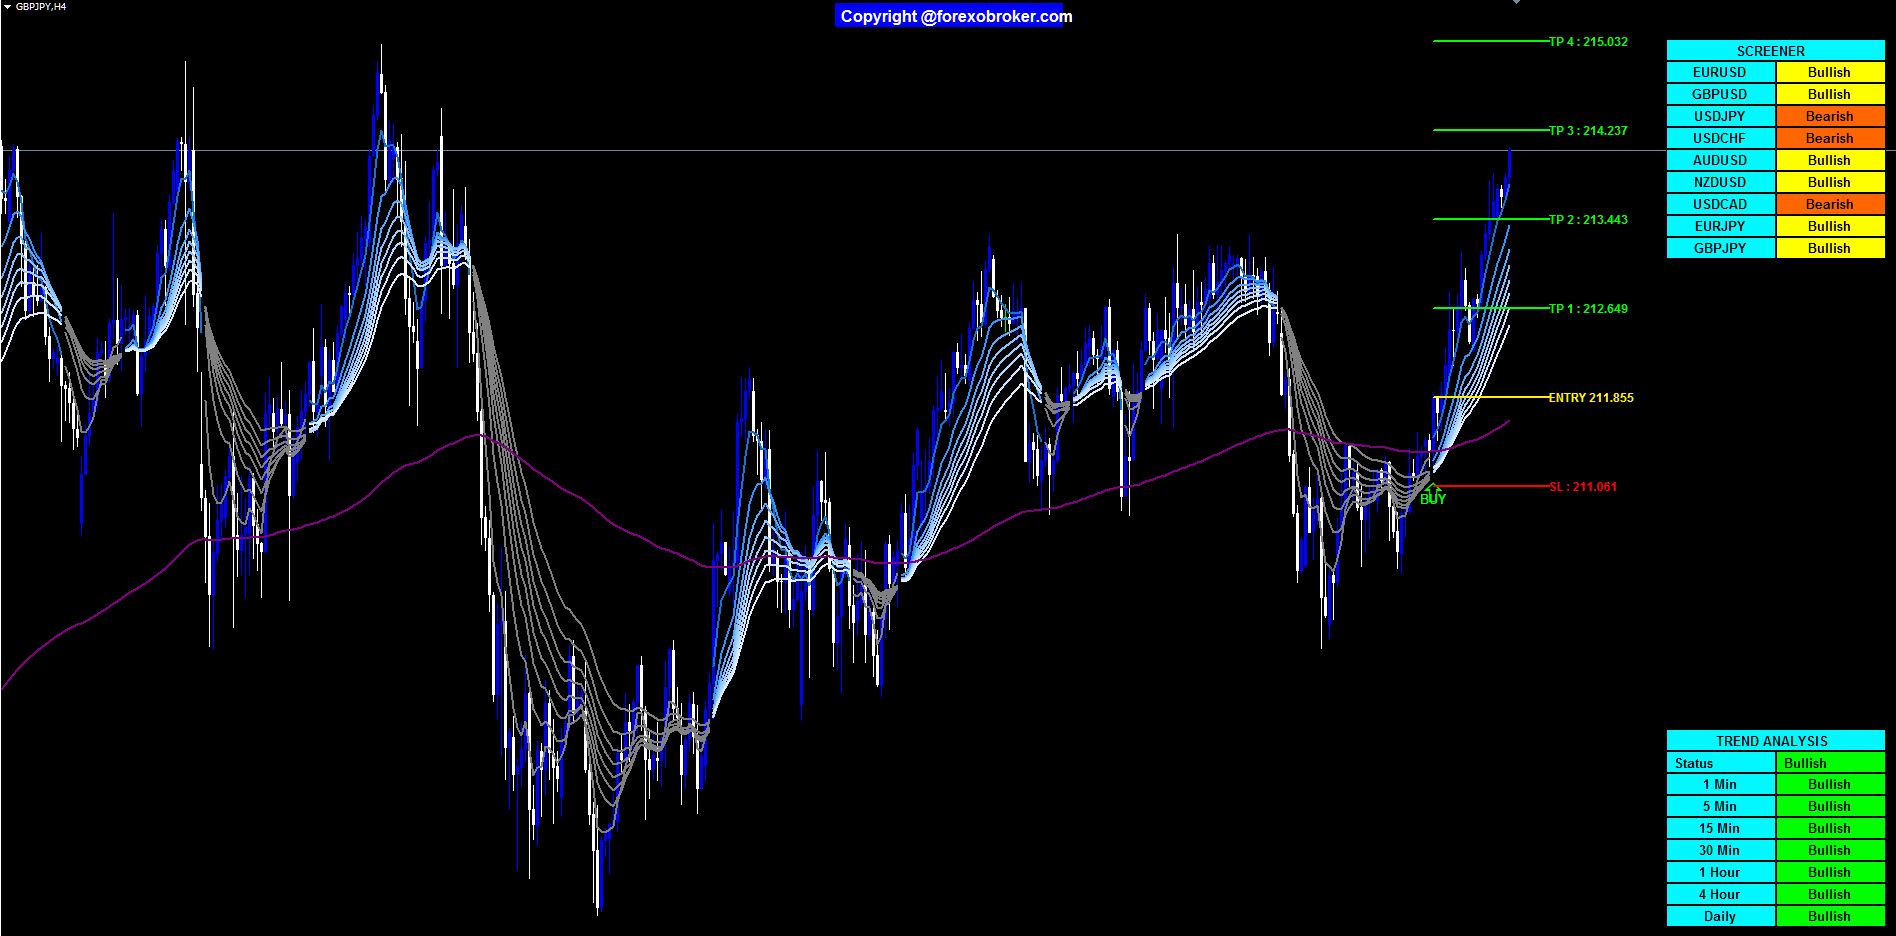
Figure 9: GBPJPY H4 BUY signal with a fully fanned amber ribbon. All four TP levels and the SL are drawn automatically from the ATR value at signal bar close, and the zone extends bar-by-bar as new candles form. GBPJPY has a volatility profile distinct from the EUR and USD majors, and the ATR-based TP spacing adapts to it without any symbol-specific configuration.
12. Parameter Reference
EMA Settings
| Parameter | Default | Description |
|---|---|---|
| ShowRibbon | true | Show or hide the 8-line EMA ribbon |
| EMA1_Length | 5 | Period for the first (fastest) EMA ribbon line |
| EMA2_Length | 11 | Period for EMA2 — crossover signal fast line |
| EMA3_Length | 15 | Period for the third ribbon line |
| EMA4_Length | 18 | Period for the fourth ribbon line |
| EMA5_Length | 21 | Period for the fifth ribbon line |
| EMA6_Length | 24 | Period for the sixth ribbon line |
| EMA7_Length | 28 | Period for the seventh ribbon line |
| EMA8_Length | 34 | Period for EMA8 — crossover signal slow line |
| ExtraEMA_Length | 200 | Period for the EMA 200 reference line (purple, visual only) |
The crossover signal is always generated between EMA2 and EMA8. Adjusting these periods changes signal frequency. Lower values (e.g., 8 and 21) produce more frequent signals with more false positives; higher values (e.g., 21 and 55) produce fewer signals with more lag.
Trade Management Settings
| Parameter | Default | Description |
|---|---|---|
| TP_Count | 4 | Number of TP levels to draw (1 to 4) |
| ATR_SL_Mult | 2.0 | ATR multiplier for stop loss distance from entry |
| ATR_TP_Factor | 1.0 | ATR multiplier per TP level step |
| ATR_Length | 14 | Lookback period for ATR calculation |
| ShowTP_SL_Lines | true | Show or hide TP and SL lines and boxes |
Increasing ATR_SL_Mult from 2.0 to 3.0 widens the stop loss, reducing the probability of being stopped out by noise but also reducing the maximum position size for a given risk percentage. Decreasing ATR_TP_Factor from 1.0 to 0.75 clusters the TP levels closer together, which is appropriate for scalping contexts where momentum decays quickly.
Dashboard and Screener Settings
| Parameter | Default | Description |
|---|---|---|
| ShowDashboard | true | Show or hide the multi-timeframe dashboard |
| DashboardPosition | Bottom Right | Panel position on the chart |
| CombinedTF1 | 5 Min | First timeframe for the combined Status row |
| CombinedTF2 | 15 Min | Second timeframe for the combined Status row |
| CombinedTF3 | 30 Min | Third timeframe for the combined Status row |
| WidgetBorderColor | Black | Border color for both dashboard and screener panels |
| ShowScreener | true | Show or hide the multi-symbol screener |
| ScreenerPosition | Top Right | Screener panel position on the chart |
| MaxSymbols | 9 | Number of symbols to display (1 to 9) |
| Symbol1 | EURUSD | First screener symbol |
| Symbol2 | GBPUSD | Second screener symbol |
| Symbol3 | USDJPY | Third screener symbol |
| Symbol4 | USDCHF | Fourth screener symbol |
| Symbol5 | AUDUSD | Fifth screener symbol |
| Symbol6 | NZDUSD | Sixth screener symbol |
| Symbol7 | USDCAD | Seventh screener symbol |
| Symbol8 | EURJPY | Eighth screener symbol |
| Symbol9 | GBPJPY | Ninth screener symbol |
Alert Settings
| Parameter | Default | Description |
|---|---|---|
| EnablePopupAlert | true | Enable on-screen popup alert on signal |
| EnableSoundAlert | true | Enable system sound alert on signal |
| EnableEmailAlert | false | Enable email alert (requires MT4/MT5 SMTP config) |
| EnablePushAlert | false | Enable push alert (requires MetaQuotes ID config) |
All four channels are independent. Any combination can be active simultaneously. Alerts fire once per confirmed signal bar and do not repeat on subsequent ticks.
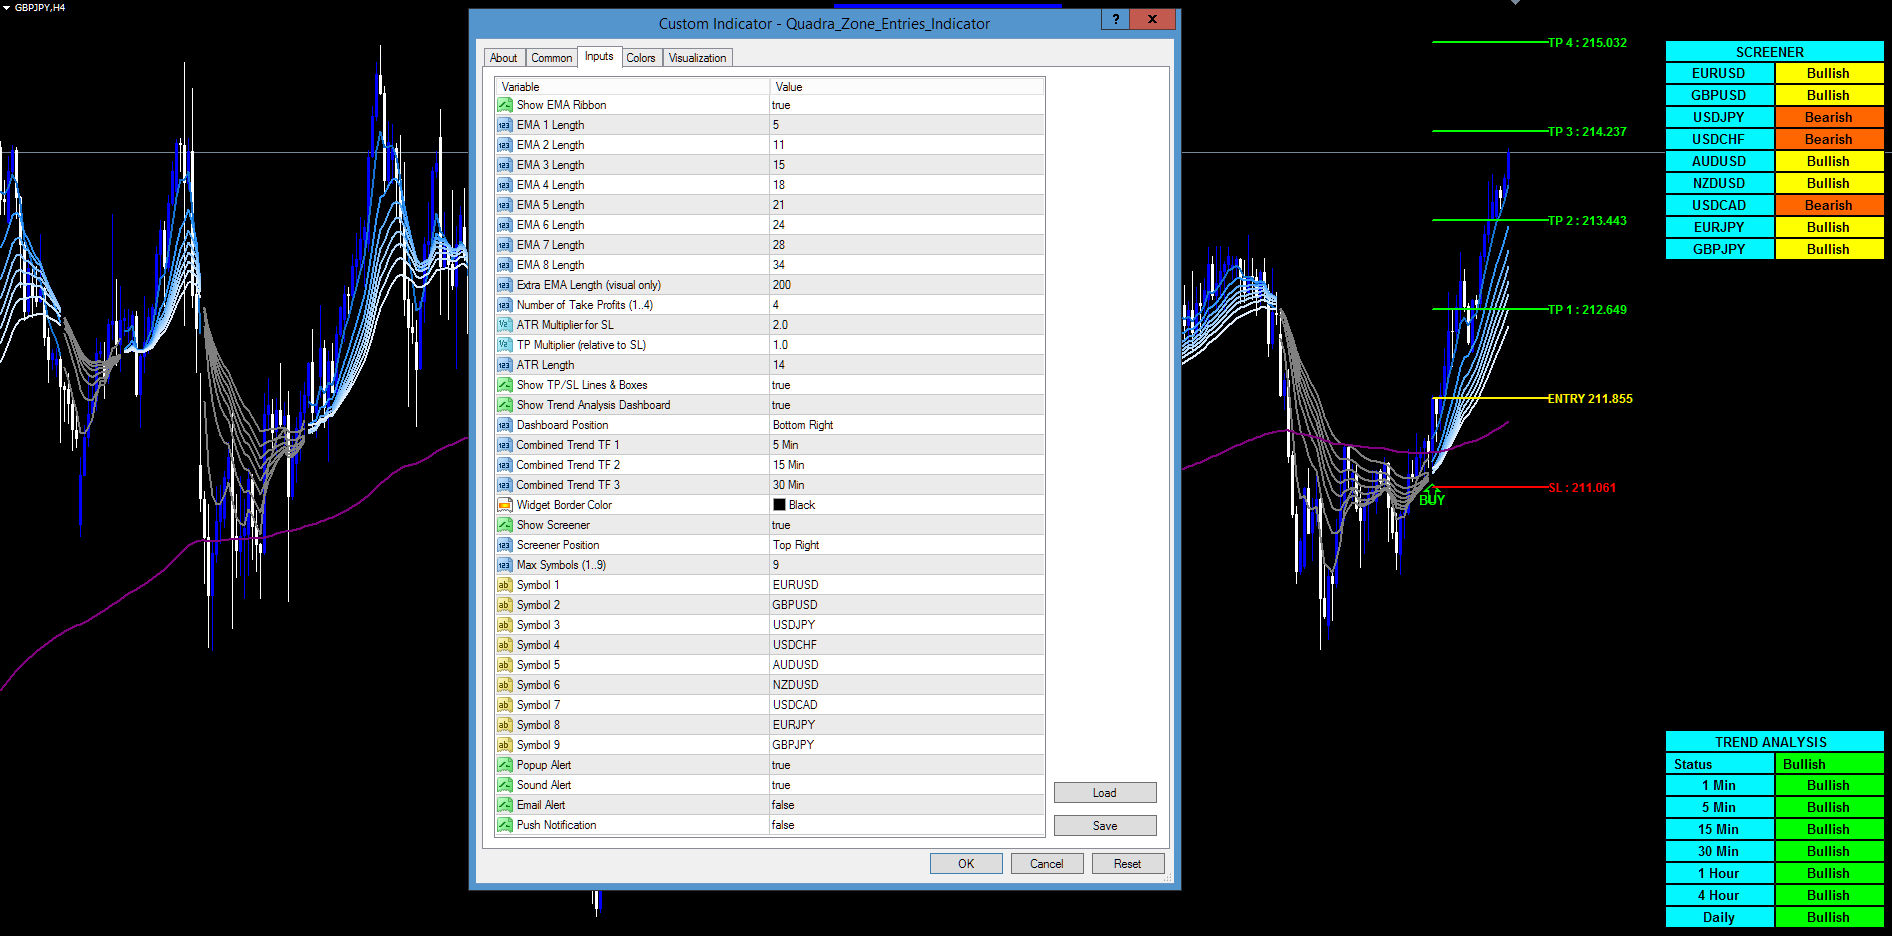
Figure 10: The MetaTrader 4 Custom Indicator input dialog for Quadra Zone Entries (loaded on GBPJPY H4), showing all parameters grouped by category — EMA periods, ATR trade-management settings, dashboard and screener controls, symbol list, and alert toggles. The same parameters are exposed in the MT5 version.
13. Installation
The Quadra Zone Entries Indicator is distributed through the MQL5.com Market and installs automatically after purchase.
- Open MetaTrader 4 or MetaTrader 5.
- Open the Navigator panel (Ctrl+N if not visible).
- Navigate to Indicators > Market.
- Find Quadra Zone Entries in the list and drag it onto any chart.
- The input dialog opens. Adjust parameters as needed and click OK.
The indicator loads, draws the ribbon, calculates trade zones for all historical signals on the chart, and populates the screener and dashboard panels immediately. A free demo version is available for testing before purchase.
If the screener shows blank cells for some symbols, confirm those symbols are available in your broker's Market Watch. Right-click in Market Watch and select "Show All" to populate the full symbol list.
14. Conclusion
The Quadra Zone Entries Indicator addresses the practical problem of multi-symbol, multi-timeframe EMA analysis at scale. The 8-line ribbon provides immediate trend regime identification through color alone. The ATR-based trade zone system replaces fixed-pip thinking with volatility-proportional levels that adapt to current market conditions. The screener eliminates manual chart rotation across nine pairs. The trend dashboard reduces a five-timeframe analysis to a single color-coded table. The four-channel alert system closes the loop by delivering confirmed signals in real time without requiring screen presence.
Together these components do not add complexity — they remove the manual steps that introduce delay, inconsistency, and fatigue into a systematic entry approach. What remains is a decision: when the screener, the dashboard, and the signal arrow all agree, the setup either meets your criteria or it does not.
The indicator is available for both MetaTrader platforms:
- MetaTrader 5: Quadra Zone Entries Indicator MT5
- MetaTrader 4: Quadra Zone Entries Indicator MT4
Try the indicator on a demo account to familiarize yourself with the signal timing and zone behavior before using it in a live environment. Past performance of any indicator or trading system does not guarantee future results.
CONTACT & SUPPORT
- Email: info@forexobroker.com
- Questions: Use the Comments section on the product page or send a private message
- Bug Reports: Please include your broker name, account type, and a screenshot
-
✅ All MQL Tools: https://www.mql5.com/en/users/forexobroker/ ✅
--------------------------------------------------------------------------------------------------------------
🔵 Recommended Broker
🔵 Best Broker for Europeans ( Leverage 1:500)


 Trading Guide")

