

The FluxGate Precision Indicator is a professional Fibonacci-based trend detection system with ATR-adaptive take-profit and stop-loss management. It identifies trend transitions using Fibonacci retracement thresholds, generates non-repainting BUY and SELL signals on confirmed bars, and automatically constructs a multi-target TP/SL framework using either ATR-scaled distances or fixed percentage offsets. A built-in progressive break-even system trails your stop as each target is hit, and a live on-chart dashboard displays every level, status, and trade outcome in real time.
Key Features:
- Fibonacci Trend Detection: Signals fire when price crosses above the upper Fibonacci threshold (BUY) or below the lower threshold (SELL), using a configurable analysis window
- ATR-Adaptive TP/SL: Take-profit and stop-loss levels automatically scale to current volatility via ATR
- Up to 4 Take-Profit Levels: Configure 1 to 4 independent TP targets with individual ATR multipliers. Disable any target by setting its multiplier to 0
- Progressive Break-Even: When enabled, the stop-loss trails forward as each TP is reached
- Manual Percentage Mode: Optionally disable ATR and set TP/SL as fixed percentage offsets from entry
- Non-Repainting Signals: All decisions are made on confirmed (closed) bars only
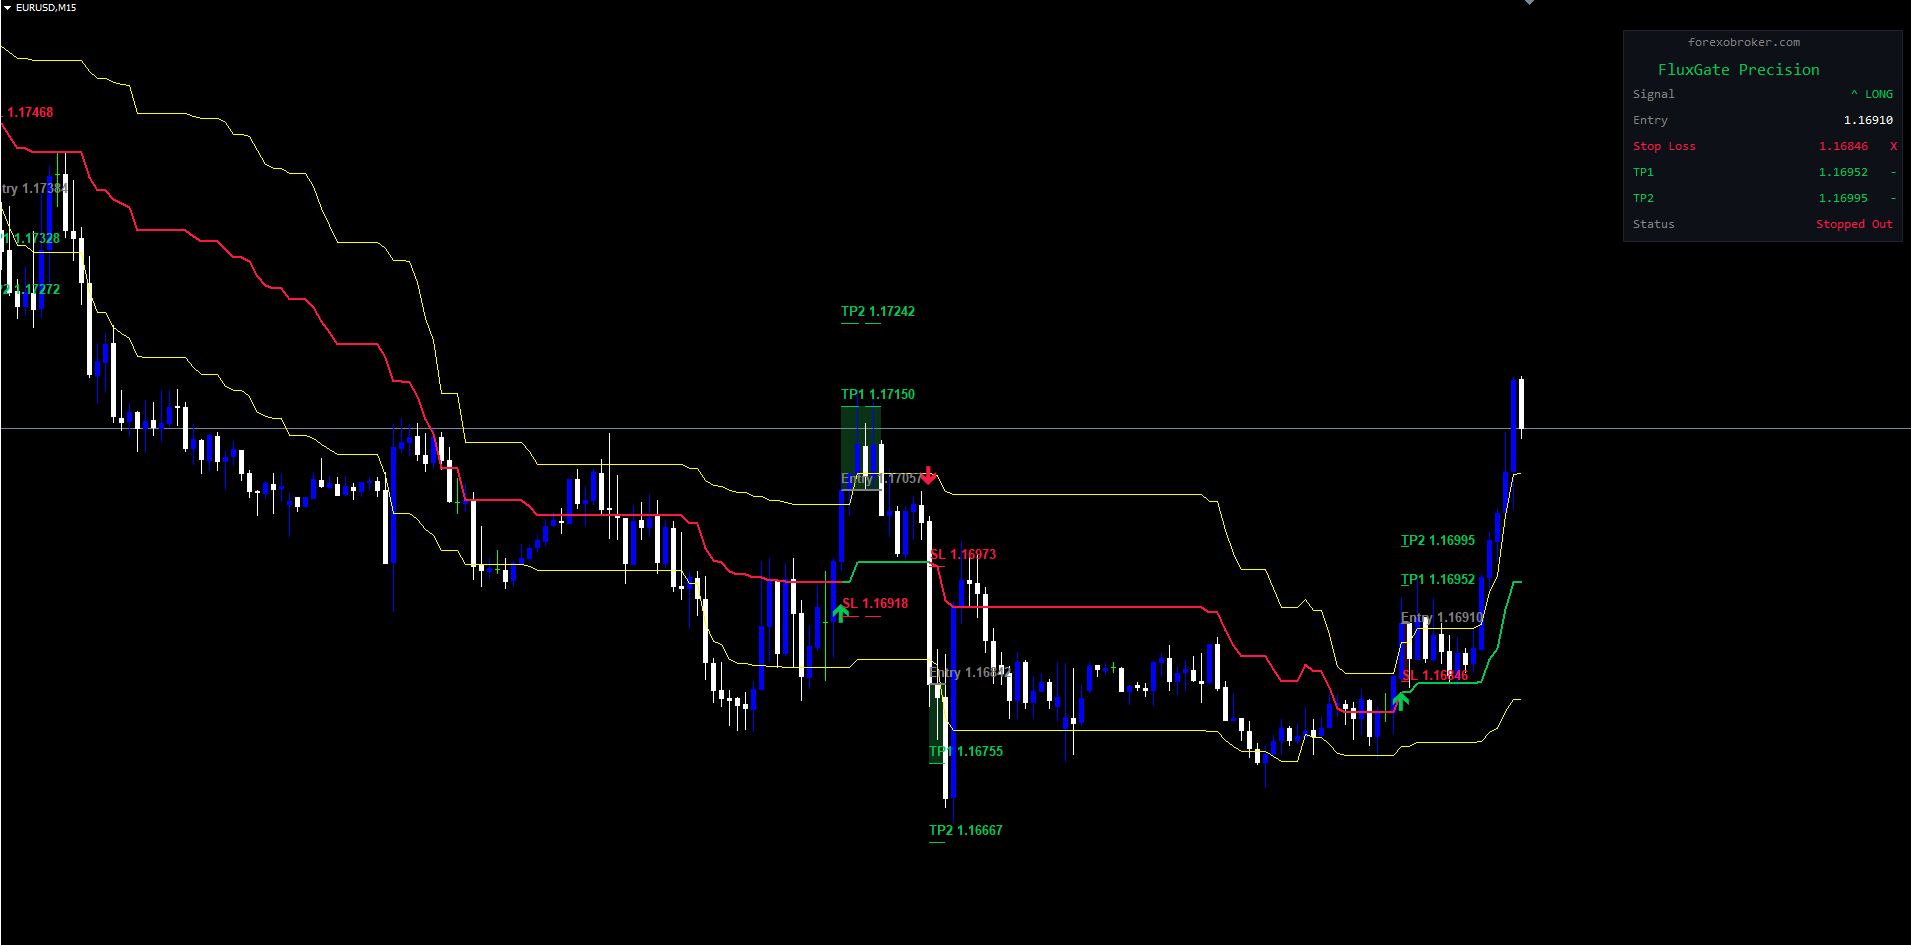
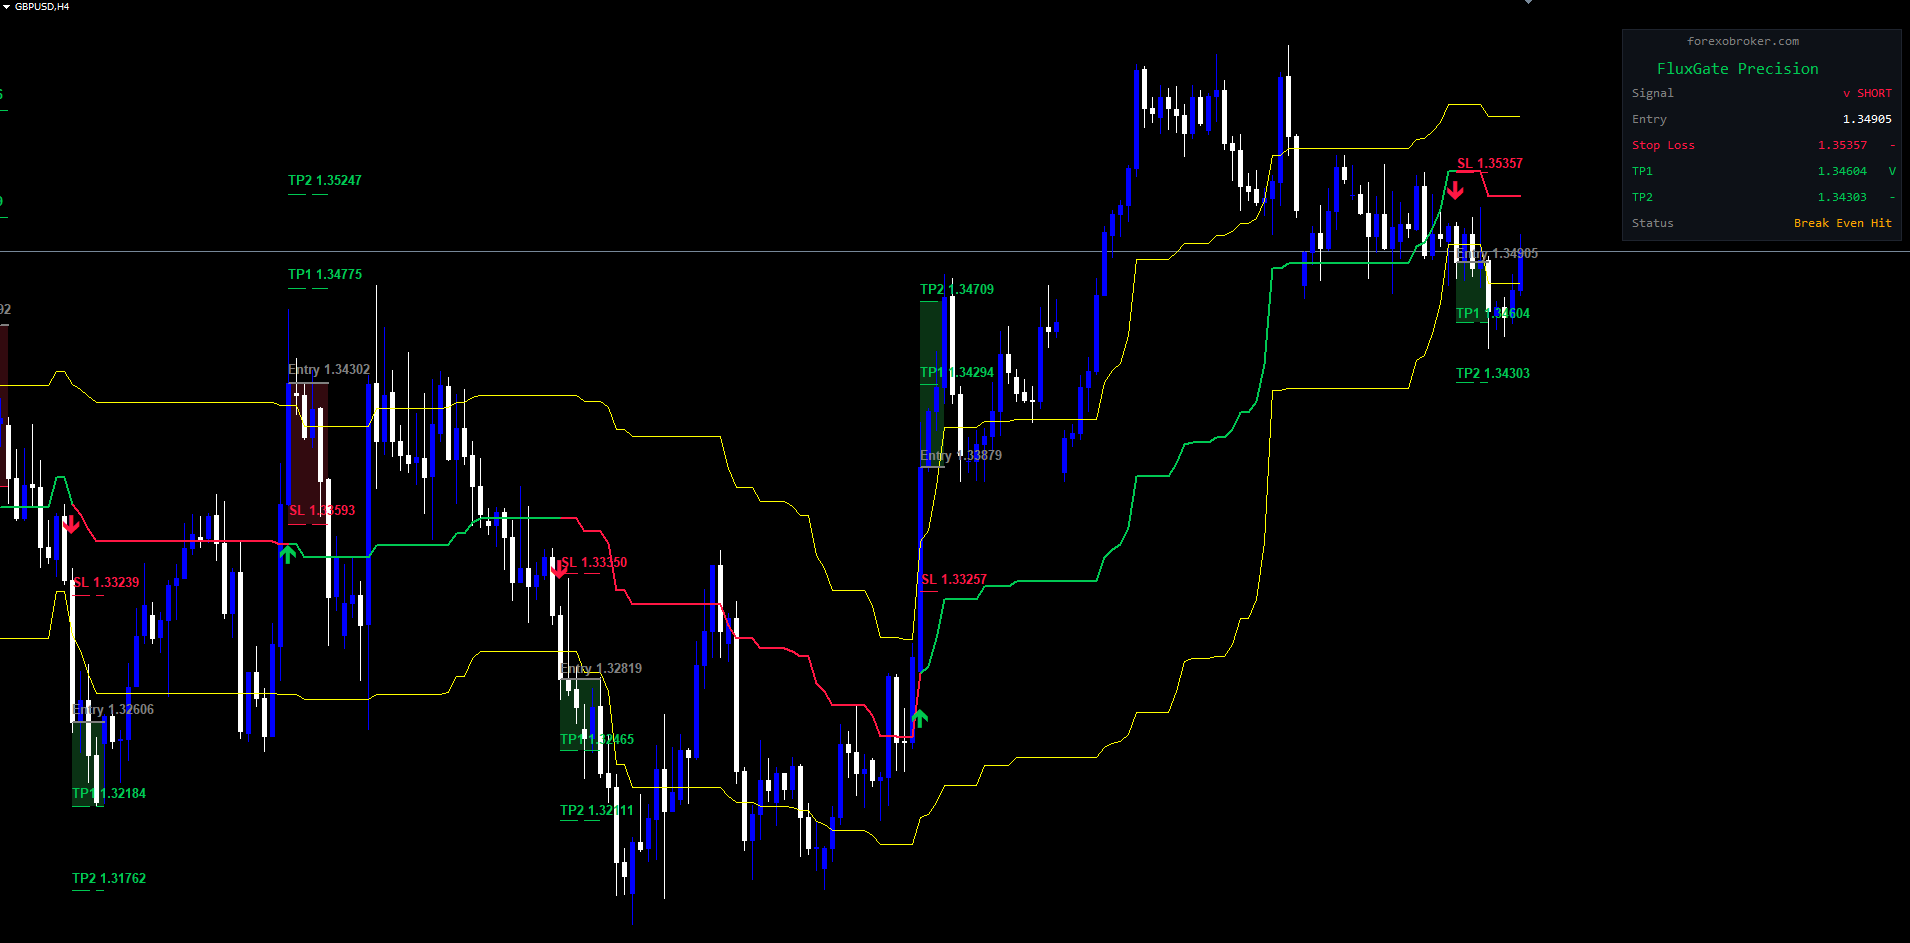
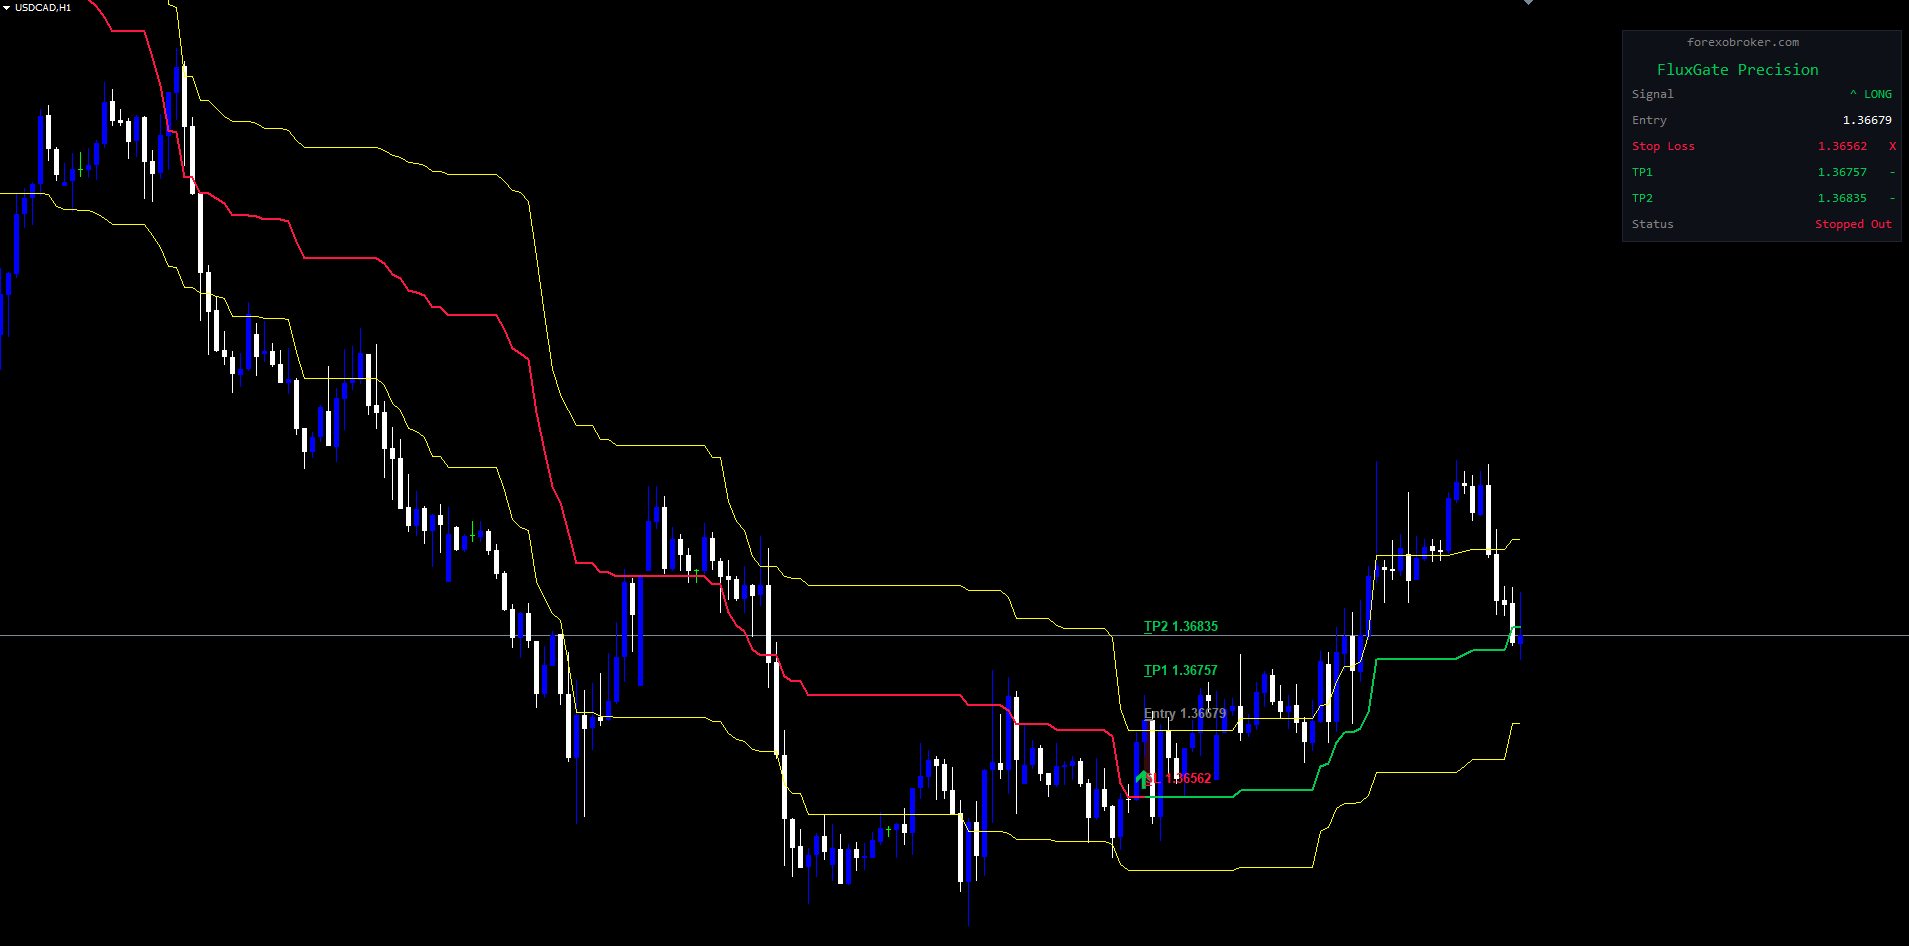
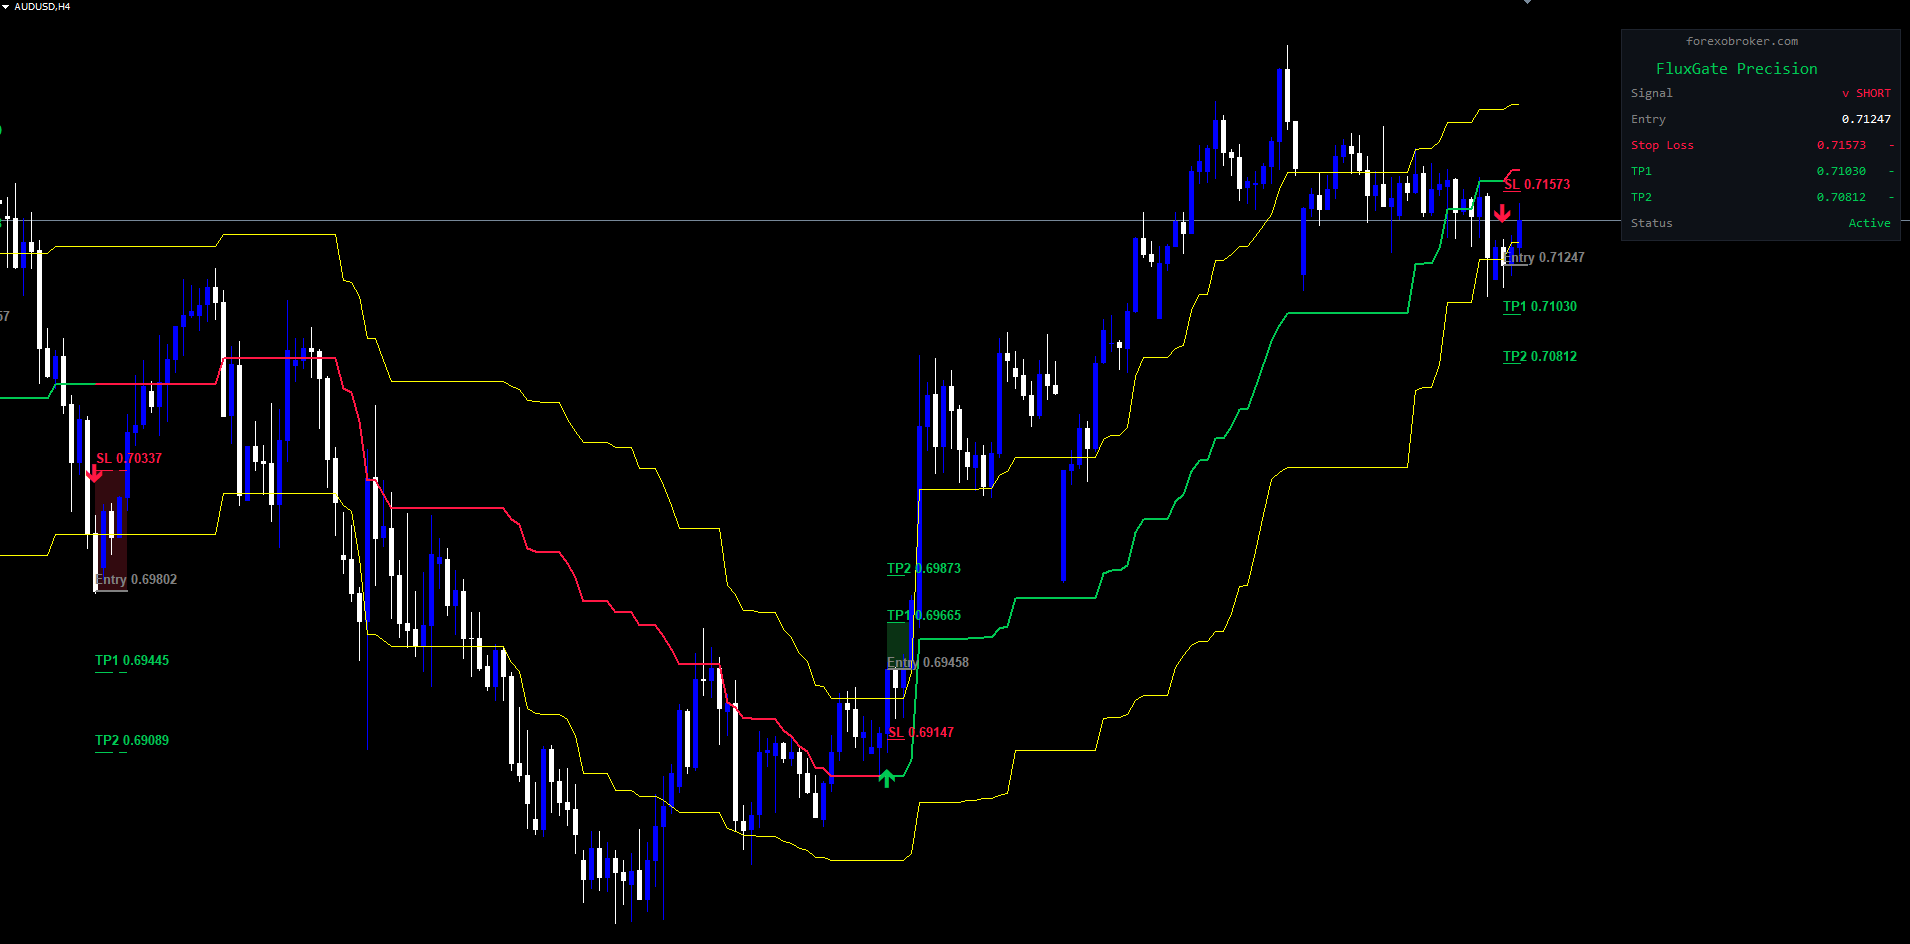
- Live Dashboard: Real-time panel showing signal direction, entry price, all TP/SL levels, hit status, and current trade outcome
- 8 Alert Events: BUY/SELL signals, TP1-TP4 hit, Stop Loss hit, and Break Even triggered -- via popup, sound, push, and email
- Universal Compatibility: Works on any market and any timeframe (M1 to Monthly)
Download the indicator:
- MetaTrader 5: FluxGate Precision MT5
- MetaTrader 4: FluxGate Precision MT4
TIP: A free demo version is available for testing before purchase. Always combine indicator signals with proper position sizing and risk management -- never risk more than 1-2% of your account on a single trade.
Understanding Fibonacci Trend Detection
How Fibonacci Levels Drive Signal Generation
The FluxGate Precision Indicator uses Fibonacci retracement mathematics as the foundation of its trend detection engine. It calculates dynamic Fibonacci levels from the highest high and lowest low within a rolling analysis window, then monitors price position relative to these levels to determine trend direction.
On each bar, the indicator computes three reference lines:
-
Fib High Line -- The upper Fibonacci retracement level: Highest High - Range x Fib High Sensitivity . With the default 23.6%, this line sits close to the top of the range.
-
Trend Line (50%) -- The midpoint of the range, always at the 50% retracement level. This is the central reference for determining bullish or bearish territory.
-
Fib Low Line -- The lower Fibonacci retracement level: Highest High - Range x Fib Low Sensitivity . With the default 78.6%, this line sits closer to the bottom.
Signal Conditions
A BUY signal fires when the confirmed bar's close is at or above BOTH the Trend Line and the Fib High Line, AND the indicator is not already in a bullish state. A SELL signal fires when the confirmed bar's close is at or below BOTH the Trend Line and the Fib Low Line, AND the indicator is not already in a bearish state.
This dual-threshold approach filters out weak breakouts -- price must clear both the midpoint and the Fibonacci threshold on the same bar.
Non-Repainting Guarantee
All signal decisions are made on confirmed (closed) bars only -- the indicator processes bars at shift >= 1 , never the current forming bar. Once a signal arrow appears on the chart, it will never move or disappear. What you see on historical charts is exactly what the indicator produced in real time.
NOTE: The trend state machine ensures that consecutive signals of the same type are suppressed. A BUY signal cannot fire while the indicator is already bullish, and vice versa. This prevents signal clustering during strong trends.
Installation Guide
For MetaTrader 4 and MetaTrader 5
The FluxGate Precision Indicator is distributed through the MQL5.com Market platform. Installation is automatic -- no manual file copying is required.
-
Purchase or download the indicator from the MQL5.com Market product page:
- MetaTrader 5: FluxGate Precision MT5
- MetaTrader 4: FluxGate Precision MT4
- The indicator installs automatically via the MQL5.com platform after purchase
- Restart MetaTrader or press Ctrl+N and right-click "Indicators" to Refresh the Navigator panel
- Find the indicator in Navigator > Indicators > Market
- Drag and drop the indicator onto any chart, or double-click to apply
After applying, you will see:
- Fibonacci Lines: Yellow Fib High and Fib Low lines flanking the green (bullish) or red (bearish) trend line
- Signal Arrows: Green upward arrows for BUY signals, red downward arrows for SELL signals
- TP/SL Lines: Horizontal entry, stop-loss, and take-profit lines extending from each signal bar
- Dashboard Panel: A compact panel in the upper-right corner displaying all trade session data
IMPORTANT: A free demo version is available for testing on a demo account with full functionality.
Signal System Overview
Arrow Display
When a new trend transition is detected, the indicator draws a color-coded arrow on the signal bar:
- BUY Signal (Green Arrow): Upward arrow below the low of the signal bar, colored green (#00C853). Indicates a transition from bearish to bullish.
- SELL Signal (Red Arrow): Downward arrow above the high of the signal bar, colored red (#FF1744). Indicates a transition from bullish to bearish.
The arrow is offset from the bar's extreme by half the ATR value (minimum 10 points). Arrow visibility can be toggled using the Show Signal Labels parameter.
When a signal fires, the indicator creates a new trade session -- a tracked period during which entry, TP/SL levels, and break-even progression are monitored. The session remains active until all targets are hit, the stop-loss triggers, break-even is hit, or a new opposite signal fires.
Fibonacci Threshold Logic
The indicator computes Fibonacci levels dynamically on every bar using the highest high and lowest low within the Analysis Window (default: 44 bars).
- Fib High determines the upper breakout threshold. 23.6% (default) sits close to the range high; 38.2% requires a stronger move.
- Fib Low determines the lower breakdown threshold. 78.6% (default) requires a deeper move; 61.8% is more sensitive.
Trend State Machine
The indicator maintains a persistent trend state across bars, preventing duplicate signals and ensuring clean BUY/SELL alternation. The trend line changes color to reflect the current state: green during bullish trends, red during bearish trends. Fib High and Fib Low lines remain yellow throughout.
Fibonacci Settings
Parameter Table
| Parameter | Type | Default | Options | Description |
|---|---|---|---|---|
| Analysis Window | int | 44 | Any positive integer | Number of bars used to calculate highest high and lowest low for Fibonacci levels. Larger values create smoother, slower-reacting levels |
| Fib High Sensitivity | enum | 23.6 (More Sensitive) | 23.6 (More Sensitive), 38.2 (Less Sensitive) | Upper Fibonacci retracement percentage. Controls how close to the range high the BUY threshold sits |
| Fib Low Sensitivity | enum | 78.6 (More Sensitive) | 61.8 (Less Sensitive), 78.6 (More Sensitive) | Lower Fibonacci retracement percentage. Controls how close to the range low the SELL threshold sits |
Analysis Window Explained
The Analysis Window determines the lookback period for identifying the highest high and lowest low that define the Fibonacci range:
- Smaller values (20-30): More signals but higher false-positive rate, as the range contracts and expands rapidly.
- Default value (44): Balanced lookback that captures meaningful swing highs and lows without overreacting to noise.
- Larger values (60-100): Fewer, higher-quality signals that capture more meaningful trend transitions.
Fib High and Fib Low Explained
- Fib High at 23.6% places the BUY threshold near the top of the range -- price must be near the high to trigger.
- Fib High at 38.2% is more permissive, allowing earlier BUY signals.
- Fib Low at 78.6% places the SELL threshold near the bottom -- price must fall deeply to trigger.
- Fib Low at 61.8% is more permissive, allowing earlier SELL signals.
TIP: For trending markets, the default 23.6/78.6 works well. For range-bound instruments, try 38.2/61.8 for earlier entries closer to the midpoint.
TP/SL Configuration -- ATR Mode
Overview
When Use ATR-Based TP/SL is enabled (default: true), all take-profit and stop-loss levels are calculated using the ATR as a volatility multiplier. Levels automatically widen during high volatility and tighten during low volatility.
ATR Calculation Formula
The indicator computes an ATR ratio by dividing the ATR value by the current close price:
atrRatio = ATR(period) / Close
Each level is then calculated as a percentage offset from entry:
- BUY: TP = Close x (1 + atrRatio x Multiplier), SL = Close x (1 - atrRatio x Multiplier)
- SELL: TP = Close x (1 - atrRatio x Multiplier), SL = Close x (1 + atrRatio x Multiplier)
Parameter Table
| Parameter | Type | Default | Description |
|---|---|---|---|
| Use ATR-Based TP/SL | bool | true | When enabled, TP/SL levels use ATR-scaled distances. When disabled, manual percentage settings are used |
| ATR Period | int | 14 | Number of bars for ATR calculation. Standard values: 14, 20, or 50 |
| SL Multiplier | double | 1.5 | ATR multiplier for stop-loss distance |
| TP1 Multiplier | double | 1.0 | ATR multiplier for Take Profit 1 (closest target) |
| TP2 Multiplier | double | 2.0 | ATR multiplier for Take Profit 2. Set to 0 to disable |
| TP3 Multiplier | double | 0.0 | ATR multiplier for Take Profit 3. Default 0 (disabled) |
| TP4 Multiplier | double | 0.0 | ATR multiplier for Take Profit 4. Default 0 (disabled) |
| Break Even | bool | true | When enabled, the stop-loss progressively trails forward as take-profit levels are hit |
How Multipliers Work
Consider a EURUSD BUY signal at 1.10000 with ATR of 0.00550 (50 pips):
- atrRatio = 0.00550 / 1.10000 = 0.005
- SL (1.5x): 1.10000 x 0.9925 = 1.09175 (82.5 pips below)
- TP1 (1.0x): 1.10000 x 1.005 = 1.10550 (55 pips above)
- TP2 (2.0x): 1.10000 x 1.010 = 1.11100 (110 pips above)
Disabling Take-Profit Levels
Set any TP multiplier to 0 to disable that level. The dashboard and chart will only show active levels. Default setup uses TP1 and TP2 only (TP3 = 0, TP4 = 0).
TP/SL Configuration -- Manual Mode
Overview
When Use ATR-Based TP/SL is set to false, the indicator switches to manual percentage mode. Each TP/SL level is calculated as a fixed percentage offset from entry, regardless of current volatility.
Calculation Formula
- BUY: TP = Close x (1 + Percentage / 100), SL = Close x (1 - Percentage / 100)
- SELL: TP = Close x (1 - Percentage / 100), SL = Close x (1 + Percentage / 100)
Parameter Table
| Parameter | Type | Default | Description |
|---|---|---|---|
| Manual SL % | double | 0.8 | Stop-loss distance as a percentage of entry price |
| Manual TP1 % | double | 0.65 | Take Profit 1 distance as a percentage of entry price |
| Manual TP2 % | double | 1.1 | Take Profit 2 distance as a percentage. Set to 0 to disable |
| Manual TP3 % | double | 0.0 | Take Profit 3 distance. Default 0 (disabled) |
| Manual TP4 % | double | 0.0 | Take Profit 4 distance. Default 0 (disabled) |
NOTE: Use ATR mode (default) when you trade multiple instruments or want auto-adapting levels. Use Manual mode when you want fixed, predictable risk percentages or have calibrated optimal levels for a single instrument.
Example Calculation
BUY signal on EURUSD at 1.10000 with Manual SL = 0.8%, TP1 = 0.65%, TP2 = 1.1%:
- SL: 1.10000 x (1 - 0.008) = 1.09120 (88 pips below)
- TP1: 1.10000 x (1 + 0.0065) = 1.10715 (71.5 pips above)
- TP2: 1.10000 x (1 + 0.011) = 1.11210 (121 pips above)
Break-Even System
How Progressive Break-Even Works
When the Break Even parameter is enabled (default: true), the stop-loss progressively trails forward as each take-profit level is reached, protecting accumulated profits while allowing remaining targets to run.
Progression Table
| Event | Stop-Loss Moves To | Effect |
|---|---|---|
| TP1 Hit | Entry price | Eliminates risk -- trade is now at break-even |
| TP2 Hit | TP1 price | Locks in TP1-level profit |
| TP3 Hit | TP2 price | Locks in TP2-level profit |
| TP4 Hit | Trade closes | All four targets reached |
How It Works in Practice
Consider a BUY at 1.26000 with TP1 = 1.26500, TP2 = 1.27000, TP3 = 1.27500, SL = 1.25250:
- Signal fires. Entry at 1.26000, SL at 1.25250 (75 pips risk).
- TP1 hit (1.26500). Stop moves to 1.26000 (entry). Trade is now risk-free.
- TP2 hit (1.27000). Stop moves to 1.26500 (TP1). Minimum profit = 50 pips.
- TP3 hit (1.27500). Stop moves to 1.27000 (TP2). Minimum profit = 100 pips.
Interaction with Disabled TP Levels
The progression adapts to active TP levels:
| Active TPs | Break-Even Progression |
|---|---|
| TP1 only | TP1 hit moves stop to entry. No further progression. |
| TP1 + TP2 | TP1 hit moves stop to entry. TP2 hit moves stop to TP1. |
| TP1 + TP2 + TP3 | Full three-stage progression. |
| All four | Full four-stage progression. TP4 hit closes the trade entirely. |
When to Disable Break-Even
Setting Break Even to false keeps the stop-loss fixed at its original level throughout the session. Appropriate when you prefer manual stop management, or when backtesting raw signal quality without trailing interference.
NOTE: Break-even is evaluated on confirmed bars, not the signal bar itself.
Display Settings
Parameter Table
| Parameter | Type | Default | Description |
|---|---|---|---|
| Show TP/SL Lines | bool | true | Draws horizontal lines for Entry (gray), Stop Loss (red, dashed), and TP levels (green, dashed). Filled rectangles appear when TP or SL is hit |
| Show Signal Labels | bool | true | BUY and SELL signal arrows appear on the chart. Disabling hides arrows but does not affect signal logic or alerts |
| Show Dashboard | bool | true | Real-time dashboard panel in the upper-right corner. Disabling removes the panel but does not affect signals or alerts |
| Max Visual History | int | 500 | Maximum bars back to retain visual objects. Sessions older than this are cleaned up. Does not affect signal calculation |
Managing Chart Performance
For fast timeframes (M1, M5), reducing Max Visual History to 200-300 improves redraw performance. On higher timeframes (H4, D1), 500-1000 is appropriate. Toggling Show TP/SL Lines to false dramatically reduces chart objects while preserving arrows and dashboard.
Visual Elements per Session
| Object | Description |
|---|---|
| Entry line + label | Solid gray horizontal line at entry price |
| SL line + label | Dashed red line at stop-loss price |
| TP1-TP4 lines + labels | Dashed green lines at active TP levels |
| Fill rectangles | Green fill for TP hit, red fill for SL hit |
Lines extend from the signal bar to the current bar (active sessions) or session close bar (completed sessions).
Dashboard Guide
Layout and Position
The dashboard is a compact, dark-themed panel (#0D1117 background) in the upper-right corner of the chart, using Consolas monospaced font. It automatically repositions when the chart is resized.
Dashboard Rows
| Row | Label | Content | Color |
|---|---|---|---|
| 1 | (copyright) | forexobroker.com | Gray |
| 2 | (title) | FluxGate Precision | Green (#00C853) |
| 3 | Signal | "^ LONG" or "v SHORT" or "-" | Green/Red/Gray |
| 4 | Entry | Entry price or "-" | White |
| 5 | Stop Loss | SL price + status | Red (#FF1744) |
| 6-9 | TP1-TP4 | TP price + status (only if active) | Green (#00C853) |
| 10 | Status | Current trade outcome | Variable |
Status Indicators
| Symbol | Meaning |
|---|---|
| - | Pending -- level not yet hit |
| V | Hit -- price reached this level |
| X | Stopped out -- SL triggered |
Status Row Values
| Status Text | Color | Meaning |
|---|---|---|
| Awaiting Signal | Orange | No active session |
| Active | Green | Trade session is live |
| All TPs Hit | Orange | All active take-profits reached |
| Stopped Out | Red | Stop-loss triggered |
| Break Even Hit | Orange | Break-even level reached |
| Trend Change | Orange | Opposite signal closed session |
The dashboard automatically adjusts height based on active TP levels.
TIP: The dashboard always displays the most recent trade session. Historical session data is preserved via TP/SL lines and fill rectangles on the chart.
Alert Configuration
Alert Channels
| Parameter | Type | Default | Description |
|---|---|---|---|
| Enable Popup Alerts | bool | true | Displays a popup dialog in MetaTrader |
| Enable Sound Alerts | bool | true | Plays alert.wav from the Sounds folder |
| Enable Push Notifications | bool | false | Sends push notification to MetaTrader mobile app |
| Enable Email Alerts | bool | false | Sends email with alert details |
Alert Events
| Event | Alert Message Example |
|---|---|
| BUY Signal | FluxGate BUY signal on EURUSD H1 |
| SELL Signal | FluxGate SELL signal on EURUSD H1 |
| TP1-TP4 Hit | FluxGate TP1 Hit on EURUSD H1 |
| SL Hit | FluxGate SL Hit on EURUSD H1 |
| Break Even | FluxGate Break Even on EURUSD H1 |
Alerts fire only on confirmed bars and only after the initial history calculation is complete, preventing floods when the indicator first loads.
Setup
Push Notifications: Install the MetaTrader mobile app, find your MetaQuotes ID in Settings, enter it in desktop MetaTrader under Tools > Options > Notifications, and set Enable Push Notifications to true.
Email Alerts: Configure your SMTP settings in Tools > Options > Email, send a test email, and set Enable Email Alerts to true.
Trading Strategies
Strategy A: Scalping (M5 - M15)
Setup: Analysis Window: 30 | TP1: 0.8 | TP2: 1.5 | TP3-TP4: 0 | SL: 1.0 | Break Even: true | Fib: 38.2/61.8
Workflow: Wait for a signal arrow on M5/M15, enter at the next bar open, monitor dashboard for TP1 hit (trade moves to break-even), let TP2 run or close if momentum fades. Exit immediately on "Trend Change" status. Best on high-liquidity pairs (EURUSD, GBPUSD, USDJPY) where spreads are tight relative to TP distances.
Strategy B: Swing Trading (H1 - H4)
Setup: Analysis Window: 44 | TP1: 1.0 | TP2: 2.0 | TP3: 3.0 | TP4: 4.0 | SL: 1.5 | Break Even: true | Fib: 23.6/78.6
Workflow: Wait for a signal on H1/H4, verify TP/SL levels on the dashboard, enter with position sized so SL represents 1-2% account risk. As each TP is hit, break-even locks in progressive profits. Works across all asset classes -- Forex, metals, indices, crypto. ATR-adaptive levels auto-calibrate to each instrument's volatility.
Strategy C: Alert-Based Remote Trading
Setup: H1 or H4 timeframe | Push Notifications: true | Email Alerts: true | Default TP/SL settings
Workflow: Apply the indicator, configure push and email alerts. When a signal alert arrives, open the MetaTrader mobile app, review levels, execute manually. Monitor TP/SL hit alerts to manage the position. Best on H1+ where you have time to react.
WARNING: No indicator signal guarantees a profitable trade. Always apply your own analysis, risk management, and position sizing discipline. The indicator is a decision-support tool, not an automated trading system.
Parameter Tuning Presets
Scalping Preset (M5 - M15)
| Parameter | Value | Rationale |
|---|---|---|
| Analysis Window | 30 | Shorter lookback for faster signal response |
| Fib High Sensitivity | 38.2 (Less Sensitive) | Easier entry threshold for quicker signals |
| Fib Low Sensitivity | 61.8 (Less Sensitive) | Easier exit threshold |
| ATR Period | 14 | Standard |
| SL Multiplier | 1.0 | Tighter stop for shorter time in trade |
| TP1 Multiplier | 0.8 | Close first target quickly |
| TP2 Multiplier | 1.5 | Moderate second target |
| TP3/TP4 | 0.0 | Disabled |
| Break Even | true | Essential against whipsaws |
Swing Preset (H1 - H4)
| Parameter | Value | Rationale |
|---|---|---|
| Analysis Window | 44 | Default captures meaningful swing structures |
| Fib High/Low | 23.6 / 78.6 | Strict breakout/breakdown entry |
| ATR Period | 14 | Standard |
| SL Multiplier | 1.5 | Room for intraday noise |
| TP1 Multiplier | 1.0 | First target at 1x ATR ratio |
| TP2 Multiplier | 2.0 | Second target at 2x |
| TP3 Multiplier | 3.0 | Extended moves |
| TP4 Multiplier | 4.0 | Trend-following runners |
| Break Even | true | Progressive trailing at each stage |
Conservative Preset (D1 - W1)
| Parameter | Value | Rationale |
|---|---|---|
| Analysis Window | 60 | Longer lookback for major trend identification |
| Fib High/Low | 23.6 / 78.6 | Strict -- only confirmed major breakouts |
| ATR Period | 20 | Smoother daily ATR |
| SL Multiplier | 2.0 | Wide stop for daily noise tolerance |
| TP1 Multiplier | 1.5 | Initial momentum capture |
| TP2 Multiplier | 3.0 | Trend continuation |
| TP3 Multiplier | 5.0 | Extended target for strong trends |
| TP4 Multiplier | 0.0 | Three targets sufficient |
| Break Even | true | Protects against reversals on larger timeframes |
TIP: These presets are starting points. Monitor performance on your specific instruments for 2-4 weeks on a demo account before committing real capital.
Complete Parameter Reference
The FluxGate Precision Indicator has 24 input parameters organized into 5 groups.
| # | Parameter | Type | Default | Category |
|---|---|---|---|---|
| 1 | Analysis Window | int | 44 | Signal Settings |
| 2 | Fib High Sensitivity | enum | 23.6 (More Sensitive) | Signal Settings |
| 3 | Fib Low Sensitivity | enum | 78.6 (More Sensitive) | Signal Settings |
| 4 | Use ATR-Based TP/SL | bool | true | TP/SL Settings |
| 5 | ATR Period | int | 14 | TP/SL Settings |
| 6 | SL Multiplier | double | 1.5 | TP/SL Settings |
| 7 | TP1 Multiplier | double | 1.0 | TP/SL Settings |
| 8 | TP2 Multiplier | double | 2.0 | TP/SL Settings |
| 9 | TP3 Multiplier | double | 0.0 | TP/SL Settings |
| 10 | TP4 Multiplier | double | 0.0 | TP/SL Settings |
| 11 | Break Even | bool | true | TP/SL Settings |
| 12 | Manual SL % | double | 0.8 | Manual TP/SL |
| 13 | Manual TP1 % | double | 0.65 | Manual TP/SL |
| 14 | Manual TP2 % | double | 1.1 | Manual TP/SL |
| 15 | Manual TP3 % | double | 0.0 | Manual TP/SL |
| 16 | Manual TP4 % | double | 0.0 | Manual TP/SL |
| 17 | Show TP/SL Lines | bool | true | Display |
| 18 | Show Signal Labels | bool | true | Display |
| 19 | Show Dashboard | bool | true | Display |
| 20 | Max Visual History | int | 500 | Display |
| 21 | Enable Popup Alerts | bool | true | Alerts |
| 22 | Enable Push Notifications | bool | false | Alerts |
| 23 | Enable Email Alerts | bool | false | Alerts |
| 24 | Enable Sound Alerts | bool | true | Alerts |
Troubleshooting
No Signals Appearing on the Chart
- Insufficient history. The indicator needs at least Analysis Window + 2 bars. Go to Tools > Options > Charts and increase max bars.
- Range-bound market. If price is not reaching Fibonacci thresholds, no signals fire. Try a shorter Analysis Window (e.g., 30).
- Show Signal Labels disabled. Arrows are hidden but signals still fire internally (dashboard updates).
TP/SL Lines Missing
- Show TP/SL Lines is disabled. Set to true in settings.
- No active session. Lines only appear when a trade session exists. Check dashboard for "Awaiting Signal" status.
- Session too old. Last signal fired more than Max Visual History bars ago. Increase the value or wait for a new signal.
Dashboard Not Showing
- Show Dashboard disabled. Set to true.
- Chart too narrow. The dashboard requires approximately 280 pixels of horizontal space. Widen the chart window.
Alerts Not Firing
- All channels disabled. Verify at least one of Popup, Sound, Push, or Email is true.
- History calculation. Alerts are suppressed during the initial history pass. They only fire on new, live bars.
- Push/Email not configured. Verify MetaQuotes ID in Tools > Options > Notifications or SMTP settings in Tools > Options > Email.
MT4 vs MT5 Differences
Both versions use identical signal logic, TP/SL calculations, and break-even progression. Differences are purely technical:
| Aspect | MT4 | MT5 |
|---|---|---|
| File extension | .ex4 | .ex5 |
| ATR calculation | iATR() returns value directly | Handle-based with CopyBuffer |
| Parameter grouping | Flat list | input group visual grouping |
Visual output, parameter defaults, signals, and dashboard layout are identical on both platforms.
Support and Contact
Product Pages:
- MetaTrader 5: FluxGate Precision MT5
- MetaTrader 4: FluxGate Precision MT4
CONTACT & SUPPORT
- Email: info@forexobroker.com
- Questions: Use the Comments section on the product page or send a private message
- Bug Reports: Please include your broker name, account type, and a screenshot
-
✅ All MQL Tools: https://www.mql5.com/en/users/forexobroker/ ✅
--------------------------------------------------------------------------------------------------------------
🏦 **Broker I use**: https://icmarkets.com/?camp=55869
🏦 **Broker For EU Traders I use 1**: https://www.ictrading.com?camp=91414
🏦 **Broker I use 2**: https://one.exnessonelink.com/boarding/sign-up/a/c_thuv62ocfq
💻 **VPS**: https://chocoping.com/processing/aff.php?aff=738
💼 **Companies I use for getting funded**:
Fundednext: https://fundednext.com/?fpr=kestutis39
The5ers: https://www.the5ers.com/?afmc=16kl
FTMO: https://trader.ftmo.com/?affiliates=nRAyOhmFRnEnFdOpdLeh


")
