
CatBoost machine learning algorithm from Yandex with no Python or R knowledge required

Foreword
This article considers how to create models describing market patterns with a limited set of variables and the hypothesis about the behavioral patterns, using the Yandex's CatBoost machine learning algorithm. To obtain the model, you do not need Python or R knowledge. Furthermore, basic MQL5 knowledge is enough — this is exactly my level. Therefore, I hope that the article will serve as a good tutorial for a broad audience, assisting those interested in evaluating machine learning capabilities and in implementing them in their programs. The article provides little academical knowledge. If you need extra information, please read the series of article by Vladimir Perervenko.
The difference between the classical approach and machine learning in trading
The concept of a Trading Strategy is probably familiar to every trader. Furthermore, trading automation is an important aspect for those who are lucky enough to use MetaQuotes' product. If we eliminate trading environment in the code, most strategies mainly imply the selection of inequalities (most often between the price and an indicator on the chart) or use indicator values and their ranges to make entry (position opening) and exit decisions.
Almost every trading strategy developer has ever experienced insights, which lead to the addition of more trading conditions and new inequalities. Each such addition causes a change in financial results in a certain time interval. But another time interval, timeframe or trading instrument may show disappointing results — the trading system is no longer efficient and the trader has to search for new patterns and conditions. Moreover, the addition of each new condition reduces the number of trades.
The search process is usually followed by the optimization of inequalities used for making trading decisions. The optimization process checks a number of parameters which are often beyond the initial data values. Another case is when the inequality values generated by the parameter optimization appear so rarely that they can be considered a statistical deviation rather than a found pattern, even though they could improve the balance curve or any other optimizable parameter. As a result, optimization leads to overfitting of the heuristic idea implemented in the trading strategy to the available market data. Such an approach is not efficient in terms of computational resources spent searching for an optimal solution, if the strategy implies the usage of a large number of variables and their values.
Machine learning methods can speed up the parameter optimization and pattern search processes by generating inequality rules to only check those parameter values which existed on the analyzed data. Different model creation methods use different approaches. However, generally the idea is to limit the solution search by data available for training. Instead of creating inequalities which are responsible for the trading decision logic, machine learning provides only the values of variables containing information about the price and the factors that influence the price formation. Such data are called features (or predictors).
Features must influence the result which we wish to obtain by polling them. The result is usually expressed as a numeric value: this can be a class number of classification or a set point value for regression. Such a result is the target variable. Some training methods do not have a target variable, such as for example clustering methods, but we will not deal with them in this article.
So, we need predictors and target variables.
Predictors
For predictors, you can use the time, the OHLC price of a trading instrument and their derivatives, that is various indicators. It is also possible to use other predictors, such as economic indicators, trade volumes, open interest, order book patterns, option strike Greeks and other data sources that affect the market. I believe that in addition to the information that has formed by the current moment, the model should receive the information that describes the movement that lead to the current moment. Strictly speaking, predictors should provide information about price movement over a certain period of time.
I determine a few types of predictors that describe:
- Significant levels that can be:
- Horizontal (such as a trading session open price)
- Linear (for example, a regression channel)
- Broken (calculated by a non-linear function, for example, moving averages)
- Price and level position:
- In a fixed range in points
- In a fixed range as a percentage:
- Relative to the day opening price or level
- Relative to the volatility level
- Relative to trend segments of different TFs
- Describing price fluctuations (volatility)
- Information about the event time:
- The number of bars that have elapsed since the beginning of the significant event (from the current bar or the beginning of a different period, such as the day)
- The number of bars that have elapsed since the end of the significant event (from the current bar or the beginning of a different period, such as the day)
- The number of bars that have elapsed since the beginning and end of the event, which shows the vent duration
- Current time as hour number, day of the week, decade or month number, other
- Information about the event dynamics:
- The number of intersections of significant levels (this includes calculation taking into account attenuation/repetition frequency)
- Maximum/minimum price at the moment of the first/last event (the relative price)
- Event speed in points per time unit
- Converting OHLC data to other coordinate planes
- Values of oscillator type indicators.
For predictors, we can take information from different timeframes and trading instruments related to the one that will be used for trading. Of course, there are much more possible methods to provide information. The only recommendation is to provide enough data to reproduce the main price dynamics of the trade instrument. Having prepared predictors once, you can further use them for various purposes. This greatly simplifies the search for a model working according to the basic trading strategy conditions.
The target
In this article, we will use a binary classification target, i. e. 0 and 1. This selection stems from a limitation which will be discussed later. So, what can be represented by zero and one? I have two variants:
- the first variant: "1" — open a position (or execute another action) and "0" — do not open a position (or do not execute another action);
- the second variant: "1" — open a buy position (first action) and "0" — open a sell position (second action).
To generate a target variable signal, we can use simple basic strategies provided that the produce a sufficient number of signals for machine learning:
- Open a position when a buy or sell price level is crossed (any indicator can serve as a level);
- Open a position on the N bar from the beginning of the hour or ignore opening, depending on the position of the price relative to the current day opening price.
Try to find a basic strategy that would allow the generation of an approximately similar number of zero and ones, as this will facilitate better learning.
Machine Learning Software
We will conduct machine learning using the CatBoost software, which can be downloaded at this link. This article aims at creating an independent version, which does not require other programming language, and this you only need to download the latest version exe file, for example catboost-0.24.1.exe.
CatBoost is an open-source machine learning algorithm from the well-known Yandex company. So, we can expect relevant product support, improvements and bug fixes.
You can view the presentation by Yandex here (enable English subtitles because the presentation is in Russian).
In short, CatBoost builds an ensemble of decision trees in such a way that each subsequent tree improves the values of the total probabilistic response of all previous trees. This is called gradient boosting.
Preparing Data for Machine Learning
The data containing predictors and target variable is called a sample. It is a data array containing an enumeration of predictors as columns, in which each row is the measurement moment showing predictor values at that moment. Measurements recorded in the string can be obtained at certain time intervals or can represent various objects, for example images. Usually the file has a CSV format, which uses a conditional separator for column values and headers (optionally).
Let us use the following predictors in our example:
- Time / hours / fractions of hours / day of the week
- The relative position of bars
- Oscillators
The target variable is a signal at the intersection of an MA, which stays untouched at the next bar. If the price is above the MA, then Buy. If the price is below the MA, then Sell. Every time when a signal arrives, an existing position should be closed. The target variable will show whether to open a position or not.
I do not recommend using a script to generate the target and predictor variables. Use an Expert Advisor instead, which will allow detection of logical errors in the code when generating a sample, as well as a detailed simulation of data arrival - this will be similar to how the data arrives in real trading. Furthermore, you will be able to take into account different opening times of different instruments, if the target variable works with different symbols, as well as to take into account the delay in data receiving and processing, to prevent the algorithm from looking into the future, to catch indicator redrawing and logic unsuitable for training. As a result, the predictors will be calculated on the bar in real time, when the model is applied in practice.
Some algorithmic traders, especially those using machine learning, state that standard indicators are mostly useless, as they lag and are derived from the price, which means they do not provide any new information, while neural networks can create any indicator. Indeed, the possibilities of neural networks are great, but they often require the computing power which is not available to most ordinary trader. Furthermore, it requires time to learn such neural networks. Decision tree-based machine learning methods cannot compete with neural networks in creating new mathematical entities, since they do not transform input data. But they are considered more efficient than neural networks when it is necessary to identify direct dependencies, especially in large and heterogeneous data arrays. In fact, the purpose of neural networks is to generate new patterns, i.e. parameters that describe the market. Decision tree-based models aim at identifying patterns among the sets of such patterns. By using standard indicators from the terminal as a predictor, we take the pattern used by thousands of traders in different exchange and OTC markets in different countries. Therefore, we can assume that we will be able to identify an opposite dependence of trader behavior on indicator values, which eventually affects the trading instrument. I have not used oscillators before, so it will be interesting for me to see the result.
The following indicators from the standard terminal delivery will be used:
- Accelerator Oscillator
- Average Directional Movement Index
- Average Directional Movement Index by Welles Wilder
- Average True Range
- Bears Power
- Bulls Power
- Commodity Channel Index
- Chaikin Oscillator
- DeMarker
- Force Index
- Gator
- Market Facilitation Index
- Momentum
- Money Flow Index
- Moving Average of Oscillator
- Moving Averages Convergence/Divergence
- Relative Strength Index
- Relative Vigor Index
- Standard Deviation
- Stochastic Oscillator
- Triple Exponential Moving Averages Oscillator
- Williams' Percent Range
- Variable Index Dynamic Average
- Volume
Indicators are calculated for all timeframes available in MetaTrader 5, up to the daily frame.
When writing this article, I found out that the values of the following indicators strongly depend on the testing start date in the terminal, that is why I decided to exclude them. It is possible to use the difference between values on different bars for these indicators, but this is beyond this article.
The list of excluded indicators:
- Awesome Oscillator
- On Balance Volume
- Accumulation/Distribution
To work with CSV tables, we will use the wonderful library CSV fast.mqh by Aliaksandr Hryshyn. The library features:
- Creating tables, reading them from a file and saving them to a file.
- Reading and writing information to any table cell based on the cell address.
- Table columns can store different data types, which saves RAM consumption.
- Table sections can be copied entirely from the specified addresses to the specified address of another table.
- Provides filtering by any table column.
- Provides multilevel sorting in descending and ascending order, according to the values specified in column cells.
- Allows re-indexing columns and hiding them.
- There are more other useful and user friendly features.
Expert Advisor Components
Basic strategy:
I decided to use a strategy with simple conditions as the basic strategy generating the signal. According to it, the market entry should be performed if the following conditions are met:
- The price has crossed the price moving average.
- After condition 1 is met, the price for the first time did not touch the crossed MA on the previous bar.
This was my first strategy, which I created in early 00s. It is a simple strategy that belongs to the trend class. It shows good results on appropriate trading history parts. Let us try to reduce the number of false entries in flat areas using machine learning.
The signal generator is as follows:
//+-----------------------------------------------------------------+
//| Returns a buy or Sell signal - basic strategy                   |
//+-----------------------------------------------------------------+
bool Signal()
{
// Reset position opening blocking flag
   SellPrIMA=false;  // Open a pending sell order
   BuyPrIMA=false;   // Open a pending buy order
   SellNow=false;    // Open a market sell order
   BuyNow=false;     // Open a market buy order
   bool Signal=false;// Function operation result
   int BarN=0;       // The number of bars on which MA is not touched
   if(iOpen(Symbol(),Signal_MA_TF,0)>MA_Signal(0) && iLow(Symbol(),Signal_MA_TF,1)>MA_Signal(1))
   {
      for(int i=2; i<100; i++)
      {
         if(iLow(Symbol(),Signal_MA_TF,i)>MA_Signal(i))break;// Signal has already been processed on this cycle
         if(iClose(Symbol(),Signal_MA_TF,i+1)<MA_Signal(i+1) && iClose(Symbol(),Signal_MA_TF,i)>=MA_Signal(i))
         {
            for(int x=i+1; x<100; x++)
            {
               if(iLow(Symbol(),Signal_MA_TF,x)>MA_Signal(x))break;// Signal has already been processed on this cycle
               if(iHigh(Symbol(),Signal_MA_TF,x)<MA_Signal(x))
               {
                  BarN=x;
                  BuyNow=true;
                  break;
               }
            }
         }
      }
   }
   if(iOpen(Symbol(),Signal_MA_TF,0)<MA_Signal(0) && iHigh(Symbol(),Signal_MA_TF,1)<MA_Signal(1))
   {
      for(int i=2; i<100; i++)
      {
         if(iHigh(Symbol(),Signal_MA_TF,i)<MA_Signal(i))break;// Signal has already been processed on this cycle
         if(iClose(Symbol(),Signal_MA_TF,i+1)>MA_Signal(i+1) && iClose(Symbol(),Signal_MA_TF,i)<=MA_Signal(i))
         {
            for(int x=i+1; x<100; x++)
            {
               if(iHigh(Symbol(),Signal_MA_TF,x)<MA_Signal(x))break;// Signal has already been processed on this cycle
               if(iLow(Symbol(),Signal_MA_TF,x)>MA_Signal(x))
               {
                  BarN=x;
                  SellNow=true;
                  break;
               }
            }
         }
      }
   }
   if(BuyNow==true || SellNow==true)Signal=true;
   return Signal;
}
Obtaining predictor values:
Predictors will be obtained using functions (their code is attached below). However, I will show you how this can be easily done for a large number of indicators. We will use indicator values in three points: the first and second formed bar, which allows determining the signal level of the indicator, and a bar with a shift of 15 - this allows understanding the indicator movement dynamics. Of course, this is a simplified way of obtaining information and it can be significantly expanded.
All predictors will be written into a table which is formed in the computer's RAM. The table has one row; it will be used later as an input numeric data vector to the CatBoost model interpreter
#include "CSV fast.mqh";                 // Class for working with tables
CSV *csv_CB=new CSV();                   // Create a table class instance, in which current predictor values will be stored

//+------------------------------------------------------------------+
//| Expert initialization function                                   |
//+------------------------------------------------------------------+
int OnInit()
{
   CB_Tabl();// Creating a table with predictors
   return(INIT_SUCCEEDED);
}
//+------------------------------------------------------------------+
//| Create a table with predictors                                   |
//+------------------------------------------------------------------+
void CB_Tabl()
{
//--- Columns for oscillators
   Size_arr_Buf_OSC=ArraySize(arr_Buf_OSC);
   Size_arr_Name_OSC=ArraySize(arr_Name_OSC);
   Size_TF_OSC=ArraySize(arr_TF_OSC);
   for(int n=0; n<Size_arr_Buf_OSC; n++)SummBuf_OSC=SummBuf_OSC+arr_Buf_OSC[n];
   Size_OSC=3*Size_TF_OSC*SummBuf_OSC;
   for(int S=0; S<3; S++)// Loop by the number of shifts
   {
      string Shift="0";
      if(S==0)Shift="1";
      if(S==1)Shift="2";
      if(S==2)Shift="15";
      for(int T=0; T<Size_TF_OSC; T++)// Loop by the number of timeframes
      {
         for(int o=0; o<Size_arr_Name_OSC; o++)// Loop by the number of indicators
         {
            for(int b=0; b<arr_Buf_OSC[o]; b++)// Loop by the number of indicator buffers
            {
               name_P=arr_Name_OSC[o]+"_B"+IntegerToString(b,0)+"_S"+Shift+"_"+arr_TF_OSC[T];
               csv_CB.Add_column(dt_double,name_P);// Add a new column with a name to identify a predictor
            }
         }
      }
   }
}
//+------------------------------------------------------------------+
//--- Call predictor calculation
//+------------------------------------------------------------------+
void Pred_Calc()
{
//--- Get information from oscillator indicators
   double arr_OSC[];
   iOSC_Calc(arr_OSC);
   for(int p=0; p<Size_OSC; p++)
   {
      csv_CB.Set_value(0,s(),arr_OSC[p],false);
   }
}
//+------------------------------------------------------------------+
//| Get values of oscillator indicators                              |
//+------------------------------------------------------------------+
void iOSC_Calc(double &arr_OSC[])
{
   ArrayResize(arr_OSC,Size_OSC);
   int n=0;// Indicator handle index
   int x=0;// Total number of iterations
   for(int S=0; S<3; S++)// Loop by the number of shifts
   {
      n=0;
      int Shift=0;
      if(S==0)Shift=1;
      if(S==1)Shift=2;
      if(S==2)Shift=15;
      for(int T=0; T<Size_TF_OSC; T++)// Loop by the number of timeframes
      {
         for(int o=0; o<Size_arr_Name_OSC; o++)// Loop by the number of indicators
         {
            for(int b=0; b<arr_Buf_OSC[o]; b++)// Loop by the number of indicator buffers
            {
               arr_OSC[x++]=iOSC(n, b,Shift);
            }
            n++;// Mark shift to the next indicator handle for calculation
         }
      }
   }
}
//+------------------------------------------------------------------+
//| Get the value of the indicator buffer                            |
//+------------------------------------------------------------------+
double iOSC(int OSC, int Bufer,int index)
{
   double MA[1]= {0.0};
   int handle_ind=arr_Handle[OSC];// Indicator handle
   ResetLastError();
   if(CopyBuffer(handle_ind,0,index,1,MA)<0)
   {
      PrintFormat("Failed to copy data from the OSC indicator, error code %d",GetLastError());
      return(0.0);
   }
   return (MA[0]);
}
Sample accumulation and marking:
To create and the save a sample, we will accumulate predictor values by copying them from the csv_CB table to the csv_Arhiv table.
We read the date of the previous signal, determine the trade entry and exit price and define the result, according to which the appropriate label is assigned: "1" — positive, "0" — negative. Let us also mark the type of the deal performed by the signal. This will further help to build a balance chart: "1" — buy and "-1" — sell. Also, let us calculate here the financial outcome of a trading operation. Separate columns with buy and sell results will be used for the financial outcome: it is convenient when the basic strategy is more difficult or has position management elements which may affect the result.
//+-----------------------------------------------------------------+
//| The function copies predictors to archive                       |
//+-----------------------------------------------------------------+
void Copy_Arhiv()
{
   int Strok_Arhiv=csv_Arhiv.Get_lines_count();// Number of rows in the table
   int Stroka_Load=0;// Starting row in the source table
   int Stolb_Load=1;// Starting column in the source table
   int Stroka_Save=0;// Starting row to write in the table
   int Stolb_Save=1;// Starting column to write in the table
   int TotalCopy_Strok=-1;// Number of rows to copy from the source. -1 copy to the last row
   int TotalCopy_Stolb=-1;// Number of columns to copy from the source, if -1 copy to the last column

   Stroka_Save=Strok_Arhiv;// Copy the last row
   csv_Arhiv.Copy_from(csv_CB,Stroka_Load,Stolb_Load,TotalCopy_Strok,TotalCopy_Stolb,Stroka_Save,Stolb_Save,false,false,false);// Copying function

//--- Calculate the financial result and set the target label, if it is not the first market entry
   int Stolb_Time=csv_Arhiv.Get_column_position("Time",false);// Find out the index of the "Time" column
   int Vektor_P=0;// Specify entry direction: "+1" - buy, "-1" - sell
   if(BuyNow==true)Vektor_P=1;// Buy entry
   else Vektor_P=-1;// Sell entry
   csv_Arhiv.Set_value(Strok_Arhiv,Stolb_Time+1,Vektor_P,false);
   if(Strok_Arhiv>0)
   {
      int Stolb_Target_P=csv_Arhiv.Get_column_position("Target_P",false);// Find out the index of the "Time" column
      int Load_Vektor_P=csv_Arhiv.Get_int(Strok_Arhiv-1,Stolb_Target_P,false);// Find out the previous operation type
      datetime Load_Data_Start=StringToTime(csv_Arhiv.Get_string(Strok_Arhiv-1,Stolb_Time,false));// Read the position opening date
      datetime Load_Data_Stop=StringToTime(csv_Arhiv.Get_string(Strok_Arhiv,Stolb_Time,false));// Read the position closing date
      double F_Rez_Buy=0.0;// Financial result in case of a buy operation
      double F_Rez_Sell=0.0;// Financial result in case of a sell operation
      double P_Open=0.0;// Position open price
      double P_Close=0.0;// Position close price
      int Metka=0;// Label for target variable
      P_Open=iOpen(Symbol(),Signal_MA_TF,iBarShift(Symbol(),Signal_MA_TF,Load_Data_Start,false));
      P_Close=iOpen(Symbol(),Signal_MA_TF,iBarShift(Symbol(),Signal_MA_TF,Load_Data_Stop,false));
      F_Rez_Buy=P_Close-P_Open;// Previous entry was buying
      F_Rez_Sell=P_Open-P_Close;// Previous entry was selling
      if((F_Rez_Buy-comission*Point()>0 && Load_Vektor_P>0) || (F_Rez_Sell-comission*Point()>0 && Load_Vektor_P<0))Metka=1;
      else Metka=0;
      csv_Arhiv.Set_value(Strok_Arhiv-1,Stolb_Time+2,Metka,false);// Write label to a cell
      csv_Arhiv.Set_value(Strok_Arhiv-1,Stolb_Time+3,F_Rez_Buy,false);// Write the financial result of a conditional buy operation to the cell
      csv_Arhiv.Set_value(Strok_Arhiv-1,Stolb_Time+4,F_Rez_Sell,false);// Write the financial result of a conditional sell operation to the cell
      csv_Arhiv.Set_value(Strok_Arhiv,Stolb_Time+2,-1,false);// Add a negative label to the labels to control labels
   }
}
Using the model:
Let us use the "Catboost.mqh" class by Aliaksandr Hryshyn, which can be downloaded here, to interpret the data received using the CatBoost model.
I have added the "csv_Chek" table for debugging, to which the value of the CatBoost model will be saved when necessary.
//+-----------------------------------------------------------------+
//| The function applies predictors in the CatBoost model           |
//+-----------------------------------------------------------------+
void Model_CB()
{
   CB_Siganl=1;
   csv_CB.Get_array_from_row(0,1,Solb_Copy_CB,features);
   double model_result=Catboost::ApplyCatboostModel(features,TreeDepth,TreeSplits,BorderCounts,Borders,LeafValues);
   double result=Logistic(model_result);
   if (result<Porog || result>Pridel)
   {
      BuyNow=false;
      SellNow=false;
      CB_Siganl=0;
   }
   if(Use_Save_Result==true)
   {
      int str=csv_Chek.Add_line();
      csv_Chek.Set_value(str,1,TimeToString(iTime(Symbol(),PERIOD_CURRENT,0),TIME_DATE|TIME_MINUTES));
      csv_Chek.Set_value(str,2,result);
   }
}
Saving a selection to a file:
Save the table at the end of the test pass, specify the decimal separator as a comma
//+------------------------------------------------------------------+
// Function writing predictors to a file                             |
//+------------------------------------------------------------------+
void Save_Pred_All()
{
//--- Save predictors to a file
   if(Save_Pred==true)
   {
      int Stolb_Target=csv_Arhiv.Get_column_position("Target_100",false);// Find out the index of the Target_100 column
      csv_Arhiv.Filter_rows_add(Stolb_Target,op_neq,-1,true);// Exclude lines with label "-1" in target variable
      csv_Arhiv.Filter_rows_apply(true);// Apply filter

      csv_Arhiv.decimal_separator=',';// Set a decimal separator
      string name=Symbol()+"CB_Save_Pred.csv";// File name
      csv_Arhiv.Write_to_file("Save_Pred\\"+name,true,true,true,true,false,5);// Save the file up to 5 characters
   }
//--- Save the model values to a debug file
   if(Use_Save_Result==true)
   {
      csv_Chek.decimal_separator=',';// Set a decimal separator
      string name=Symbol()+"Chek.csv";// File name
      csv_Chek.Write_to_file("Save_Pred\\"+name,true,true,true,true,false,5);// Save file up to 5 decimal places
   }
}
Custom quality score for strategy settings:
Next, we need to find suitable settings for the indicator which is used by the basic model. So, let us calculate a value for the strategy tester, which determines the minimum of trades and returns the percentage of profitable trades. The more objects are available for training (trades) the better balanced the sample will be (the close the percent of profitable trades to 50%), the better the training will be. The custom variable is calculated in the below function.
//+------------------------------------------------------------------+
//| Custom variable calculating function                             |
//+------------------------------------------------------------------+
double CustomPokazatelf(int VariantPokazatel)
{
   double custom_Pokazatel=0.0;
   if(VariantPokazatel==1)
   {
      double Total_Tr=(double)TesterStatistics(STAT_TRADES);
      double Pr_Tr=(double)TesterStatistics(STAT_PROFIT_TRADES);
      if(Total_Tr>0 && Total_Tr>15000)custom_Pokazatel=Pr_Tr/Total_Tr*100.0;
   }
   return(custom_Pokazatel);
}
Controlling the execution frequency of the main code part:
Trading decisions should be generated at a new bar opening. This will be checked by the following function:
//+-----------------------------------------------------------------+
//| Returns TRUE if a new bar has appeared on the current TF        |
//+-----------------------------------------------------------------+
bool isNewBar()
{
   datetime tm[];
   static datetime prevBarTime=0;

   if(CopyTime(Symbol(),Signal_MA_TF,0,1,tm)<0)
   {
      Print("%s CopyTime error = %d",__FUNCTION__,GetLastError());
   }
   else
   {
      if(prevBarTime!=tm[0])
      {
         prevBarTime=tm[0];
         return true;
      }
      return false;
   }
   return true;
}
Trading functions:
The Expert Advisor uses the "cPoza6" trading class. The idea was developed by me, and the main implementation was provided by Vasiliy Pushkaryov. I tested the class on the Moscow Exchange, but its concept has not been fully implemented. So, I invite everyone to improve it - namely, it needs functions for working with history. For this article, I disabled account type checks. So please be careful. The class was originally developed for netting accounts, but its operation will be enough in the Expert Advisor, allowing readers to study machine learning within this article.
Here is the Expert Advisor code without function descriptions (for clarity).
If we do not include some auxiliary functions and remove above function descriptions, the EA code looks as follows at this step:
//+------------------------------------------------------------------+
//| Expert initialization function                                   |
//+------------------------------------------------------------------+
int OnInit()
{
//--- Check the correctness of model response interpretation values
   if(Porog>=Pridel || Pridel<=Porog)return(INIT_PARAMETERS_INCORRECT);
   if(Use_Pred_Calc==true)
   {
      if(Init_Pred()==INIT_FAILED)return(INIT_FAILED);// Initialize indicator handles
      CB_Tabl();// Creating a table with predictors
      Solb_Copy_CB=csv_CB.Get_columns_count()-3;// Number of columns in the predictor table
   }
// Declare handle_MA_Slow
   handle_MA_Signal=iMA(Symbol(),Signal_MA_TF,Signal_MA_Period,1,Signal_MA_Metod,Signal_MA_Price);
   if(handle_MA_Signal==INVALID_HANDLE)
   {
      PrintFormat("Failed to create handle of the handle_MA_Signal indicator for the symbol %s/%s, error code %d",
                  Symbol(),EnumToString(Period()),GetLastError());
      return(INIT_FAILED);
   }
//--- Create a table to write model values - for debugging purposes
   if(Use_Save_Result==true)
   {
      csv_Chek.Add_column(dt_string,"Data");
      csv_Chek.Add_column(dt_double,"Rez");
   }
   return(INIT_SUCCEEDED);
}
//+------------------------------------------------------------------+
//| Expert deinitialization function                                 |
//+------------------------------------------------------------------+
void OnDeinit(const int reason)
{
   if(Save_Pred==true)Save_Pred_All();// Call a function to write predictors to a file
   delete csv_CB;// Delete the class instance
   delete csv_Arhiv;// Delete the class instance
   delete csv_Chek;// Delete the class instance
}
//+------------------------------------------------------------------+
//| Test completion event handler                                    |
//+------------------------------------------------------------------+
double OnTester()
{
   return(CustomPokazatelf(1));
}
//+------------------------------------------------------------------+
//| Expert tick function                                             |
//+------------------------------------------------------------------+
void OnTick()
{
//--- Operations are only executed when the next bar appears
   if(!isNewBar()) return;
//--- Get information on trading environment (deals/orders)
   OpenOrdersInfo();
//--- Get signal from the basic strategy
   if(Signal()==true)
   {
//--- Calculate predictors
      if(Use_Pred_Calc==true)Pred_Calc();
//---Apply the CatBoost model
      if(Use_Model_CB==true)Model_CB();
//--- If there is an open position at the signal generation time, close it
      if(PosType!="0")ClosePositions("Close Signal");
//--- Open a new position
      if (BuyNow==true)OpenPositions(BUY,1,0,0,"Open_Buy");
      if (SellNow==true)OpenPositions(SELL,1,0,0,"Open_Sell");
//--- Copy the table with the current predictors to the archive table
      if(Save_Pred==true)Copy_Arhiv();
   }
}
External Expert Advisor settings:
Now that we have considered the EA functions code, let us see which settings the EA has:
1. Configuring actions with predictors:
- "Calculate predictors" — set to "true" if you wish to save the selection or apply the CatBoost model;
- "Save predictors" — set to "true" if you wish to save predictors to a file for further training;
- "Volume type in indicators" — set the volume type: ticks or real exchange volume;
- "Show predictor indicators on a chart" — set to true if you wish to visualize the indicator;
- "Commission and spread in points to calculate target" — this is used for taking into account commission and spread in target labels, as well as for filtering minor positive transactions;
2. MA indicator parameters for the basic strategy signal:
- "Period";
- "Timeframe";
- "MA methods";
- "Calculation price";
3. CatBoost model application parameters:
- "Apply CatBoost model on data" — can be set to "true" after training and compiling the Expert Advisor with the trained model;
- "Threshold for classifying one by the model" — the threshold at which the model value will be interpreted as one;
- "Limit for classifying one by the model" — the limit up to which the model value will be interpreted as one;
- "Save model value to file" — set to "true" if you wish to obtain a file to check the model correctness.
Finding the right basic strategy settings
Now. let us optimize the basic strategy indicator. Select a custom criterion for evaluating the quality of strategy settings. I performed testing using spliced USDRUB_TOM Si futures contracts from Otkritie Broker (the symbol is called "Si Splice") in the time range between 01.06.2014 and 31.10.2020, with the M1 timeframe. Test mode: M1 OHLC simulation.
Expert Advisor optimization parameters:
- "Period": from 8 to 256 with a step of 8;
- "Timeframe": from M1 to D1, no step;
- "MA methods": from SMA to LWMA, no step;
- "Calculation price": from CLOSE to WEIGHTED.

Fig. 1 "Optimization results"
From these results, we need to select values with a high custom parameter — preferably 35% and higher, with a number of trades 15000 and more (the more the better). Optionally, other econometric variables can be analyzed.
I have prepared the following set to demonstrate the potential of creation of trading strategies using machine learning:
- "Period": 8;
- "Timeframe": 2 Minutes;
- "MA methods": Linear weighted;
- "Calculation price": High price.
Run a single test and check the result graph.

Fig. 2 "Balance before learning"
Such strategy settings can hardly be used in trading. The signal is very noisy and has a lot of false entries. Let us try to eliminate them. Unlike those who test multiple parameters of various indicators to filter a signal and thus spend extra computing power in areas where there was no indicator value or it was very rarely (which is statistically insignificant), we will only work with those areas where indicator values actually provided information.
Let us change the EA settings to calculate and to save the predictors. Then run a single test:
Configuring actions with predictors:
- "Calculate predictors" — set to "true";
- "Save predictors" — set to "true";
- "Volume type in indicators" — set the volume type: ticks or real exchange volume;
- "Show predictor indicators on a chart" — use "false";
- "Commission and spread in points to calculate target" — set to 50.
The rest settings are left unchanged. Let us run a single test in the Strategy Tester. Calculations are performed more slowly, because now we calculate and collect data from almost 2000 indicator buffers, as well as calculate other predictors.
Find the file at the agent running path (I use a portable mode, so mine is "F:\FX\Otkritie Broker_Demo\Tester\Agent-127.0.0.1-3002\MQL5\Files", " 3002" means the thread used for the agent operation) and check its contents. If the file with the table is successfully opened, then everything is fine.
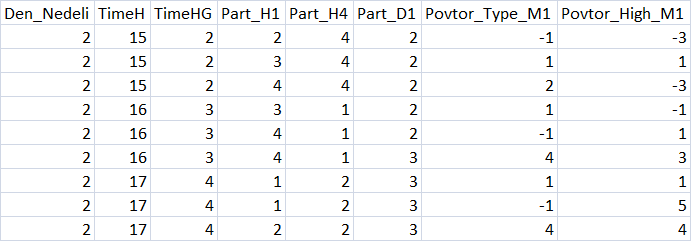
Fig. 3 "Summary of the predictors table"
Splitting the Sample
For further training, split the sample into three parts and save them to files:
- train.csv — the sample used for training
- test.csv — the sample to be used to control the training result ant to stop the training
- exam.csv — the sample to evaluate the training result
To split the sample, use script CB_CSV_to3x.mq5.
Specify the path to the directory in which the creation of a trading model will be performed, and the name of the file containing the sample.
Another created file is Test_CB_Setup_0_000000000 — it specifies the indexes of columns starting with 0, to which the following condition can be applies: disable the "Auxiliary" label and mark the target column with "Label". The contents of the file for our sample is as follows:
2408    Auxiliary
2409    Auxiliary
2410    Label
2411    Auxiliary
2412    Auxiliary
The file is located in the same place, where the sample prepared by the script is located.
CatBoost Parameters
CatBoost has various parameters and settings that affect the training result; they are all explained here. I will mention here the main parameters (and their keys, if any), which have a greater effect on model training results and which can be configured in the CB_Bat script:
- "Project directory" — specify the path to the directory where "Setup" sample is located;
- "CatBoost exe file name" — I used version catboost-0.24.1.exe; you should specify the version which you are using;
- "Boosting type (Model boosting scheme)" — two boosting options are selected:
- Ordered — better quality on small datasets, but it may be slower.
- Plain — the classic gradient boosting scheme.
- "Tree depth" (depth) — the depth of the symmetric decision tree, the developers recommend values between 6 and 10;
- "Maximum iterations (trees)" — the maximum number of trees that can be built when solving machine learning problems; the number of trees after learning can be less. If no model improvement appears in a testing or validation sample, the number of iterations should be changed in proportion to a change in the learning-rate parameter;
- "Learning rate" — gradient step speed, i.e. generalization criterion when building each subsequent decision tree. The lower the value, the slower and more precisely the training is, but this will take longer and will produce more iterations, so do not forget to change "Maximum number of iterations (trees)";
- "Method for automated calculation of target class weights" (class-weights) — this parameter allows improving the training of an unbalanced sample by a number of examples in each class. Three different balancing methods:
- None — all class weights are set to 1
- Balanced — class weight based on the total weight
- SqrtBalanced — class weight based in the total number of objects in each class
- "Method for selecting object weights" (bootstrap-type) — the parameter is responsible for how objects are calculated when predictors are searched for building a new tree. The following options are available:
- Bayesian;
- Bernoulli;
- MVS;
- No;
- "Range of random weights for object selection" (bagging-temperature) — it is used when Bayesian method is selected for calculating object for predictor search. This parameter ads randomness when selecting predictors for the tree, which helps in avoiding overfitting and in finding patterns. The parameters can take a value from zero to infinity.
- "Frequency to sample weights and objects when building trees" (sampling-frequency) — allows changing the frequency of predictor re-evaluation when building trees. Supported values:
- PerTree — before constructing each new tree
- PerTreeLevel — before choosing each new split of a tree
- "Random subspace method (rsm) — the percentage of predictors analyzed per training step 1=100%. A decrease in the parameter speeds up the training process, adds some randomness, but increases the number of iterations (trees) in the final model;
- "L2 regularization" (l2-leaf-reg) — theoretically, this parameter can reduce overfitting; it affects the quality of the resulting model;
- "The random seed used for training" (random-seed) — usually it is the generator of random weight coefficients at training beginning. From my experience, this parameter significantly affects model training;
- "The amount of randomness to score the tree structure (random-strength)" — this parameter affects the slit score when creating a tree, optimize it to improve model quality;
- "Number of gradient steps to select a value from the list" (leaf-estimation-iterations) — leaves are counted when the tree has already built. They can be counted a few gradient steps ahead - this parameter affects the training quality and speed;
- "The quantization mode for numerical features" (feature-border-type) — this parameter is responsible for different quantization algorithms on the sample objects. The parameter greatly affects the trainability of the model. Supported values:
- Median,
- Uniform,
- UniformAndQuantiles,
- MaxLogSum,
- MinEntropy,
- GreedyLogSum,
- "The number of splits for numerical features" (border-count) — this parameter is responsible for the number of splits of the entire value range of each predictor. The number of splits is usually actually less. The greater the parameter, the narrower the split -> the lower the percentage of examples. It significantly affects learning seed and quality;
- "Save borders to a file" (output-borders-file) — quantization borders can be saved to a file for further analysis to be used in subsequent training. It affects learning speed as it saves data every time a model is created;
- "Error score metrics for learning correction" (loss-function) — a function to be used to evaluate the error score when training a model. I haven't noticed significant influence on results. Two options are possible:
- Logloss;
- CrossEntropy;
- "The number trees without improvements to stop training" (od-wait) — if training stops quickly, try to increase the waiting number. Also change the parameter when learning speed changes: the lower the speed, the longer we wait improvements before completing training;
- "Error score metric function to training" (eval-metric) — allows choosing a metric from the list, according to which the tree will be truncated and the training will be stopped. Supported metrics:
- Logloss;
- CrossEntropy;
- Precision;
- Recall;
- F1;
- BalancedAccuracy;
- BalancedErrorRate;
- MCC;
- Accuracy;
- CtrFactor;
- NormalizedGini;
- BrierScore;
- HingeLoss;
- HammingLoss;
- ZeroOneLoss;
- Kappa;
- WKappa;
- LogLikelihoodOfPrediction;
- "Sample object" — allows selecting a model parameter for training. Options:
- No
- Random-seed — value used for training
- Random-strength — the amount of randomness to evaluate the tree structure
- Border-count — number of splits
- l2-Leaf-reg — L2 regularization
- Bagging-temperature — range of random weights for selecting objects
- Leaf_estimation_iterations — number of gradient steps to select a value from the list
- "Initial variable value" — set where training starts
- "End variable value" — set where training ends
- "Step" — value change step
- "Classification result presentation type"(prediction-type) — how the model responses will be written - does not affect training, used after training when applying the model with samples:
- Probability
- Class
- RawFormulaVal
- Exponent
- LogProbability
- "The number of trees in the model, 0 - all" — the number of trees in the model to be used for classification, allows evaluating a change in the classification quality when the model is applied on samples
- "Model analysis method" (fstr-type) — various model analysis methods enable evaluation of predictor significance for a certain model. Please share your ideas about them. Supported options:
- PredictionValuesChange — how the forecast changes when the object value changes
- LossFunctionChange — how the forecast changes when the object is excluded
- InternalFeatureImportance
- Interaction
- InternalInteraction
- ShapValues
The script allows searching a number of model setup parameters. To do this, select an object other than NONE and specify the starting value, the end value and the step.
Learning Strategy
I divide the learning strategy into three stages:
- Basic settings are parameters responsible for the depth and number of trees in the model, as well as for the training rate, the class weights and other settings to start the training process. These parameters are not searched; in most cases default settings generated by the script are enough.
- Search for optimal splitting parameters — CatBoost preprocesses the predictors table to search value ranges along the grid boundaries, and thus we need to find a grid in which training is better. It makes sense to iterate over all grid types with a range of 8-512; I use step increments at each value: 8, 16, 32 and so on.
- Again configure the script, specify the found predictor quantizing grid and after that we can move on to further parameters. Normally I only use "Seed" in the range of 1-1000.
In this article, for the first "learning strategy" stage we will use CB_Bat default settings. Splitting method will be set to "MinEntropy", the grid will test parameters from 16 to 512 with a step of 16.
To set up the parameters described above, let us use the "CB_Bat" script which will create text files containing the required keys for training models, as well as an auxiliary file:
- _00_Dir_All.txt - auxiliary file
- _01_Train_All.txt - settings for training
- _02_Rezultat_Exam.txt - settings for recording classification by the examination sample models
- _02_Rezultat_test.txt - settings for recording classification by the testing sample models
- _02_Rezultat_Train.txt - settings for recording classification by the learning sample models
- _03_Metrik_Exam.txt - settings for recording the metrics of each tree of the examination sample models
- _03_Metrik_Test.txt - settings for recording the metrics of each tree of the testing sample models
- _03_Metrik_Train.txt - settings for recording the metrics of each tree of the training sample models
- _04_Analiz_Exam.txt - settings for recording the assessment of predictor importance for the examination sample models
- _04_Analiz_Test.txt - settings for recording the assessment of predictor importance for the testing sample models
- _04_Analiz_Train.txt - settings for recording the assessment of predictor importance for the training sample models
We could create one file that would execute actions after training sequentially. But to optimize CPU utilization (which was especially important in earlier versions of CatBoost), I launch 6 files after training.
Model Training
Once the files are ready, rename file "_00_Dir_All.txt" to "_00_Dir_All.bat" and run it - it will create required directories to locate models and will change the extension of other files to "bat".
Now our project directory contains the "Setup" folder with the following contents:
- _00_Dir_All.bat - auxiliary file
- _01_Train_All.bat - settings for training
- _02_Rezultat_Exam.bat - settings for recording classification by the examination sample models
- _02_Rezultat_test.bat - settings for recording classification by the testing sample models
- _02_Rezultat_Train.bat — settings for recording classification by the learning sample models
- _03_Metrik_Exam.bat — settings for recording the metrics of each tree of the examination sample models
- _03_Metrik_Test.bat — settings for recording the metrics of each tree of the testing sample models
- _03_Metrik_Train.bat — settings for recording the metrics of each tree of the training sample models
- _04_Analiz_Exam.bat — settings for recording the assessment of predictor importance for the examination sample models
- _04_Analiz_Test.bat — settings for recording the assessment of predictor importance for the testing sample models
- _04_Analiz_Train.bat — settings for recording the assessment of predictor importance for the training sample models
- catboost-0.24.1.exe — executable file for training CatBoost models
- train.csv — the sample to be used for training
- test.csv — the sample to be used to control the training result ant to stop the training
- exam.csv — the sample to evaluate results
- Test_CB_Setup_0_000000000//File with information about the sample columns used for training
Run "_01_Train_All.bat" and watch the training process.
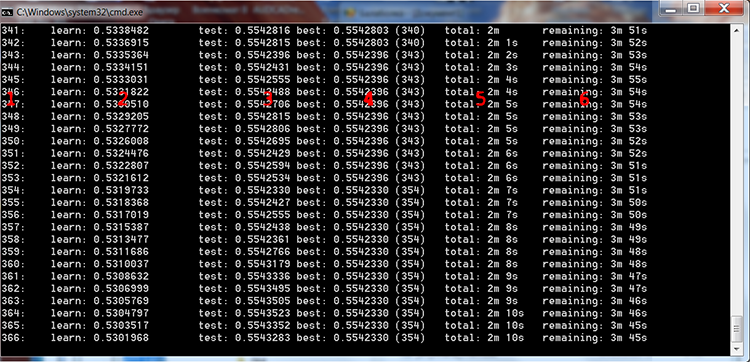
Fig. 4 CatBoost training process
I added red numbers in the above figure to describe the columns:
- The number of trees, equal to the number of iterations
- The result of calculating the selected loss function on the training sample
- The result of calculating the selected loss function on the control sample
- The best result of calculating the selected loss function on the control sample
- The actual time elapsed since model training started
- Estimated time remaining until the end of training if all trees specified by the settings are trained
If we select a search range in script settings, models will be trained in a loop as many times, as it is required according to the file contents:
FOR %%a IN (*.) DO (
catboost-0.24.1.exe fit  --learn-set train.csv   --test-set test.csv     --column-description %%a        --has-header    --delimiter ;   --model-format CatboostBinary,CPP       --train-dir ..\Rezultat\RS_16\result_4_%%a      --depth 6       --iterations 1000       --nan-mode Forbidden    --learning-rate 0.03    --rsm 1         --fold-permutation-block 1      --boosting-type Plain   --l2-leaf-reg 6         --loss-function Logloss         --use-best-model        --eval-metric Logloss   --custom-metric Logloss         --od-type Iter  --od-wait 100   --random-seed 0         --random-strength 1     --auto-class-weights SqrtBalanced       --sampling-frequency PerTreeLevel       --border-count 16       --feature-border-type MinEntropy        --output-borders-file quant_4_00016.csv         --bootstrap-type Bayesian       --bagging-temperature 1         --leaf-estimation-method Newton         --leaf-estimation-iterations 10
catboost-0.24.1.exe fit  --learn-set train.csv   --test-set test.csv     --column-description %%a        --has-header    --delimiter ;   --model-format CatboostBinary,CPP       --train-dir ..\Rezultat\RS_32\result_4_%%a      --depth 6       --iterations 1000       --nan-mode Forbidden    --learning-rate 0.03    --rsm 1         --fold-permutation-block 1      --boosting-type Plain   --l2-leaf-reg 6         --loss-function Logloss         --use-best-model        --eval-metric Logloss   --custom-metric Logloss         --od-type Iter  --od-wait 100   --random-seed 0         --random-strength 1     --auto-class-weights SqrtBalanced       --sampling-frequency PerTreeLevel       --border-count 32       --feature-border-type MinEntropy        --output-borders-file quant_4_00032.csv         --bootstrap-type Bayesian       --bagging-temperature 1         --leaf-estimation-method Newton         --leaf-estimation-iterations 10
catboost-0.24.1.exe fit  --learn-set train.csv   --test-set test.csv     --column-description %%a        --has-header    --delimiter ;   --model-format CatboostBinary,CPP       --train-dir ..\Rezultat\RS_48\result_4_%%a      --depth 6       --iterations 1000       --nan-mode Forbidden    --learning-rate 0.03    --rsm 1         --fold-permutation-block 1      --boosting-type Plain   --l2-leaf-reg 6         --loss-function Logloss         --use-best-model        --eval-metric Logloss   --custom-metric Logloss         --od-type Iter  --od-wait 100   --random-seed 0         --random-strength 1     --auto-class-weights SqrtBalanced       --sampling-frequency PerTreeLevel       --border-count 48       --feature-border-type MinEntropy        --output-borders-file quant_4_00048.csv         --bootstrap-type Bayesian       --bagging-temperature 1         --leaf-estimation-method Newton         --leaf-estimation-iterations 10
catboost-0.24.1.exe fit  --learn-set train.csv   --test-set test.csv     --column-description %%a        --has-header    --delimiter ;   --model-format CatboostBinary,CPP       --train-dir ..\Rezultat\RS_64\result_4_%%a      --depth 6       --iterations 1000       --nan-mode Forbidden    --learning-rate 0.03    --rsm 1         --fold-permutation-block 1      --boosting-type Plain   --l2-leaf-reg 6         --loss-function Logloss         --use-best-model        --eval-metric Logloss   --custom-metric Logloss         --od-type Iter  --od-wait 100   --random-seed 0         --random-strength 1     --auto-class-weights SqrtBalanced       --sampling-frequency PerTreeLevel       --border-count 64       --feature-border-type MinEntropy        --output-borders-file quant_4_00064.csv         --bootstrap-type Bayesian       --bagging-temperature 1         --leaf-estimation-method Newton         --leaf-estimation-iterations 10
catboost-0.24.1.exe fit  --learn-set train.csv   --test-set test.csv     --column-description %%a        --has-header    --delimiter ;   --model-format CatboostBinary,CPP       --train-dir ..\Rezultat\RS_80\result_4_%%a      --depth 6       --iterations 1000       --nan-mode Forbidden    --learning-rate 0.03    --rsm 1         --fold-permutation-block 1      --boosting-type Plain   --l2-leaf-reg 6         --loss-function Logloss         --use-best-model        --eval-metric Logloss   --custom-metric Logloss         --od-type Iter  --od-wait 100   --random-seed 0         --random-strength 1     --auto-class-weights SqrtBalanced       --sampling-frequency PerTreeLevel       --border-count 80       --feature-border-type MinEntropy        --output-borders-file quant_4_00080.csv         --bootstrap-type Bayesian       --bagging-temperature 1         --leaf-estimation-method Newton         --leaf-estimation-iterations 10
catboost-0.24.1.exe fit  --learn-set train.csv   --test-set test.csv     --column-description %%a        --has-header    --delimiter ;   --model-format CatboostBinary,CPP       --train-dir ..\Rezultat\RS_96\result_4_%%a      --depth 6       --iterations 1000       --nan-mode Forbidden    --learning-rate 0.03    --rsm 1         --fold-permutation-block 1      --boosting-type Plain   --l2-leaf-reg 6         --loss-function Logloss         --use-best-model        --eval-metric Logloss   --custom-metric Logloss         --od-type Iter  --od-wait 100   --random-seed 0         --random-strength 1     --auto-class-weights SqrtBalanced       --sampling-frequency PerTreeLevel       --border-count 96       --feature-border-type MinEntropy        --output-borders-file quant_4_00096.csv         --bootstrap-type Bayesian       --bagging-temperature 1         --leaf-estimation-method Newton         --leaf-estimation-iterations 10
catboost-0.24.1.exe fit  --learn-set train.csv   --test-set test.csv     --column-description %%a        --has-header    --delimiter ;   --model-format CatboostBinary,CPP       --train-dir ..\Rezultat\RS_112\result_4_%%a     --depth 6       --iterations 1000       --nan-mode Forbidden    --learning-rate 0.03    --rsm 1         --fold-permutation-block 1      --boosting-type Plain   --l2-leaf-reg 6         --loss-function Logloss         --use-best-model        --eval-metric Logloss   --custom-metric Logloss         --od-type Iter  --od-wait 100   --random-seed 0         --random-strength 1     --auto-class-weights SqrtBalanced       --sampling-frequency PerTreeLevel       --border-count 112      --feature-border-type MinEntropy        --output-borders-file quant_4_00112.csv         --bootstrap-type Bayesian       --bagging-temperature 1         --leaf-estimation-method Newton         --leaf-estimation-iterations 10
catboost-0.24.1.exe fit  --learn-set train.csv   --test-set test.csv     --column-description %%a        --has-header    --delimiter ;   --model-format CatboostBinary,CPP       --train-dir ..\Rezultat\RS_128\result_4_%%a     --depth 6       --iterations 1000       --nan-mode Forbidden    --learning-rate 0.03    --rsm 1         --fold-permutation-block 1      --boosting-type Plain   --l2-leaf-reg 6         --loss-function Logloss         --use-best-model        --eval-metric Logloss   --custom-metric Logloss         --od-type Iter  --od-wait 100   --random-seed 0         --random-strength 1     --auto-class-weights SqrtBalanced       --sampling-frequency PerTreeLevel       --border-count 128      --feature-border-type MinEntropy        --output-borders-file quant_4_00128.csv         --bootstrap-type Bayesian       --bagging-temperature 1         --leaf-estimation-method Newton         --leaf-estimation-iterations 10
catboost-0.24.1.exe fit  --learn-set train.csv   --test-set test.csv     --column-description %%a        --has-header    --delimiter ;   --model-format CatboostBinary,CPP       --train-dir ..\Rezultat\RS_144\result_4_%%a     --depth 6       --iterations 1000       --nan-mode Forbidden    --learning-rate 0.03    --rsm 1         --fold-permutation-block 1      --boosting-type Plain   --l2-leaf-reg 6         --loss-function Logloss         --use-best-model        --eval-metric Logloss   --custom-metric Logloss         --od-type Iter  --od-wait 100   --random-seed 0         --random-strength 1     --auto-class-weights SqrtBalanced       --sampling-frequency PerTreeLevel       --border-count 144      --feature-border-type MinEntropy        --output-borders-file quant_4_00144.csv         --bootstrap-type Bayesian       --bagging-temperature 1         --leaf-estimation-method Newton         --leaf-estimation-iterations 10
catboost-0.24.1.exe fit  --learn-set train.csv   --test-set test.csv     --column-description %%a        --has-header    --delimiter ;   --model-format CatboostBinary,CPP       --train-dir ..\Rezultat\RS_160\result_4_%%a     --depth 6       --iterations 1000       --nan-mode Forbidden    --learning-rate 0.03    --rsm 1         --fold-permutation-block 1      --boosting-type Plain   --l2-leaf-reg 6         --loss-function Logloss         --use-best-model        --eval-metric Logloss   --custom-metric Logloss         --od-type Iter  --od-wait 100   --random-seed 0         --random-strength 1     --auto-class-weights SqrtBalanced       --sampling-frequency PerTreeLevel       --border-count 160      --feature-border-type MinEntropy        --output-borders-file quant_4_00160.csv         --bootstrap-type Bayesian       --bagging-temperature 1         --leaf-estimation-method Newton         --leaf-estimation-iterations 10
)
Once training has completed, we will launch all 6 remaining bat files at once, to obtain training results in the form of labels and statistical values.
Express Assessment of Learning Results
Let us use the CB_Calc_Svod.mq5 script to obtain metric variables of the models and their financial results.
This script has a filter for selecting models by the final balance on the examination sample: if the balance is higher than a certain value, then a balance graph can be built from the sample and the sample converted to mqh and saved to a separate directory of the CatBoost model project.
Wait for the script to complete - in this case you will see the newly created "Analiz" containing the CB_Svod.csv file, and balance graphs by the model name, if their plotting was selected in the settings, as well as the "Models_mqh" directory containing the models converted to mqh format.
The CB_Svod.csv file will contain metrics of each model for which individual sample, along with financial results.
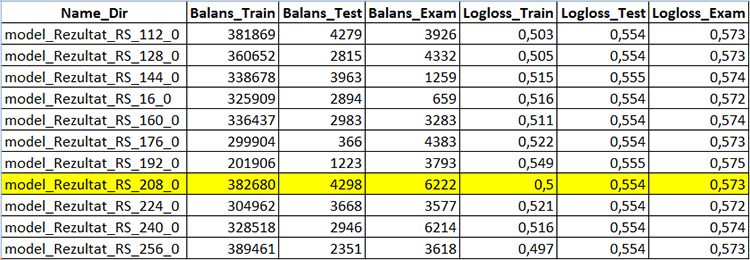
Fig. 5 Part of table containing model creation results - CB_Svod.csv
Select the model you like from the Models_mqh subdirectory of the directory in which our models were trained, and add it to the Expert Advisor directory. Comment the line with empty buffers at the beginning of the EA code using "//". Now, we only need to connect the model file to the EA:
//If the CatBoost model is in an mqh file, comment the below line
//uint TreeDepth[];uint TreeSplits[];uint BorderCounts[];float Borders[];double LeafValues[];double Scale[];double Bias[];
#include "model_RS_208_0.mqh";                 // Model file
After compiling the Expert Advisor, set the "Apply CatBoost model on data" setting to "true", disable sample saving and run the Strategy Tester with the following parameters.
1. Configuring actions with predictors:
- "Calculate predictors" — set to "true";
- "Save predictors" — set to "false"
- "Volume type in indicators" — set the volume type which you used in training
- "Show predictor indicators on a chart" — use "false"
- "Commission and spread in points to calculate target" — use the previous value, it does not affect the ready model
2. MA indicator parameters for the basic strategy signal:
- "Period": 8;
- "Timeframe": 2 Minutes;
- "MA methods": Linear weighted;
- "Calculation price": High price.
3. CatBoost model application parameters:
- "Apply CatBoost model on data" — set to "true"
- "Threshold for classifying one by the model" — leave 0.5
- "Limit for classifying one by the model" — leave 1
- "Save model value to file" — leave "false"
The following result was received for the entire sample period.
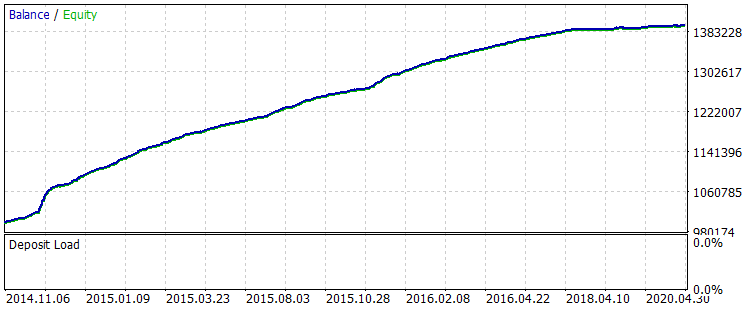
Fig. 6 Balance after training for a period 01.06.2014 - 31.10.2020
Let's compare two balance graphs on the interval from 01.08.2019 to 31.10.2020, which is outside of training period - this corresponds to the exam.csv sample, before and after training.
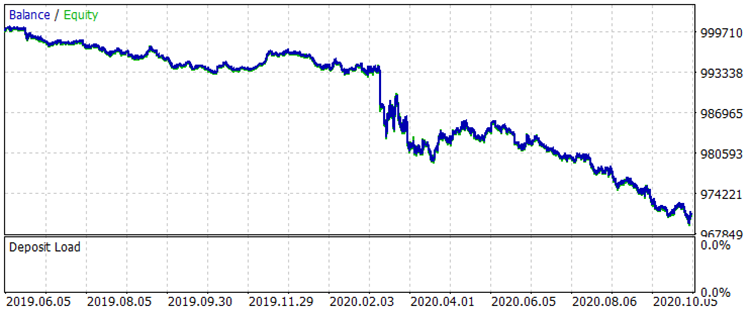
Fig. 7 Balance before training for the period 01.08.2019 - 31.10.2020
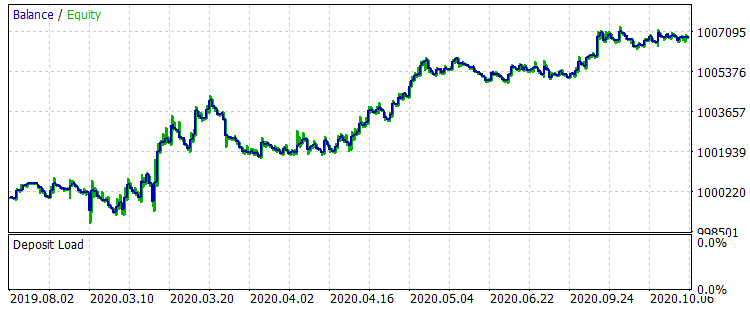
Fig. 8 Balance after training for the period 01.08.2019 - 31.10.2020
The results are not very impressive, but it can be noted that the main trading rule "avoid money loss" is observed. Even if we choose another model from the CB_Svod.csv file, the effect would still be positive, because the financial result of the most unsuccessful model that we got is -25 points, and the average financial result of all models is 3889.9 points.
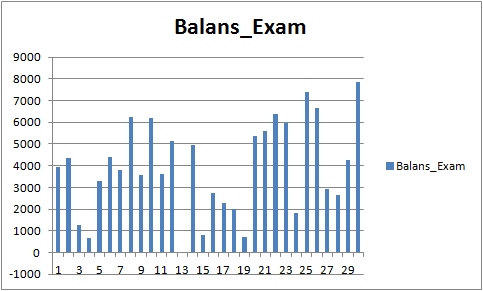
Fig. 9 Financial result of trained models for the period 01.08.2019 - 31.10.2020
Analysis of Predictors
Each model directory (for me MQL5\Files\CB_Stat_03p50Q\Rezultat\RS_208\result_4_Test_CB_Setup_0_000000000) has 3 files:
- Analiz_Train — analysis of predictor importance on the training sample
- Analiz_Test — analysis of predictor importance on the testing (validation) sample
- Analiz_Exam — analysis of predictor importance on the examination (out-of-training) sample
The content will be different, depending on the "Model analysis method" selected when generating files for training. Let us view the content with "PredictionValuesChange".
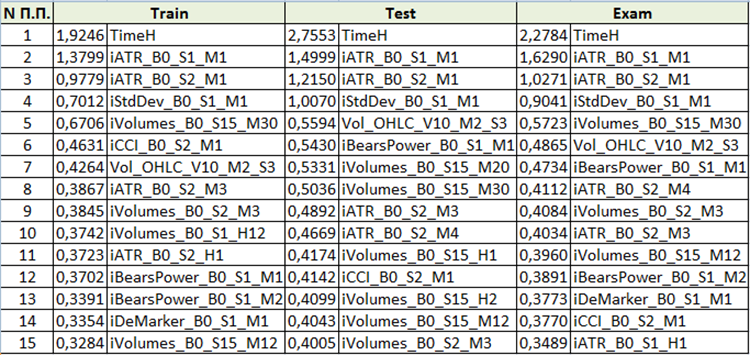
Fig. 10 Summary table of predictor importance analysis
Based on the assessment of predictor importance, we can conclude that the first four predictors are consistently important for the resulting model. Please note that predictor importance depends not only on the model itself, but also on the original sample. If the predictor did not have enough values in this sample, then it cannot be objectively evaluated. This method allows to understand the general idea of predictor importance. However, please be careful with it when working with trading symbol-based samples.
Conclusions
- The effectiveness of machine learning methods, such as gradient boosting, can be compared to that of an endless iteration of parameters and manual creation of additional trading conditions in an effort to improve strategy performance.
- Standard MetaTrader 5 indicators can be useful for machine learning purposes.
- CatBoost — is a high-quality library having a wrapper, which enables the efficient usage of gradient boosting without learning Python or R.
Conclusion
The purpose of this article is to draw your attention to machine learning. I really hope that the detailed methodology description and the provided reproduction tools will lead to the appearance of new machine learning fans. Let us unite in an effort to find new ideas concerning machine learning, in particular ideal about how to search for predictors. The quality of a model depends on the input data and the target, and by joining our efforts we can achieve the desired result faster.
You are more than welcome to report errors contained in my article and code.
Translated from Russian by MetaQuotes Ltd.
Original article: https://www.mql5.com/ru/articles/8657
Warning: All rights to these materials are reserved by MetaQuotes Ltd. Copying or reprinting of these materials in whole or in part is prohibited.
This article was written by a user of the site and reflects their personal views. MetaQuotes Ltd is not responsible for the accuracy of the information presented, nor for any consequences resulting from the use of the solutions, strategies or recommendations described.

 A scientific approach to the development of trading algorithms
 Custom symbols: Practical basics
- Free trading apps
- Over 8,000 signals for copying
- Economic news for exploring financial markets
You agree to website policy and terms of use
If you were to apply this to a different EA then do you just apply the catboost model before the order is place and leave everything else the same, or do you need to modify the model_CB() , or copy_arhiv()? It doesn't seem to be opening orders when the CB model is applied.
You can add or change the input signal in the Signal() function.
Have you trained the CatBoost model?
If you did everything right, it should work.
Yeah I did train the model. so what if the EA closes, reduces, or reverses positions on the opposite signal do you want to filter those using the model. or simply filter out new orders from opening?
Yeah I did train the model. so what if the EA closes, reduces, or reverses positions on the opposite signal do you want to filter those using the model. or simply filter out new orders from opening?
I didn't understand the thought: " do you want to filter those using the model ".
With the help of the model, signals for opening a position are filtered in the article.
I didn't understand the thought: " do you want to filter those using the model ".
With the help of the model, signals for opening a position are filtered in the article.
Your if your EA has an opposite signal it can close orders. If at boost can theoretically reduce false signals. They if the opposite signal closes orders, then catboost would reduce the false orders from closing and the result would be you leave orders open longer and greater profit is achieved. For example. You place an order when your MA crosses. your stoploss is 50 pips and TP is 50. However, there MA crosses back over before you it your SL or TP, and your EA is programed to close the order it his happens: this is referred to as close (or reduce, or reverse) on the opposite signal. Now if that signal was a false alarm, then you closes your profit too early, when it could have gone up to your TP instead. So catboost could have filtered a certain percentage of those false signals? This is my question. Not all EA's close positions on the opposite signal. Many just have a fixed Sl and TP. That is why I asked this question. Because some EA's have this functionality.
Your if your EA has an opposite signal it can close orders. If at boost can theoretically reduce false signals. They if the opposite signal closes orders, then catboost would reduce the false orders from closing and the result would be you leave orders open longer and greater profit is achieved. For example. You place an order when your MA crosses. your stoploss is 50 pips and TP is 50. However, there MA crosses back over before you it your SL or TP, and your EA is programed to close the order it his happens: this is referred to as close (or reduce, or reverse) on the opposite signal. Now if that signal was a false alarm, then you closes your profit too early, when it could have gone up to your TP instead. So catboost could have filtered a certain percentage of those false signals? This is my question. Not all EA's close positions on the opposite signal. Many just have a fixed Sl and TP. That is why I asked this question. Because some EA's have this functionality.
I understood what the conversation was about.
Programmatically, it's easy to implement, but it will be a game with randomness. The fact is that the Recall index in the models is quite low, i.e. the model does not recognize more than 10% of all events, which means that the opposite position is often not open due to an unidentified pattern. This is, among other things, related to predictors. The article shows the algorithm for implementing CatBoost models. It is necessary to strengthen the model with predictors, then your proposed approach will be more justified.