
Thomas DeMark's Sequential (TD SEQUENTIAL) using artificial intelligence

1. Introduction
The artificial intelligence systems spread throughout the daily activities of man. Traders were among the first to adopt them. Let us discuss how an artificial intelligence system based on neural networks can be used in trading.
First, let's settle that a neural network cannot trade on its own. That is, if there is a neural network, it can be supplied with an indefinite amount of price data, indicators and other delicacies — no end result will ever be obtained, so this idea can be discarded right away. A neural network can only stand next to a strategy, "serve" it: assist in making decisions, filtering, predicting. A neural network that represents a complete strategy is a nonsense (at least I personally have never seen any).
In this article, I will tell you how to successfully trade by merging a very well-known strategy and a neural network. It will be about the Thomas DeMark's Sequential strategy with the use of an artificial intelligence system. Sequential is well described by DeMark in the book "The New Science of Technical Analysis", which will be useful for reading to any trader. You can find more details on the book here.
First, a few words about the strategy. Sequential is a countertrend strategy. Signals appearing in it do not depend on each other. In other words, the buy and sell signals can be received in a row, which greatly complicates the use of Sequential. Like any other strategy, it generates false signals, which we will look for. The principle of generating signals based on Sequential is well described by the author himself. His interpretation will be slightly modified here. Only the first part of the strategy will be applied, using the Setup and Intersection signals. They were chosen for two reasons: firstly, these signals are located at the tops and bottoms; secondly, they occur much more frequently than Countdown and Entry.
Please note: an artificial intelligence can be embedded into absolutely any trading strategy, even the conventional MA crossover. In either case, the moment for making a decision will the most important in any strategy. The point is that analyzing each bar is a utopia. Therefore, it is necessary to determine the moments, the bars for analyzing the market situation. This is precisely what a trading strategy is meant for. Again, the analysis methods may be absolutely arbitrary, from the MA crossover to fractal formations, as long as a signal is received. In the case of Sequential, we are interested in a window of green dots, during which the market situation is to be identified and the validity of a signal is to be determined.
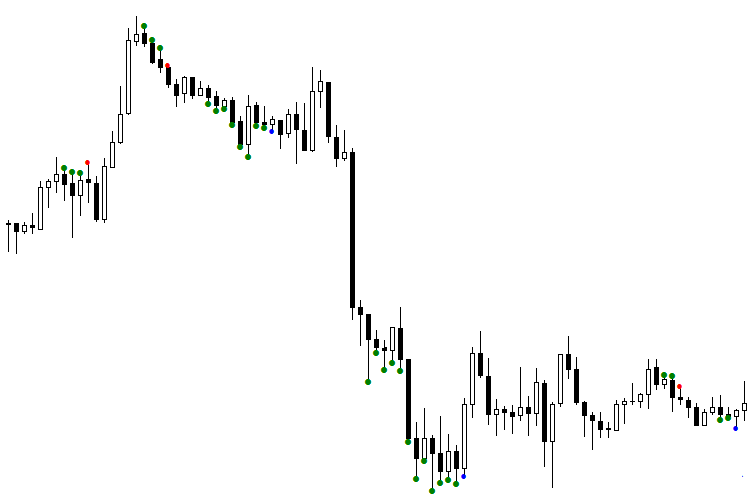
Fig. 1. The TDSEQUENTA by nikelodeon.mql5 indicator
Let us analyze the figure that shows the operation of the Sequential trading strategy without a neural network. In the figure, you can see the appearance of green dots. An adaptive version of the strategy is shown here — not using a specific number of bars (for example, 9 consecutive bars), but rather while a condition is met. As soon as the strategy's condition is no longer fulfilled, a signal appears. Thus, every signal appears after its own number of dots, depending on the current market situation. This is where the Sequential adapts to the market. This effect provides the ability to analyze the window that consists of green dots. This window has a different duration for every signal. This gives a certain advantage when using an AI. The following color scheme was selected: a blue dot after green dots indicates a buy signal, red dot — sell signal.
It can be seen that the first sell signal (red dot) turned out to be false, because the signal following it was higher. When working from signal to signal, entering the market using this red dot would certainly result in losing money. The first blue dot was also deceptive: buying at that price would bring a significant drawdown. How to separate the signals into false and valid? This task can be solved by artificial intelligence, namely, a neural network (NN).
2. Market context
A trading system worked perfectly the day before yesterday. Yesterday, it messed up badly. Today, everything is tolerable again. Sounds familiar? Of course, every trader faces the fact that the quality of the trading system varies from day to day. The problem is not with the system itself. The so-called trading day context is to blame. It is formed on the basis of the previous change in the traded volume, open interest and price fluctuations. Simply put, the trading background is determined precisely by these data, which are different at the close of each day. This brings us to an important recommendation: optimize your robots on the days that have conditions similar to the days when it is supposed to trade. The most difficult task when optimizing NN is to make sure the training sample does not include the patterns that will be formed during the current day. The Daily context is one of such inclusion.
Let's consider the following example. Today, the trade volume and open interest fell, while the rates rose. Apparently, the market is weakening, and a downward reversal is to be expected. By training the NN using ONLY the days that have decreasing volume and open interest with a simultaneous increase in the rates, there is a greater probability to provide the NN's inputs with the patterns that have a higher chance to occur throughout the day. This will have the NN trained in terms of the Market context. The market is more likely to react the same way it did on the day with similar parameters. It is easy to calculate that there are only nine variants of the volume, price and open interest combinations. By training the network for each context separately, the entire market will be covered. Nine trained models work for two weeks on average, and longer in some cases.
It is very easy to arrange the work within the daily context with the help of the eVOLution-dvoid.1.3 (1) indicator. This indicator basically reads the data from the dvoid-BP.csv file located in the directory ...\Files\evolution-dvoid\. It can be seen that the quotes of the British pound against the US dollar are used here. In order to correctly display the data and to be able to subsequently use them exactly in the context of the day, it is necessary to visit the Chicago Stock Exchange site every morning at about 7:30 Moscow time. Download a Daily Bulletin (number 27 for the British pound), which indicates the volume and open interest at the close of the previous day. These data should be added to the "dvoid-BP.csv" every day before the trading starts. During the day, the indicator will display the changes in the volume compared to the previous value. That is, not the actual value of the market volume is required, but its change. The same goes for the open interest: its relative movement is important.
dvoid-BP.csv
3. Approach to organizing the model
To increase the training sample and to provide the proper level of generalization, it is necessary to introduce an important condition. The signals will be separated into valid and false separately for buying and selling. This way the resources of the NN itself will not be wasted on sorting the signals. We will separate those signals in advance and build two models: one will be responsible for the buy signals, and the other for the sell signals. This simple trick doubles the size of the training sample. Known fact: the greater the training sample and the higher its generalization level, the longer the model remains adequate to the market.
Let us introduce the concept of confidence interval: the interval where the model is trusted and considered suitable for use. Suppose that the confidence interval for a calculated model comprises 1/3 of the training interval. That is, after training the model on 30 signals, we assume that its adequate operation period will be 10 signals. However, it is not uncommon for a model to last three times longer than the training interval.
It is noted (and quite natural) that when the training interval increases, the generalizing ability of the model decreases. This confirms the theory that the Holy Grails do not exist. If we would be able to train a NN on all history of the market with 100% level of generalization, we would obtain an ideal model capable of working indefinitely. Alas, practice shows that this is a utopia. But building a good long-term model is still possible. The secret lies in the data passed to the network as input. If they reflect the essence of the output variable and are the cause for it, then building a model will be no trouble.
By the way, about the output variable. It is as difficult to choose it as finding the input data for building a network. By looking at the history data of the signals, it is possible to accurately determine which of them were valid and which were false. As a rule, when building the output variable, each signal is interpreted unambiguously, making the network output ideal. That is, the output does not contain a single error, and this makes the NN strive to the same ideal outputs in learning. Naturally, obtaining a model with a generalization level of 100% on a long interval is virtually impossible. After all, it is unlikely that there will be such data that would interpret the signals of the output variable without errors long enough. Moreover, if such data is present, using a neural network becomes completely unnecessary.
Due to this, the output variable should be formed with slight errors, where small losses from signals are covered by significant profits. This results in an output variable that is not ideal, but has the potential to increase the deposit. In other words, errors cause insignificant losses, which are more than covered by other profitable signals. This allows obtaining a model with a high level of generalization to the output variable. In this case, it is very important that the degree of error of such model is known. Therefore, the confidence in the signal will have this correction.
And finally, the most important aspect when building models is choosing a meaning for the output variable. Naturally, profit comes to mind first. The profitable signals in the past will be denoted as 1 and losing ones as 0. However, there are many other semantic variables for output, which will provide additional valuable information about the market. For example: will there be a rollback after a signal, will a certain profit ever be reached, will the bar following the signal be bearish or bullish? Therefore, an output variable can be assigned a meaning in a variety of ways, while using the same input data. This produces more information about the market, and if multiple models confirm each other, the probability of profit increases.
I often meet traders who attempt to receive 100 or more signals over a long interval. So, I do not share this desire. In my opinion, 10-15 signals are sufficient to make a living, but their error must not exceed 20%. This is due to the fact that even if two signals out of ten give the maximum loss, we are still left with eight correct ones. At least two of them will generate enough profit to cover the losses.
So, how does one make a model that will work long enough? For example, we require a stable operation of the system on M5 during one or two weeks — a good result, if working without over-optimization. Suppose that the main indicator, the main trading system (in our case, the Sequential) generates an average of 5 signals each day. 10 signals will be taken for each of the nine models of the market context. At that, there are only five trading days in a week. This means that some models will not work at all, while some will work. Practice shows that each model is triggered not more than twice a week, and very rarely — thrice a week. This indicates that a Generalized NN will work even longer than one week, considering the confidence interval for a period outside the sample of 10 signals.
4. Theory of Neural Networks
Now let us move on to the theory of neural networks. You may have thought that I would be teaching you topologies, names and methods of training? You are wrong.
We will discuss the following. There are two directions in using neural networks, which differ in topology. One of them is predicting, the other is classifying.
A predicting network generates a future value of the output variable. It is believed that it also generates the degree of the quotes' direction (up or down) in addition to the direction itself. For example, the current EUR rate is 1.0600, and the network outputs that it will rise to 1.0700 in an hour - the network predicts these +100 points. Please note that I do not approve such approach to neural networks, because the future is not defined. Personally, I find this philosophical argument sufficient to abandon this method of working with NN. Of course, I realize that this is just a matter of taste, and it is worth mentioning that predicting networks do their job quite well.
However, I prefer classification networks. They give the idea of the current state of the market, and the more accurately it is determined, the more successive the trading will be. In both cases, receiving a response from network causes us to take some action. In the first case, we buy at 1.0600 and sell once the price reaches 1.0700. In the second case, simply buy and exit the trade at the next signal, but the precise price level cannot be predicted.
In order to reveal the essence of this approach, see one historical anecdote. One day, the world chess champion Garry Kasparov was asked how many moves forward in a game he thinks through when planning the next move. Everyone thought that Kasparov would say some great figure. However, what chess player had said proves that far from everyone understands even the essence of the game: "The most important thing in chess is not how many steps ahead you think through, but how well you analyze the current situation". The same applies to the foreign exchange market: to understand the essence of the game, it is not necessary to look several bars ahead. It is enough to determine the current state of the market at a certain moment and make the right move.
This is the ideology I prefer the most, but again, it is a matter of taste. Predicting neural networks are also quite popular, they cannot be denied the right to exist.
5. Internal organization of the artificial intelligence system
Along with the existence of two approaches to the construction and use of neural networks (prediction and classification), this subject includes two types of specialists - developers of AI systems and their users. I am sure that Stradivari had played his violins very well, although he had not become famous as a great virtuoso. The creator of the instrument is certainly able to use it, but not always the master can fully realize the potential of what he had created. Unfortunately, I was unable to contact the author of the optimizer described here: he does not respond to emails. However, he is known to many regulars of the forum. His name is Yury Reshetov.
I used his approach in the work, and as a result of communication with him, I found out the internal structure of the optimizer, which I want to tell you about. I hope the author will not mind: the product was published in open source. As a user of AI systems, I do not need to understand the program code, but knowing the internal structure of the optimizer is necessary. I highlighted this product mainly because the optimizer uses a training method different from the classical ones. The weak point in training neural networks is their overtraining. It is virtually impossible to determine if it happened and to what extent. Reshetov's optimizer uses a different approach: a network cannot be overtrained, it can only be undertrained. This approach allows evaluating the quality of network learning as a percentage. There is an upper limit of 100%, to which we aspire (it is very difficult to achieve such a result). Once we obtain a network trained at the 80% level, for instance, we will know that the network produces an error in 20% of the cases, and can be ready for it. This is one of the main advantages of the method.
The optimizer operation results in a file with code. It contains two networks, each of them is a nonlinear equation. Each of the functions first normalizes the data, which are subsequently fed to the input of the nonlinear equation. A "committee" made of two networks has been implemented to increase the generalizing ability. If both say "yes", then the signal is valid; if both say "no" — false. If the values of two networks are different, then a "not sure" response is received. Please note: there is no "not sure" state in the past, because it is always possible to categorize the signal on past data. Thus, here, "not sure" implies the simultaneous possibility of both false and valid signals. This gives a transition from binary calculations to quantum ones. As an analogy, consider a qubit: it can take the values 1 and 0. Same with "not sure": this response can be both one and zero in the history. A small trick hidden here will be used in trading. It will be discussed a bit later.
Let us move on to preparation of data. The data themselves are represented as an Excel table. The columns here are the network inputs. The last column is the output variable. According to its meaning, this column contains ones and zeros. In our case, a signal that received profit is denoted by 1, and the one with a loss is 0. The rows of this table represent the data stored when the signal appears. When loaded into the optimizer, this table is split into two samples — training and test, with the two networks training crosswise. But the calculation and optimization are performed with the committee of these networks. Thus, the training of each network is performed separately, but with consideration of the overall result.
At the end of the section, I emphasize: the used AI system or programming environment does not matter. Even the most primitive perceptron can be trained using the method of back propagation of the error and not be overtrained, thanks to good data at the network's input. The essential component is not the AI system, but the quality of used data. Therefore, the optimizer normalizes the data first, and after that the data is fed to a conventional nonlinear equation. And if the input data are the reason for the output variable, then this simple equation with some 20 coefficients will produce 10 signals with an error of 20% in the near future. It has been repeatedly noted, however, that any price transformation leads to a lag. Therefore, any indicator usually gives a delay, which affects the operation of AI systems. The input and output variables will be discussed in detail in the next article.
6. TD Sequential and NN
Now let us move on to the practical application of the theory described above.
We will analyze an interval with live trading. The NN operation will be demonstrated by blue arrows. When the arrow points down at a red dot, this means that the sell signal is valid; when the arrow points up, the signal is false. If the arrow is missing, it indicates the "not sure" response. The buy signals (blue dot) are opposite: an upwards arrow means a valid signal, while a downwards arrow indicates a false one.
Let us consider the operation of the model during the day. At first glance, it would be difficult to make money but actually this is not the case. Understanding of the separation principle comes to aid. For example, there are two signals that are different from each other. According to the AI, one of them is a false sell signal, which actually earned a profit. After receiving the next "false" sell signal from the AI, it is necessary to check if both those signals refer to the same separation area, or if they are simply the same. If so, for the signal to lead to profit, it is necessary to orient the indicator so that the arrow becomes aligned with the market direction, that is, towards the signal's profit.
Take a look at the figure. The first sell signal (red dot) turned out to be unprofitable. But when the arrow is turned downwards, it becomes profitable, as sell signal #2 fell in the same area with the signal #1. By turning the arrow, the second signal became profitable as well, which could be traded. Now consider a buy signal. As it can be seen, in this case the AI made a mistake again, assuming a profitable signal to be false. It only remains to fix the situation and reverse the arrow of the buy signal #3. As a result, signal #4 began to indicate the correct direction. But the signal #5 got into another area, different from the previous signal, and led to a market reversal in general.
In other words, we obtained a steadily losing anti-model, reversed it and got a profitable model! I call this method Model orientation. As a rule, it is realized during one signal. It is sufficient to wait for one buy signal and one sell signal to appear at the beginning of the day, orient them and use them for work. This way, at least 3-4 signals are obtained in a day. The point is not in checking the past signals and their performance. Instead, it is necessary to compare two latest signals with each other, check if they belong to one group or not, and see what action must be taken, if the result of the previous signal is known. At the same time, do not forget that the neural network may produce an error.
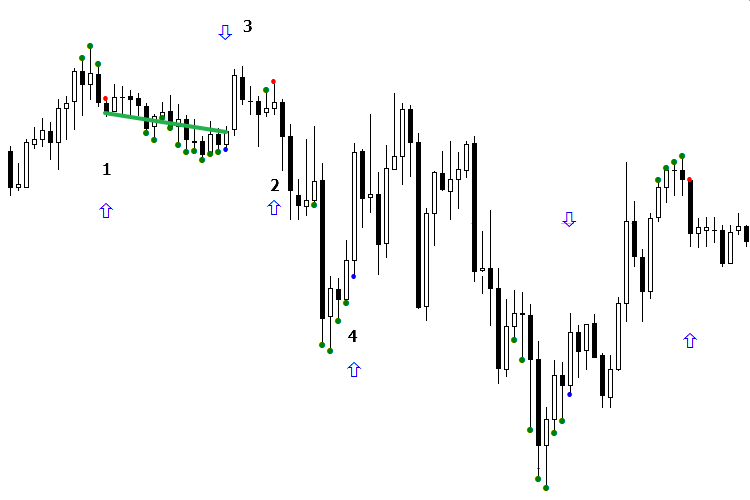
Fig. 2. Indicators BuyVOLDOWNOPNDOWN.mq5 and SellVOLDOWNOPNDOWN.mq5
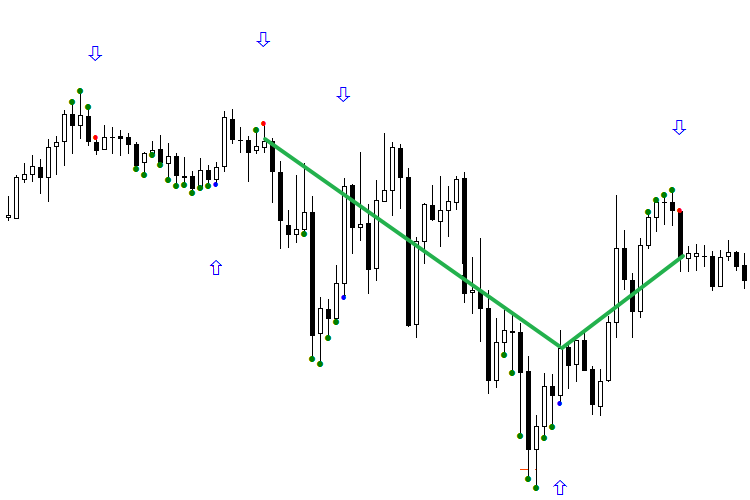
Fig. 3. Oriented indicators BuyVOLDOWNOPNDOWN.mq5 and SellVOLDOWNOPNDOWN.mq5
The following two figures show the operation of the network during 4 days. It should be noted that only the second signal is used in operation. All signals that have received profit are marked with a green line, ones with a loss are red. The first figure demonstrates a pure operation of the network, the second one shows the operation oriented according to the first signal of the day. The first one is definitely not impressive. But if you look at the second figure and begin processing trades starting from the second signal of each day, with the trading system oriented, the picture becomes much prettier. Do not forget that the reversal technique should be applied with caution.
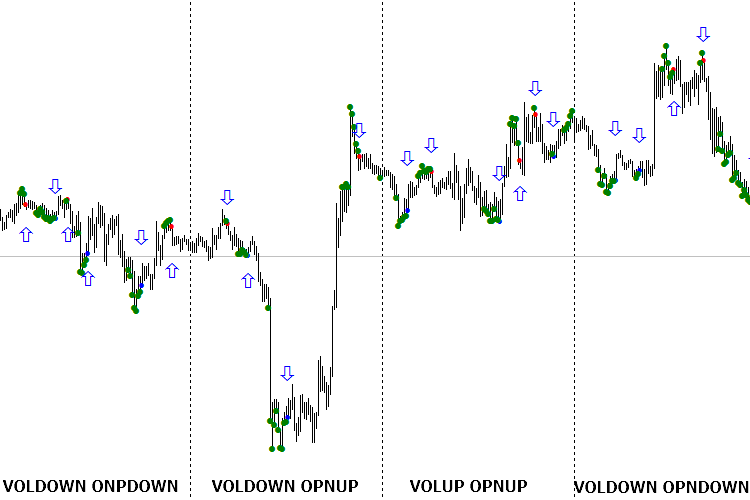
Fig. 4. Indicators in accordance with the name for each day, not oriented in the right direction
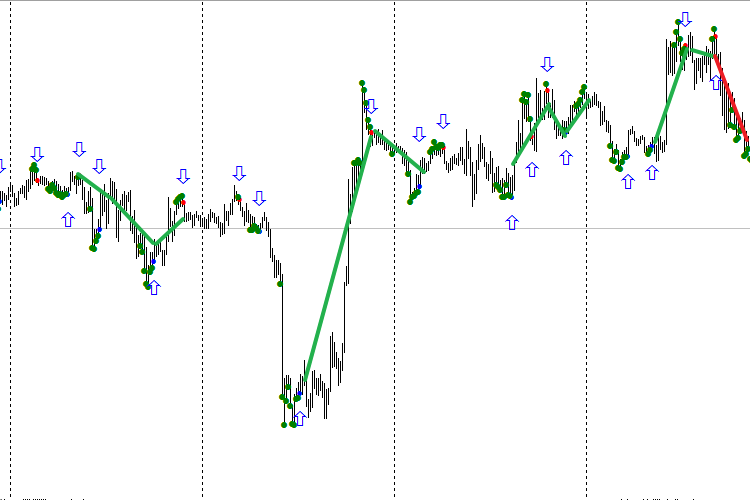
Fig. 5. Indicators for each day, oriented according to the first signal of the day (buy and sell separately)
In this form, the models no longer look like a failure, but rather quite capable. Since they have not depleted their confidence interval resource, they will probably be valid for a few more days.
The essence of classification is that a multidimensional data space is divided by a universal line, which classifies signals into "valid" and "false" groups. The "valid" signals are above zero, while the "false" ones are below. The main thing here is the stability in separation of some signals from others. A concept of TS orientation is introduced. It is important to determine when the network starts losing steadily, generating inverted signals. As a rule, in this case, the first signal of the day is the guiding one. This signal can be traded, but with extreme caution, based on other factors of analysis. My advice: to make sure the network is not misaligned, try to make the number of zeros and ones in the output variable equal. For equalization, freely remove the excessive zeros and ones from the training sample, starting from the furthest signals.
The exact process of division does not matter, as long as it is stable. Let us return to our example: in Figure 2, before the reorientation we received two errors in a row and took advantage of the situation. As you can see, when Sequential runs on M15, from 2 to 5 signals can be obtained during the day. And if two buy signals, for example, fall into different classes (one is valid, the other is false), then knowing the result of the first signal makes it easy to determine what the current signal will be — false or valid. However, the orientation method should be applied carefully. The network may produce an error and then continue to work correctly. In any case, everything comes with experience, both the mechanical reactions and intuition for patterns. The sustainability of the obtained model is planned for a more detailed consideration in subsequent articles, as this topic has many nuances.
Note: the attached files refer to the figures seen above. You can download them and test them on the specified date. The trading system is not sensitive to quotes, although there have been cases when Sequential did not generate a signal at another broker, because the quotes at the key moments were different. But such cases are rare, and the input data should be the same for everyone, since they are provided from the same source and are not subject to change. At the same time, there is no guarantee that you will be able to obtain the same results on the same time period when you run the downloaded files on your computer. But you should be able to use the models to separate the current and the previous signals.
In conclusion, let us consider one more question mentioned above. What to do, when the network generates a "not sure" signal and what does that mean? I repeat: history has no place for such a concept as "not sure". This merely indicates that the training sample did not contain a similar pattern, and the opinions of two networks in a committee on this issue were divided. "Not sure" implies that the obtained signal may be both valid or false. It is quite possible that using a larger segment of history would allow for the required pattern to be found, and the network would be able to identify it. But the training depth is small — about 30 signals, which corresponds to approximately 8-10 days. Naturally, we periodically come across signals and unfamiliar models, that were not present during the training. According to my observations, the longer a model works, the more often it gives the "not sure" response. This fits well with the theory of the "living market", where the past does not refer to the future. The recent patterns may be repeated imminently or only in the distant future. The essence of the market is such that the significance of a bar gradually decreases after it is closed as it moves deeper into the history. This is a general rule for any information: the older it is, the less its significance.
There are two ways to classify the "not sure" state. Take a look at the following figure. There are signals with missing arrows and the notorious "not sure" — the two networks in the committee interpreted them differently. These signals are denoted as 1 and 2 in the figure. And for the first signal to be profitable, it must be false.
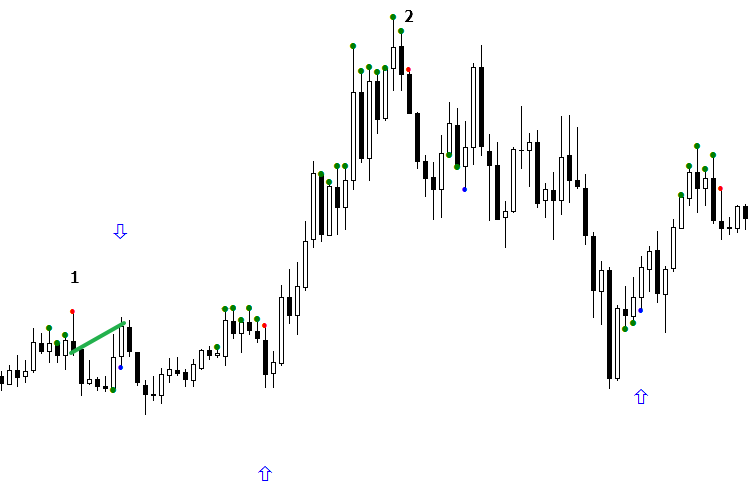
Fig. 6. Organization method of signal orientation according to the daily context
There are two ways to reclassify the "not sure" state. The first method is very simple (see Fig. 7). We have determined that the "not sure" state became false for the first sell. That is, the "not sure" sell signal is regarded as false. Signal #2 is also considered false, assuming to continue buying. In fact, the network made a mistake, but in practice this mistake can be nullified by entering the market at a better price. Therefore, the appearance of an upward arrow will not do much harm, although in fact, the signal turned out to be negative. The "not sure" buy signal (blue dot) is also regarded as false, because the last time the "not sure" occurred the buy signal was false. This method is very old, but experience shows that it works well.
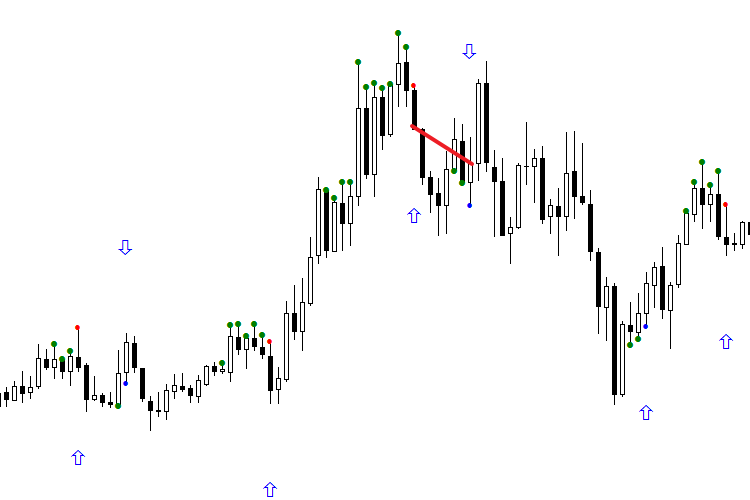
Fig. 7. Reclassification of the "Not sure" signal, when it is regarded as an alternative class
The second method of the "not sure" state classification calls for the internal organization of the optimizer and uses it as the basis. So, the "not sure" state appears when one network in the committee shows 1, while the other shows 0. The essence of the method is selecting the committee's networks which shows the correct answer. Let us return to our example. Signal #1 turned out to be false, when network A was above zero and network B was below. Therefore, if network B is above zero, and network A is less, then this "not sure" state is valid. As for the buy signals, everything is the opposite: the previous signal (not present in the figure) was false when the response of network A was negative and that of network B was positive. In the current buy signal, the situation is opposite, so we assume that this signal is valid, and taking a buy trade is recommended.
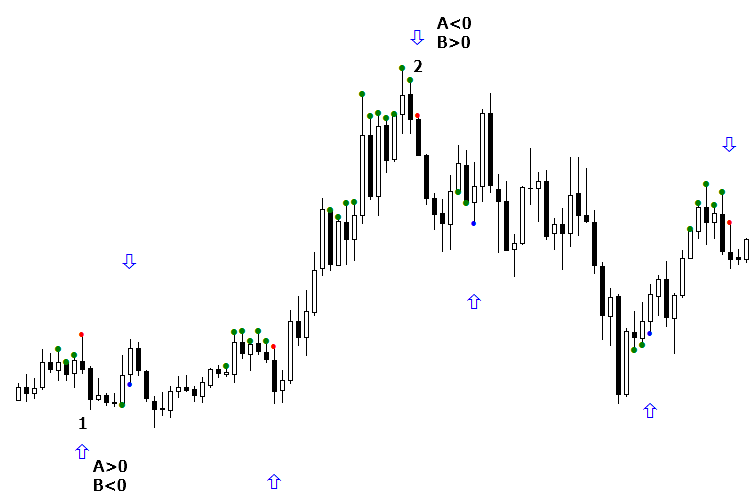
Fig. 8. Reclassification of the "Not sure" signal according to the values of each of the committee networks
I personally prefer the first classification method for the "not sure" state, and it has a rather logical explanation. When using a committee of two networks, we get three classes: "Yes", "No" and "Not sure". The data are distributed to these three groups. The important thing is not that we have three groups, but that they are fundamentally different. After obtaining the "not sure" signal and later finding out its direction, the subsequent signals in this group are believed to have the same direction. Current experience shows that this method is more reliable than the second.
Forecasting financial markets is difficult: they are a living and unpredictable organism, where real people work. During the day, the market situation may change so drastically no one would assume it would — neither market makers, nor major players, let alone us. The character of such changes consists of two components. The first is the market context, which have been discussed. The second reason is the activity of buyers and sellers in real time, here and now. Therefore, the main thing in trading is to orient in time and be on high alert!
Using an AI is not a panacea, nor the Holy Grail. Of course, when you trade with the use of neural networks, it is definitely worth listening to what artificial intelligence has to say. However, use your head when making trades. Once a signal from the AI is received, it is necessary to wait for its confirmation, select the correct level, evaluate the rollback probability, etc. This is what I wanted to discuss in the third article, which would be devoted to the practical peculiarities of trading based on the Sequential strategy with the use of neural networks.
7. Conclusion
Once again, I want to emphasize that this article is purely methodological in nature. All the described methods can be used in your trading systems, and hopefully the suggestions will find their use.
I am certain there will be both supporters and opponents of the described method. If you read up to these lines, then you have at least some interest. I would highly appreciate your opinion on what you disagree with, especially if you have a constructive solution, refinement or modification. In other words, criticize constructively! The sustainability of this approach can be proven by constructing an artificial intelligence system in conjunction with me. I would be glad to work on this project alongside a professional programmer, and I invite you to cooperate.
The code of TD Sequential is provided at the end of the article, as well as the indicators that filter or classify the buy and sell signals with consideration of the daily context and orientation at the beginning of trading. Please note that the indicators have been rewritten from MQL4 and do not provide the full functionality to completely reproduce everything that is shown in the article. The reason is that the input data for the NN require a set of indicators of the ClusterDelta project, which are available only for paid subscription.
I am willing to provide a prepared file for the indicators' operation to all interested. It would be intriguing to rewrite all the required indicators to MQL5 in order to completely reproduce the operation algorithm. My task here was to show how an open source code for creating and training neural networks can be used in the famous DeMark's strategy. I will be glad to see your comments and answer your questions.
Programs used in the article:
| # | Name |
Type |
Description |
|---|---|---|---|
| 1 | TDSEQUENTA_by_nikelodeon.mq5 | Indicator | The base strategy, which generates buy and sell signals in the form of blue and red dots, respectively. Green dots mean that the conditions to form a signal have been met and it is necessary to wait for the signal to appear. The strategy is convenient because it warns the trader about a signal beforehand using a green dot. |
| 2 | eVOLution-dvoid.1.3 (1).mq5 | Indicator | Loads a text file with the data on volume and open interest for the previous days, calculates the difference between the data, and stores all of that in the indicator buffer for subsequent access when saving data and when choosing the model for the current day. In other words, it organizes the market context. |
| 3 | dvoid-BP.csv | Text file |
Designed to store information on volume and open interest from the Chicago Stock Exchange website every morning at 7:30 Moscow time. The data is recorded manually every morning. The file is uploaded with the txt extension. After downloading it, the extension should be changed to csv and placed into the folder ..\Files\evolution-dvoid\. |
| 4 | BuyVOLDOWNOPNDOWN.mq5 | Indicator | Network for classifying buy signals on days when both the volume and open interest fell. |
| 5 | BuyVOLDOWNOPNUP.mq5 | Indicator | Network for classifying buy signals on days when the volume fell and open interest rose. |
| 6 | BuyVOLUPOPNDOWN.mq5 | Indicator | Network for classifying buy signals on days when the volume rose and open interest fell. |
| 7 | BuyVOLUPOPUP.mq5 | Indicator | Network for classifying buy signals on days when both the volume and open interest rose. |
| 8 | SellVOLDOWNOPNDOWN.mq5 | Indicator |
Network for classifying sell signals on days when both the volume and open interest fell. |
| 9 | SellVOLDOWNOPNUP.mq5 | Indicator | Network for classifying sell signals on days when the volume fell and open interest rose. |
| 10 | SellVOLUPOPNDOWN.mq5 | Indicator | Network for classifying sell signals on days when the volume rose and open interest fell. |
| 11 | SellVOLUPOPNUP.mq5 | Indicator |
Network for classifying sell signals on days when both the volume and open interest rose. |
Translated from Russian by MetaQuotes Ltd.
Original article: https://www.mql5.com/ru/articles/2773
Warning: All rights to these materials are reserved by MetaQuotes Ltd. Copying or reprinting of these materials in whole or in part is prohibited.
This article was written by a user of the site and reflects their personal views. MetaQuotes Ltd is not responsible for the accuracy of the information presented, nor for any consequences resulting from the use of the solutions, strategies or recommendations described.

 Cross-Platform Expert Advisor: Signals
 MQL5 Cookbook - Creating a ring buffer for fast calculation of indicators in a sliding window
- Free trading apps
- Over 8,000 signals for copying
- Economic news for exploring financial markets
You agree to website policy and terms of use
Thank you for your excellent suggestions.
I will immediately try out the various colours here.
If we get any opinions on how to use it, we will contact you again.
Thank you very much.
New Article Thomas DeMark Subsequent Order (TD SEQUENTIAL) Implemented Using Artificial Intelligence has been published:
By Mihail Marchukajtes
GREAT!!!
Why are there no comments on such a gem of a post