Developing Pivot Mean Oscillator: a novel Indicator for the Cumulative Moving Average
Contents
- Introduction: why another oscillator?
- Aspects of CMA
- PM & PMO Definitions
- Basic Design & Code
- Experiments on EURUSD
- Conclusion & Further Work
- Attachments
Introduction: why another oscillator?
Oscillators represent a subclass of indicators that fluctuate above and below a central line or within predefined set levels. They are widely used in technical analysis as generators of trading events, for example, when the central line is crossed or a certain threshold is surpassed. Popular oscillators are MACD, RSI, CCI each one with specific characteristics such as trying to anticipate reversals by looking at rate of change of price (also known as momentum) or searching for the main trend.
In general, oscillators whose formula computes price divergence between two instants show price-leading behavior (e.g. RSI, CCI) while oscillators that are based on averages show lagging behavior. To cite a relevant example, MACD can be considered as showing both lead and lag characteristics since it is computed over the difference between two averages. The plot of such difference is depicted as a histogram, making the central line crossovers and divergences easy to spot.
Nevertheless, there are pros and cons in using every oscillator since there can be market conditions that increase false signals (especially for leading oscillators) or rapid divergences that may skew the most of risk/reward ratio (as it often happens for lagging oscillators). As a rule of thumb, it can be wiser for a trader to look at multiple oscillators at once, just to have more possibly independent confirmations of a trading signal.
In this article, the Pivot Mean Oscillator is presented as an attempt to bring in the vast panorama of oscillators some new features directly derived from the use of the Cumulative Moving Average (CMA).
Aspects of CMA
In statistics, moving average (MA), also known as simple MA, is a calculation that averages the last n data of a timeseries. When a new value drops in, the oldest one is dropped out according to a first-in-first-out (FIFO) policy. MA levels are useful in financial settings since they can be interpreted as support in a falling market or resistance in a rising market.
MA conceptually works on a fixed-memory buffer, discarding data (and consequently pieces of information) older than the last available datum. If we ideally let such buffer extend to infinite so that all of the data up until the current datum point are considered in calculation, we have the CMA.
Fortunately enough, in practical application we do not need to allocate infinite memory for storing each single datum! In fact, CMA can be computed with few variables (depending on whether its recursive formulation is used, see next figure for details).

Table 1: Two formulations of CMA.
The second interesting aspect of CMA formula is the presence of a counter that increments by one unit at a time. This means that next CMA value will be composed, in part, by an element which is totally predictable and, complemented with other information, can be used for forecasting purposes. For example, in sideways market conditions price will tend to drift towards CMA value.
CMA is the base ingredient of PMO presented hereinafter.
PM & PMO Definitions
PMO is built on top of a normalization index that we call Pivot Mean (PM) which is computed as the fraction between the last datum and CMA.
PM provides a quick numerical understanding of the distance of price from the CMA. This means that PM can be considered as a measure of spread. For example, a PM value of 1.0035 simply means that the current value is 0.35% higher than CMA, while PM equal to 1 would mean that current value is perfectly coincident with CMA.
Since PM calculation can be repeated for each data point, this implies that every timeseries can be converted into a PM signal. Eventually, we define PMO as the difference between two MAs applied to PM signals. In short terms, PMO provides a measure of divergence between two spreads, hence it is useful to look at its applications to trading settings.
The two averages of PMO can be computed either on the same PM signal or on two different ones. In this article, we consider the simple MAs applied to PM signals obtained from close and open price data respectively.

Table 2: PM & PMO formulae.
While there are similarities, PMO formulation presented here is different from MACD for a couple of aspects. MACD is generally applied to price signals while underlying PMO signals are PM ones. Furthermore, while in MACD, Exponential MAs are considered, here we concentrate on simple MAs, leaving more sophisticated variants of PMO to future work on this subject.
Basic Design & Code
PMO requires few inputs derived directly from its formulation:
- Starting time: a reference datetime from which the indicator starts
- MA length for PM close signal: an integer representing the number of buffer data points to average on the PM signal derived from close prices
- MA length for PM open signal: an integer representing the number of buffer data points to average on the PM signal derived from open prices
//--- input parameters
input datetime startingTime;
input int      MA_close=3;
input int      MA_open=21;
In total, we will use three buffers:
- one for PMO (the displayed indicator buffer)
- two other ones for the underlying PM signals
//--- indicator buffers
double   PMOBuffer[];
double   closeBuffer[];
double   openBuffer[];
As for the global variables are concerned, it is necessary to have a counter and two variables for storing the sums of close and open prices that allow for PMO calculation. We add also a couple of other support variables to keep track of first index used in all buffers since the input starting time.
//----global vars---
int counter=1;
double sum_close=0;
double sum_open=0;
bool first_val_checked;
int first_valid_index;
To support the computation of the two averages of PMO, it is necessary to implement a function that implements MA. The only hinder that must be avoided is the case when computation is performed at the very beginning of the buffers in proximity of the starting time. In that case, there are no sufficient elements available for computation. However, due to PM definition, we can assume that values prior to starting times are set to one, thus allowing for MA calculus without any lag. Hence, the support function becomes as it follows:
double simpleMA(const int pos, const int avg_positions, const double &data[],int arr_tail_pos){
   double _local_sum = 0;
   for(int i=pos+avg_positions-1; i >= pos;i--){
      if(i > arr_tail_pos){
         _local_sum += 1;  // when requested data exceed buffer limit set trailing 1s
      }else{
         _local_sum += data[i];
      }

   }
   return _local_sum/avg_positions;
}
All that provided, we can finally have a look at the program core:
//+------------------------------------------------------------------+
//| Custom indicator iteration function                              |
//+------------------------------------------------------------------+
int OnCalculate(const int rates_total,
                const int prev_calculated,
                const datetime &time[],
                const double &open[],
                const double &high[],
                const double &low[],
                const double &close[],
                const long &tick_volume[],
                const long &volume[],
                const int &spread[])
  {
//---
   ArraySetAsSeries(PMOBuffer,true);
   ArraySetAsSeries(closeBuffer,true);
   ArraySetAsSeries(openBuffer,true);
   ArraySetAsSeries(open,true);
   ArraySetAsSeries(high,true);
   ArraySetAsSeries(time,true);


//--- return value of prev_calculated for next call
   int total = rates_total - prev_calculated;
   double _tmp_sum_close,_tmp_sum_open;
    if(total > 0){

      for(int i=total-1;i>=0;i--){
         if(time[i] >= startingTime){
            if(first_val_checked == false){
               first_val_checked = true;
               first_valid_index = i;
            }

            sum_close += close[i];
            sum_open += open[i];

            closeBuffer[i] = close[i] *counter / sum_close;
            openBuffer[i] = open[i]*counter / sum_open;

            PMOBuffer[i] = simpleMA(i,MA_close,closeBuffer,first_valid_index)-simpleMA(i,MA_open,openBuffer,first_valid_index);

            counter++;
         }
         else{
            PMOBuffer[i] = 0;
         }


      }

   }else{
      _tmp_sum_close = sum_close +close[0];
      _tmp_sum_open = sum_open + open[0];
      closeBuffer[0] = close[0] *counter / _tmp_sum_close;

      openBuffer[0] = open[0] *counter / _tmp_sum_open;

      PMOBuffer[0] = simpleMA(0,MA_close,closeBuffer,first_valid_index)-simpleMA(0,MA_open,openBuffer,first_valid_index);
   }
   return(rates_total);
  }
//+------------------------------------------------------------------+
Experiments on EURUSD
Here we provide some results and comments on experiments obtained from running PMO on the EURUSD chart. Two main topics will be discussed:
- Trading aspects related to the use of PMO
- Analysis of PMO value
Trading aspects
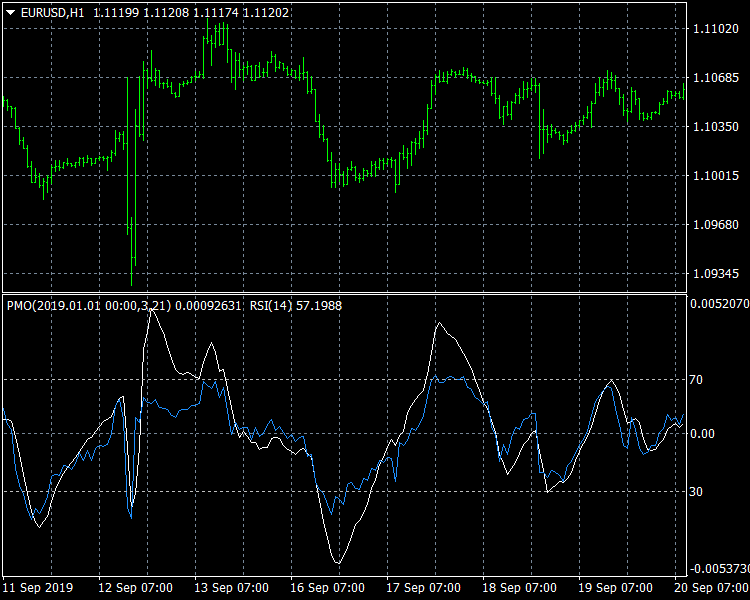
As the figure shows, there is a strong resemblance between PMO and RSI: the two signals almost coincides. However, there are also some differences. In proximity of the major upturns on Sept. 12th 2019 (in conjunction with some official communications of the European Central Bank) the attentive reader may observe an "M" Merril pattern on PMO with left shoulder higher than right one, just the opposite of what happens on RSI signal and on the underlying EURUSD price. This is due to the fact that the increase in price happened on Sept. 12th relatively to CMA was higher than the one observed the next day. This piece of information might have been useful for taking a short position after the second peak.
Resemblance with RSI allow us to consider reversals around peaks and troughs as overbought and oversold conditions, and hence as an early signal for one's trading strategy. Although PMO is not bounded as RSI, the straight crossing of the zero central line can be considered as a further confirmation of the trend. As said in the introduction, the combined use of multiple signals at once can be a good practice for trading success.

Fig. 1: Similarities between PMO(3,21) and RSI(14).
We can now sketch out a very basic and simplified set of IF THEN rules for trading with PMO leaving more sophisticated strategies to future development of PMO-based experts.
- IF positive reversal below zero line THEN early warning BUY
- IF negative reversal above zero line THEN early warning SELL
- IF upward crossing zero line THEN recommended BUY
- IF downward crossing zero line THEN recommended SELL
Quick response to market changing conditions is a key factor for success trading: when a MA is used, the smoother the signal the higher the delay. When using PMO( m,n), m accounts for the lag of the oscillator while n is related to the lag in crossing the central line. Of course, the quickest response with PMO is get with PMO(1,1) which means that we compute the difference between the two PMs with no average at all. A good compromise would be using PMO(1, n), with n small (e.g. 5) which guarantees the fastest response and not-too-lagged zero-crossings.
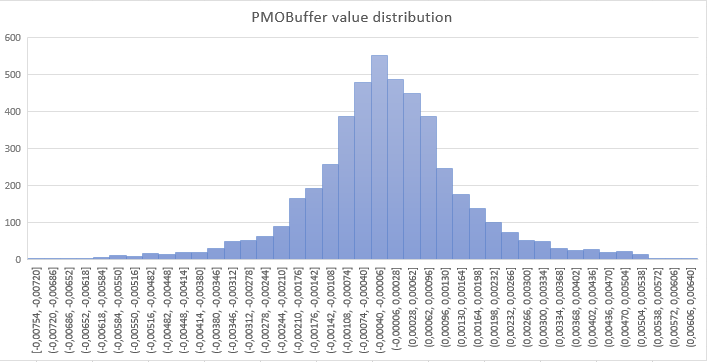
It is now useful to have a look at the distribution of PMO values around the zero centerline. PMO, as defined in this article, is not bounded like RSI, so it could be interesting to analyze the probability for a PM value to be above or below certain thresholds.
Figure below shows the results obtained from running PMO(3,21) on the EURUSD chart with H1 timeframe spanning through the first 8 months of 2019. PMO values are centered around zero in accordance with a bell-shaped distribution. The slight left skew is probably due to the excess of short conditions accumulated by EURUSD in last months. Nevertheless, the predominance of symmetries around zero let us infer that there is a general balance between short and long movements.

Fig. 2: Distribution of PMO(3,21) values resembling a bell-shaped curve. This let us suppose a quasi-gaussian statistical model which can be useful for prediction purposes.
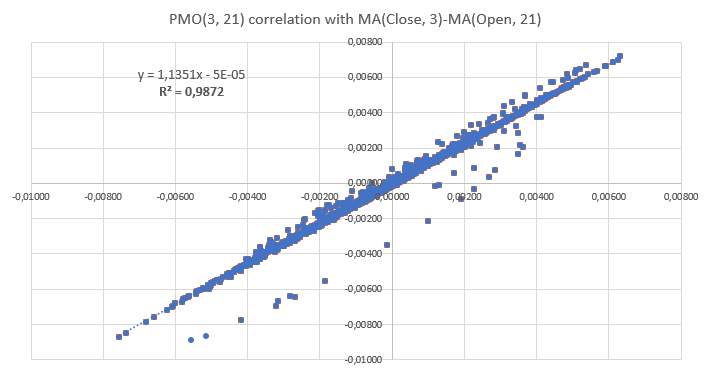
Another aspect to take into account is the relationship between PMO and the moving averages computed directly on the close and open price signals, rather than on their PM counterparts. As reported in the figure below, a strong correlation has been found with R square near to unity. This means that working on PM signals does not distort the underlying signals. At the same time, working on PM signals has the advantage of comparing results coming from different sources (e.g. other currency pairs) because of the normalization operated by PM computation.

Fig. 3: Correlation observed between PMO(3,21) and its not-normalized version. The almost linear shape obtained suggests that normalization employed in PMO does not provide major distortion in the interpretation of the underlying open and close price signals.
Conclusion & Further Work
In this article, I presented Pivot Mean Oscillator (PMO), an implementation of the cumulative moving average (CMA) as a trading indicator for the MetaTrader platforms based on the novel concept of Pivot Mean (PM). The proposed oscillator was shown to be similar to other well-known oscillators like RSI or MACD, but with some peculiarities derived from the use of CMA. Much work still to be done in terms of further development such as: variants based on other types of averages or, for example, experts that use information coming from PMO values statistical distribution around the zero centerline.
The reader is encouraged to perform its own experiments using the files attached.
Attached files
| File | Description |
|---|---|
| PMO.mq4 | MQL4 source code of PMO as used in this article. |
| PMO_logger.mq4 | MQL4 source code of PMO with log function feature for data analysis. Two additional inputs are implemented: data_logging (true/false flag) and filename (string). |
| PMO.mq5 | MQL5 source code of PMO. |
| PMO_logger.mq5 | MQL5 source code of PMO with log function feature for data analysis. Two additional inputs are implemented: data_logging (true/false flag) and filename (string). |
Warning: All rights to these materials are reserved by MetaQuotes Ltd. Copying or reprinting of these materials in whole or in part is prohibited.
This article was written by a user of the site and reflects their personal views. MetaQuotes Ltd is not responsible for the accuracy of the information presented, nor for any consequences resulting from the use of the solutions, strategies or recommendations described.
 MQL5 Cookbook: Trading strategy stress testing using custom symbols
 Parsing HTML with curl
 Developing a cross-platform grid EA (Last part): Diversification as a way to increase profitability
- Free trading apps
- Over 8,000 signals for copying
- Economic news for exploring financial markets
You agree to website policy and terms of use
MT5, MetaQuotes demo:
Nothing to do with what's in the article.
Hello. Does this indicator generate good buy and sell signals in isolation or do you need another indicator to confirm entries? Have you ever calculated its assertiveness rate in any market?
Hi romulocta. This indicator can also be used alone. I have no statistics regarding assertiveness rate. However, there is a free product that uses PMO at this link https://www.mql5.com/en/market/product/43378