
Studying candlestick analysis techniques (part I): Checking existing patterns

Table of contents
- Introduction
- Defining the problem
- Developing the interface prototype
- Implementing the tool
- Results of the study
- Findings
- Conclusions
Introduction
Candlestick analysis appeared more than 20 years ago and has since become quite popular. Many traders consider Japanese candlesticks the most convenient and easily understandable asset price visualization form. The similar bar format does not provide enough visual data. Japanese candlesticks are more convenient in terms of setup and display of candlestick body colors and thus provide a better visualization of market developments.
A plethora of various candlestick analysis methods imply various candlestick classifications or combinations of candlesticks (patterns) which may suggest possible market change. Some patterns indicate continuation of the current trend, others suggest trend reversal and sideways movements.
However, the age and popularity of candlestick analysis can be damaging for those who blindly follow it. Markets do not stand still. Not only the market dynamics has changed after 20 years, but also the factors influencing the market movement. Some market players started to use the popularity of the candlestick analysis and played against it.
That is what we are going to do in this article. Let us consider a few well-known methods for determining the market movement and check if they are still relevant and effective in today's realities.
Defining the problem
In order to evaluate the efficiency of a pattern, let us develop a universal algorithm for evaluating its performance. Figure 1 shows the general scheme of action. Let us take a closer look at it.
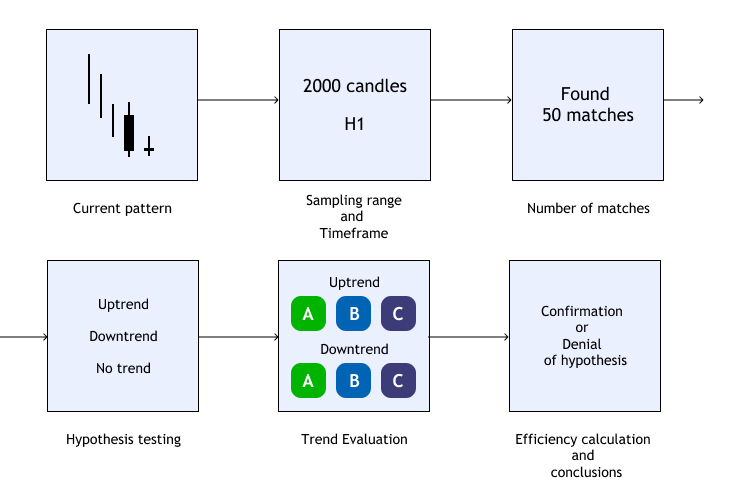
Fig.1 Pattern performance evaluation algorithm
Step 1. Select a popular candlestick pattern to compare its expected meaning and the real result. For clarity, the algorithm provides an example in the form of a candlestick pattern Harami Cross (bullish model), that is, an uptrend is expected.
Step 2. Define the history interval and timeframe. This will enable a deeper determining and confirmation of pattern efficiency. This may also help in finding a dependence on the analyzed history depth or determining a timeframe, in which pattern will be efficient or will not work at all.
Step 3. Count the number of pattern occurrences in the selected interval. This number will be used for the cumulative assessment, which will be discussed later.
Step 4. Analyzing each pattern match with an uptrend, downtrend or flat. Here, we need to define the accuracy of prediction, i.e. how many points the price moved in the expected direction. Suppose, trend is formed of a price movement of no less than 50 points in one direction or another. If the specified movement threshold is not reached, it is considered that the trend failed to form after the pattern.
Step 5. How to determine the quality of the trend movement? The price can pass the threshold value of 50 points after the patter formation, but how long does it take? This can be done in one candlestick of the analyzed timeframe or 10 candles. Therefore, the trend must be effective, because finding the pattern and then waiting for a profit after entering upon the pattern signal would be very risky and inefficient. For this purpose, the following trend efficiency categories were introduced.
- Category A. The desired trend threshold is achieved within one candlestick after the detected pattern.
- Category B. The desired trend threshold is achieved within two candlesticks after the detected pattern.
- Category C. The desired trend threshold is achieved within three candlesticks after the detected pattern.
Such a categorization of trend results will allow a more objective assessment of the efficiency of the current pattern.
Step 6. Calculate the following variables:
- How many times after the pattern detection the price moved up. This movements should be evaluated according to the above categories.
- How many times after the pattern detection the price moved down. This movements should be evaluated according to the above categories.
Figure 2 shows an example of finding, counting and categorizing uptrends and downtrends from the total sample of found candlestick patterns.
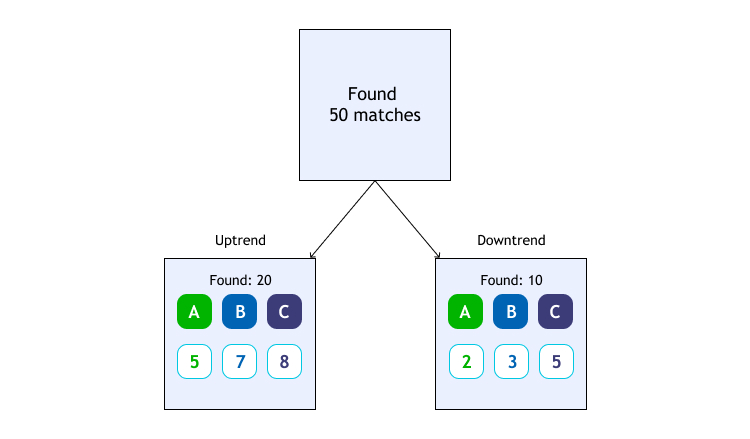
Fig.2 Algorithm and example of trend detection and categorization.
In this example, we analyzed the sample of 2000 candlesticks on the H1 timeframe (Fig.1) and fount 50 matches for our pattern. After that pattern, the price manage to move the threshold 50 points upwards 20 times and 10 times it moved downwards. Of all these 20 cases of upward movement, the price reached 50 points within one candlestick 5 times, 7 times it was done within 2 candlesticks and 8 times the threshold was reached within 3 candlesticks.
The same is performed for the downtrend. It can be seen form Figure 2 that the chance and speed of the uptrend is higher. However, it is not always possible to determine the state at a glance. Such a visual examination can be deceiving. Especially, you can get easily confused when analyzing a pattern on different samples and timeframes.
That is why I decided to introduce a cumulative coefficient for the general evaluation of any pattern efficiency in a given trend direction. It looks as follows:
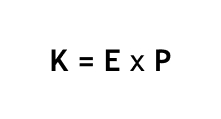
Here E is the trend efficiency, and P is the probability of a trend. Let us consider the trend efficiency formula:
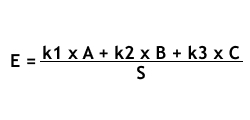
Here A, B and C show how many times the found trend was encountered in one of the categories. k1, k2, k3 are weight coefficients, because the significance of falling into these categories is different. The A category trend when the threshold value is achieved within one candlestick is more significant than when reached within 3 candlesticks. The default priorities are as follows: k1 = 1, k2 = 0.5, k3 = 0.25. This is a subjective perception, so you can set your own preferred values. S is the total number of the found trend of the given type.
The possibility of trend emergence P is the ratio of the number of found trends of a certain type (A, B or C) to the total number of found candlestick patterns from the given sample. This is actually the probability that the price will move in a certain direction based on the previous actions in history.
Let us calculate the efficiency for the uptrend and downtrend in our example from Figure 2.
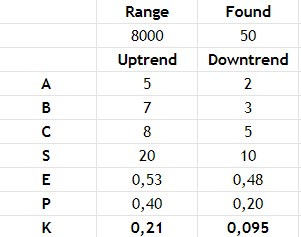
Fig.3 The effectiveness rate calculation results.
The following results were obtained from the calculations:
- The efficiency of trend E was higher for the uptrend, which was also visually observed. However now we have a quantitative assessment.
- The probability of trend emergence P in case of the formation of this pattern is 40% for an uptrend and 20% for a downtrend.
- Thus, the general efficiency of the pattern for the uptrend prediction is more than twice higher.
For further study of pattern relevance, we will pay attention to two main parameters: the probability that the price will move to the direction predicted by the candlestick pattern and the calculated efficiency evaluation coefficient.
This will enable three main conclusions for our research:
- Does the pattern work under today's market conditions?
- If it works, what are the chances of the prediction to be fulfilled upon the pattern emergence?
- How much and how fast can we earn in this case?
Developing a prototype interface for the candlestick pattern analysis
To study the existing patterns within the proposed model, it is necessary to design a convenient graphical shell based on the defined tasks. For that purpose, we will use the the existing library for the creation of graphical interfaces EasyAndFastGUI.
Before proceeding with the practical implementation, we need to define the external structure and create a prototype of the future graphical application. Then we will fill it with software implementation.
The general structure will consist of two tabs. The first tab will be used for analyzing existing patterns and the second one will contain required setup elements. Let us view the first tab in more detail.
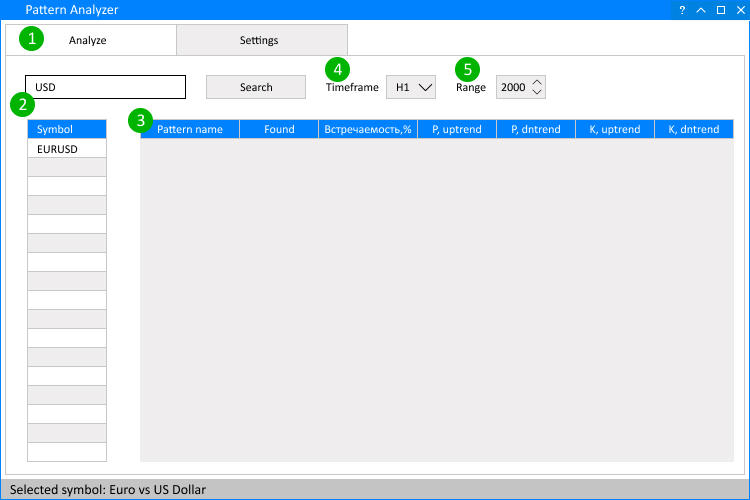
Fig.4 The structure of the Analysis tab.
It consists of five key interaction objects:
- Switching between two tabs, Analysis and Settings.
- Tool for searching for currency instruments required for analysis.
- Results table, which includes the Name of the pattern under analysis, the Number of matches found on the sampling range, How often the pattern occurs within the study, The uptrend and downtrend probabilities and the estimated efficiency evaluation coefficient for this pattern for the uptrend and the downtrend direction. This information will help us understand whether the pattern performance corresponds to the expected forecast characteristics an whether the results match the forecasts.
- The timeframe on which candlestick patterns will be explored.
- Sampling range. The number of candlesticks of the specified timeframe, within which the patterns will be tested.
Then consider the second tab Settings.
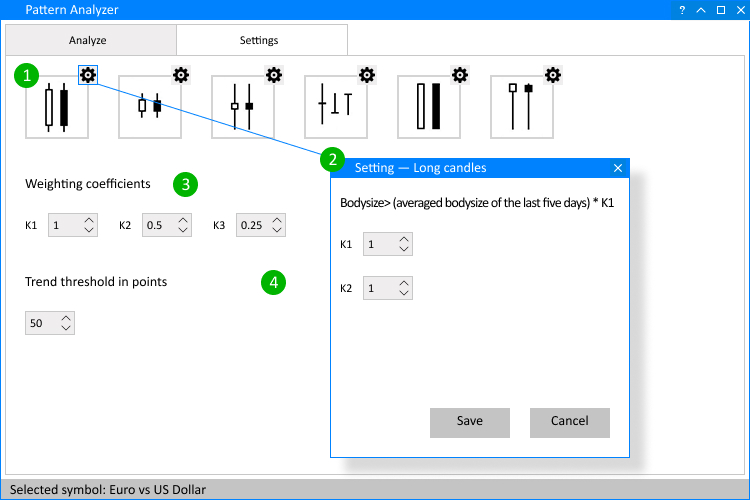
Fig.5 The structure of the Settings tab.
This section features settings of parameters which influence the pattern analysis results.
- The list of basic candlesticks which will be used in pattern formation.
- Dialog window. It opens at a click on the gear icon. This window features individual settings for the parameters of the basic candles which participate in pattern formation.
- Setting weight coefficients used in the calculation of efficiency rates of the pattern under analysis.
- Trend threshold value in points - if the price reaches this threshold, this will be a confirmation of the trend movement and the pattern will be considered successful.
Implementing the tool
After defining the theoretical basis and creating the prototype, we need to determine the order in which the application elements will be built. As can be seen in Figure 5, we have two separate windows. The first one has two tabs, Analysis and Settings, while the second one has additional individual settings for candlestick types. Therefore, the two main construction method look like this:
//+------------------------------------------------------------------+
//| Creates the graphical interface of the program                   |
//+------------------------------------------------------------------+
bool CProgram::CreateGUI(void)
  {
//--- Creating a panel
   if(!CreateWindow("Pattern Analyzer"))
      return(false);
//--- Creating a dialog window
   if(!CreateWindowSetting("Settings"))
      return(false);
//--- Finishing the creation of GUI
   CWndEvents::CompletedGUI();
   return(true);
  }
//+-----------------------------------------------------------------
Now, let us take a closer look at what each of these methods includes. We will not go into the smallest detail regarding each of the method, but we will dwell on the key features, which are directly related to candlestick analysis methods. So, each method for the creation of the main application window CreateWindow() consists of the following methods, which implement interface elements:
- CreateTabs() — implements the Analysis and Settings tabs.
- CreateSymbolsFilter() — an input field and a checkbox to search for the desired symbol.
- CreateRequest() — the button, by a click on which search is initiated.
- CreateRange() — input field for specifying the sample range.
- CreateComboBoxTF() — a drop-down list for selecting a timeframe on which the analysis will be performed.
- CreateSymbTable() — creates a table with the symbol search results.
- CreateTable() — a table with the candlestick pattern analyzing results.
- CreateStatusBar() — a status bar which shows the symbol currently selected for analysis; alternatively it informs that the symbol is not selected.
This list of methods implements graphical elements in the Analysis tab. Below are the Settings tab methods.
- CreateCandle() — the method for creating a composite element, which consists of the candlestick type image and a gear button (position 1 in Figure 4).
- CreateTextLabel() — the method for visualizing text headers before group coefficients (position 3 in Figure 4).
- CreateCoef() — the method displays an entry field for the weight coefficient.
- CreateThresholdValue() — the method is used for displaying the input field for the profit threshold value in points.
Now, let us consider the structure of the second window with additional settings implemented using the CreateWindowSetting() method.
- CreateSettingTextLabel() — the method creates a dynamic text label-hint, which helps understand which parameter for a specific selected candlestick you are changing.
- CreateSettingCoef() — the method creates an input field for editing the properties of the selected candlestick.
- CreateSaveButton() — the method creates a button for saving and applying edited properties.
- CreateCancelButton() — the method creates a button for canceling all actions concerning parameters of the selected candlestick.
We have created an interface for interaction. Now let us proceed with the implementation of calculation and evaluation methods, which were described in the very beginning of the section related to task definition. Let us define the development stages and input conditions, which will be applied for the analysis of candlestick patterns.
Fig.6 Graphical interface creation result.
As you know, there are patterns consisting of one candlestick of a certain type, of two, three, and more candlesticks. Let us enumerate the basic candlestick types, which will be used in our candlestick patterns:
- Long candlestick. Candlestick body > (average body over the last 5 days)*K1, where K1 is the adjustable coefficient (Fig.4).
- Short candlestick. Candlestick body < (average body over the last 5 days)*K1.
- Spinning Tops. Lower shadow > body*K1 and Upper shadow > body*K1.
- Doji. Doji body< (range from the Price High to Low )*K1.
- Marubozu. Lower shadow < body*K1 or Upper shadow < body*K1.
- Hammer. Lower shadow > body*K1 and Upper shadow < body*K2.
Now, let us consider the well-known candlestick patterns to be applied on our analysis method. We will work with two pattern categories: Those consisting of one candlestick and of two candlesticks.
One-candlestick patterns:
- Hammer (bullish pattern).
- Hanging Man (bearish pattern).
- Inverted hammer (bullish pattern).
Two-candlestick patterns:
- Shooting Star (bearish pattern).
- Engulfing (bullish pattern).
- Engulfing (bearish pattern).
- Harami Cross (bullish pattern).
- Harami Cross (bearish pattern).
- Harami (bullish pattern).
- Harami (bearish pattern).
- Doji Star (bullish pattern).
- Doji Star (bearish pattern).
- Piercing (bullish pattern).
- Dark Cloud Cover (bearish pattern).
These types of candlesticks and ways to identify them were described in detail in the article Investigation of Candlestick Patterns (Models). These methods have been adjusted for the candlestick analysis algorithm.
The algorithm itself looks as follows:
1. The CandleType() determines the basic candlestick type.
//--- Determine the candlestick type
   res.type=CAND_NONE;
//--- long
   if(res.bodysize>sum*m_long_coef)
      res.type=CAND_LONG;
//--- short
   if(res.bodysize<sum*m_short_coef)
      res.type=CAND_SHORT;
//--- doji
   if(res.bodysize<HL*m_doji_coef)
      res.type=CAND_DOJI;
//--- marubozu
   if((shade_low<res.bodysize*m_maribozu_coef || shade_high<res.bodysize*m_maribozu_coef) && res.bodysize>0)
      res.type=CAND_MARIBOZU;
//--- hammer
   if(shade_low>res.bodysize*m_hummer_coef2 && shade_high<res.bodysize*m_hummer_coef1)
      res.type=CAND_HAMMER;
//--- invert hammer
   if(shade_low<res.bodysize*m_hummer_coef1 && shade_high>res.bodysize*m_hummer_coef2)
      res.type=CAND_INVERT_HAMMER;
//--- spinning top
   if(res.type==CAND_SHORT && shade_low>res.bodysize*m_spin_coef && shade_high>res.bodysize*m_spin_coef)
      res.type=CAND_SPIN_TOP;
2. The PatternType() method determines the pattern type based on the data provided by CandleType() for the analyzed candlestick or two candlesticks which form one of the above mentioned patterns.
for(int i=m_range_total;i>3;i--)
     {
      CandleType(symbol,cand2,i);                                                      // Previous candlestick
      CandleType(symbol,cand1,i-1);                                                    // Current candlestick

      //--- Inverted Hammer, bullish model
      if(cand2.trend==DOWN &&                                                             // Checking the trend direction
         cand2.type==CAND_INVERT_HAMMER)                                                  // Checking the "Inverted Hammer"
        {
         m_invert_hummer_total++;
         GetCategory(symbol,i-3,invert_hummer_coef);
        }

      //--- Hanging man, bearish
      if(cand2.trend==UPPER &&                                                            // Checking the trend direction
         cand2.type==CAND_HAMMER)                                                         // Checking the "Hammer"
        {
         m_handing_man_total++;
         GetCategory(symbol,i-3,handing_man_coef);
        }
      //--- Hammer, bullish model
      if(cand2.trend==DOWN &&                                                             // Checking the trend direction
         cand2.type==CAND_HAMMER)                                                         // Checking the "Hammer"
        {
         m_hummer_total++;
         GetCategory(symbol,i-3,hummer_coef);
        }
      //---
      //--- Shooting Star, bearish model
      if(cand1.trend==UPPER && cand2.trend==UPPER &&                                      // Checking the trend direction
         cand2.type==CAND_INVERT_HAMMER && cand1.close<=cand2.open)                       // Checking the "Inverted Hammer"
        {
         m_shooting_star_total++;
         GetCategory(symbol,i-4,shooting_star_coef);
        }

      //--- Engulfing, bullish model
      if(cand1.trend==DOWN && cand1.bull && cand2.trend==DOWN && !cand2.bull && // Checking trend direction and candlestick direction
         cand1.bodysize>cand2.bodysize &&
         cand1.close>=cand2.open && cand1.open<cand2.close)
        {
         m_engulfing_bull_total++;
         GetCategory(symbol,i-4,engulfing_bull_coef);
        }

      //--- Engulfing, bearish model
      if(cand1.trend==UPPER && cand1.bull && cand2.trend==UPPER && !cand2.bull && // Checking trend direction and candlestick direction
         cand1.bodysize<cand2.bodysize &&
         cand1.close<=cand2.open && cand1.open>cand2.close)
        {
         m_engulfing_bear_total++;
         GetCategory(symbol,i-4,engulfing_bear_coef);
        }

      //--- Harami Cross, bullish
      if(cand2.trend==DOWN && !cand2.bull &&                                              // Checking trend direction and candlestick direction
         (cand2.type==CAND_LONG || cand2.type==CAND_MARIBOZU) && cand1.type==CAND_DOJI && // Checking the "long" first candlestick and the doji candlestick
         cand1.close<cand2.open && cand1.open>=cand2.close)                               // Doji is inside the first candlestick body
        {
         m_harami_cross_bull_total++;
         GetCategory(symbol,i-4,harami_cross_bull_coef);
        }

      //--- Harami Cross, bearish model
      if(cand2.trend==UPPER && cand2.bull &&                                              // Checking trend direction and candlestick direction
         (cand2.type==CAND_LONG || cand2.type==CAND_MARIBOZU) && cand1.type==CAND_DOJI && // Checking the "long" candlestick and doji
         cand1.close>cand2.open && cand1.open<=cand2.close)                               // Doji is inside the first candlestick body
        {
         m_harami_cross_bear_total++;
         GetCategory(symbol,i-4,harami_cross_bear_coef);
        }

      //--- Harami, bullish
      if(cand1.trend==DOWN && cand1.bull && !cand2.bull &&                                // Checking trend direction and candlestick direction
         (cand2.type==CAND_LONG || cand2.type==CAND_MARIBOZU)  &&                         // Checking the "long" first candlestick
         cand1.type!=CAND_DOJI && cand1.bodysize<cand2.bodysize &&                        // The second candle is not Doji and first candlestick body is larger than that of the second one
         cand1.close<cand2.open && cand1.open>=cand2.close)                               // Second candlestick body is inside the first candlestick body
        {
         m_harami_bull_total++;
         GetCategory(symbol,i-4,harami_bull_coef);
        }

      //--- Harami, bearish
      if(cand1.trend==UPPER && !cand1.bull && cand2.bull &&                               // Checking trend direction and candlestick direction
         (cand2.type==CAND_LONG || cand2.type==CAND_MARIBOZU) &&                          // Checking the "long" first candlestick
         cand1.type!=CAND_DOJI && cand1.bodysize<cand2.bodysize &&                        // The second candle is not Doji and first candlestick body is larger than that of the second one
         cand1.close>cand2.open && cand1.open<=cand2.close)                               // The second candlestick body is inside the first candlestick body
        {
         m_harami_bear_total++;
         GetCategory(symbol,i-4,harami_bear_coef);
        }

      //--- Doji Star, bullish
      if(cand1.trend==DOWN && !cand2.bull && // Checking trend direction and candlestick direction
         (cand2.type==CAND_LONG || cand2.type==CAND_MARIBOZU) && cand1.type==CAND_DOJI && // Checking the 1st "long" candlestick and the 2nd doji
         cand1.close<=cand2.open)                                                         // Doji Open is lower or equal to 1st candle Close
        {
         m_doji_star_bull_total++;
         GetCategory(symbol,i-4,doji_star_bull_coef);
        }

      //--- Doji Star, bearish
      if(cand1.trend==UPPER && cand2.bull && // Checking trend direction and candlestick direction
         (cand2.type==CAND_LONG || cand2.type==CAND_MARIBOZU) && cand1.type==CAND_DOJI && // Checking the 1st "long" candlestick and the 2nd doji
         cand1.open>=cand2.close)                                                         //Doji Open price is higher or equal to 1st candle Close
        {
         m_doji_star_bear_total++;
         GetCategory(symbol,i-4,doji_star_bear_coef);
        }

      //--- Piercing, bullish model
      if(cand1.trend==DOWN && cand1.bull && !cand2.bull && // Checking trend direction and candlestick direction
         (cand1.type==CAND_LONG || cand1.type==CAND_MARIBOZU) && (cand2.type==CAND_LONG || cand2.type==CAND_MARIBOZU) && // Checking the "long" candlestick
         cand1.close>(cand2.close+cand2.open)/2 && // 2nd candle Close is above the middle of the 1st candlestick
         cand2.open>cand1.close && cand2.close>=cand1.open)
        {
         m_piercing_line_total++;
         GetCategory(symbol,i-4,piercing_line_coef);
        }

      //--- Dark Cloud Cover, bearish
      if(cand1.trend==UPPER && !cand1.bull && cand2.bull && // Checking trend direction and candlestick direction
         (cand1.type==CAND_LONG || cand1.type==CAND_MARIBOZU) && (cand2.type==CAND_LONG || cand2.type==CAND_MARIBOZU) && // Checking the "long" candlestick
         cand1.close<(cand2.close+cand2.open)/2 && // Close 2 is below the middle of the 1st candlestick body
         cand1.close<cand2.open && cand2.close<=cand1.open)
        {
         m_dark_cloud_cover_total++;
         GetCategory(symbol,i-4,dark_cloud_cover_coef);
        }
     }
3. As can be seen from the above code, when determining one of the specified patterns, the history is checked using the GetCategory() method. Namely, the direction of the price after the signal emergence is checked. That is, price movement categories are determined for each of the found patter, as is described in Figure 1.
//+------------------------------------------------------------------+
//| Determine profit categories                                      |
//+------------------------------------------------------------------+
bool CProgram::GetCategory(const string symbol,const int shift,int &category[])
  {
   MqlRates rt[];
   int copied=CopyRates(symbol,m_timeframe,shift,4,rt);
   int rating=0;
//--- Get details of the previous candlestick
   if(copied<4)
      return(false);
   double high1,high2,high3,low1,low2,low3,close0,point;
   close0=rt[0].close;
   high1=rt[1].high;
   high2=rt[2].high;
   high3=rt[3].high;
   low1=rt[1].low;
   low2=rt[2].low;
   low3=rt[3].low;
   if(!SymbolInfoDouble(symbol,SYMBOL_POINT,point))
      return(false);

//--- Check if it is the Uptrend
   if((int)((high1-close0)/point)>=m_threshold_value)
     {
      category[0]++;
     }
   else if((int)((high2-close0)/point)>=m_threshold_value)
     {
      category[1]++;
     }
   else if((int)((high3-close0)/point)>=m_threshold_value)
     {
      category[2]++;
     }

//--- Check if it is the Downtrend

   if((int)((close0-low1)/point)>=m_threshold_value)
     {
      category[3]++;
     }
   else if((int)((close0-low2)/point)>=m_threshold_value)
     {
      category[4]++;
     }
   else if((int)((close0-low3)/point)>=m_threshold_value)
     {
      category[5]++;
     }
   return(true);
  }
4. After determining the category and calculating "how many times and in what direction the price moved after the pattern detection", other parameters are calculated, such as Occurrence, The uptrend and downtrend probability, as well as the efficiency evaluation coefficient for this pattern for the uptrend and the downtrend direction. This calculation is performed by the CoefCalculation() method.
//+------------------------------------------------------------------+
//| Calculating efficiency assessment coefficients                   |
//+------------------------------------------------------------------+
bool CProgram::CoefCalculation(const int row,int &category[],int found)
  {
   double p1,p2,k1,k2;
   int sum1=0,sum2=0;
   for(int i=0;i<3;i++)
     {
      sum1+=category[i];
      sum2+=category[i+3];
     }
//---
   p1=(found>0)?NormalizeDouble((double)sum1/found*100,2):0;
   p2=(found>0)?NormalizeDouble((double)sum2/found*100,2):0;
   k1=(found>0)?NormalizeDouble((m_k1*category[0]+m_k2*category[1]+m_k3*category[2])/found,3):0;
   k2=(found>0)?NormalizeDouble((m_k1*category[3]+m_k2*category[4]+m_k3*category[5])/found,3):0;

   m_table.SetValue(3,row,(string)p1,2);
   m_table.SetValue(4,row,(string)p2,2);
   m_table.SetValue(5,row,(string)k1,2);
   m_table.SetValue(6,row,(string)k2,2);
//--- Update the table
   m_table.Update(true);
   m_table.GetScrollVPointer().Update(true);
   m_table.GetScrollHPointer().Update(true);
   return(true);
  }
Based on these calculation, we can assess whether the pattern corresponds to the expected movement characteristics.
Results of the study
To analyze the candlestick patterns, let us use a set of symbols from the forex.major category in the MetaTrader 5 terminal. In order not to enter them one by one, a special word was added to provide the entire list. When you type the word Major, the desired list as shown in Fig.7 will be displayed.
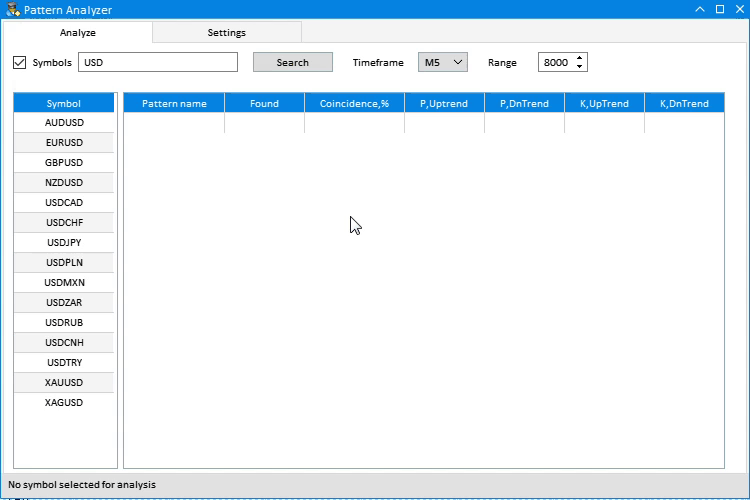
Fig.7 Quick selection of major symbols.
We will not perform any additional settings for the candlestick patterns. The only editable parameter is the Trend threshold value in points. Profit targets on different timeframes should be adjusted, since too large targets on small timeframes will lead to zero results, and too small targets on higher timeframes will lead to the opposite result.
To test the above assumption, let us select two timeframes and change the Threshold value. This will allow us to see the effect of the parameter. I decided to consider a small testing sample, because if we consider each currency pair on the proposed 21 timeframes and change parameters there will be a lot of confusing information. You can select the desired pair, timeframe and history range to test various threshold values yourself.
Here is the first set of non-default parameters:
- Set Major.
- Timeframe M15.
- Threshold profit value is 100 points (for 5-digit quotes).
Testing results of all the seven pairs are presented in Figure 8.
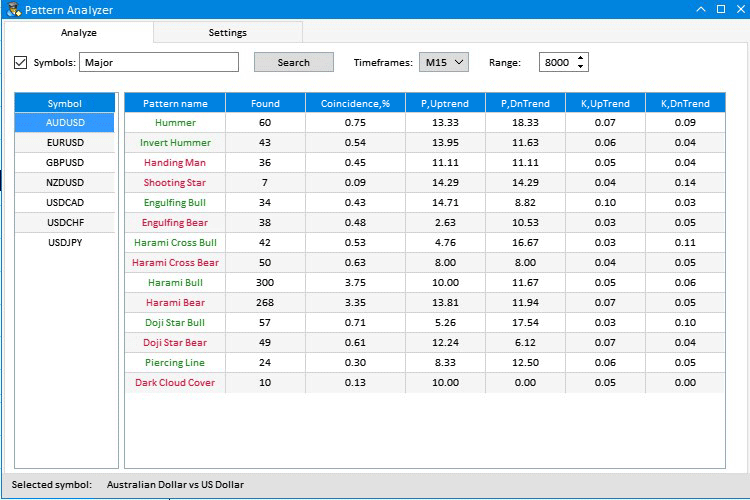
Fig.8 Timeframe M15 analysis results.
Let us take a closer look at EURUSD and use its example to check whether the candlestick patterns are relevant in the given conditions. Patterns in the above image are highlighted in a specific color, which indicates the character of their movement. Red color is used for the patterns which indicate possible downtrend, while green is used for those showing uptrend. Let us see if the colors comply with the result.
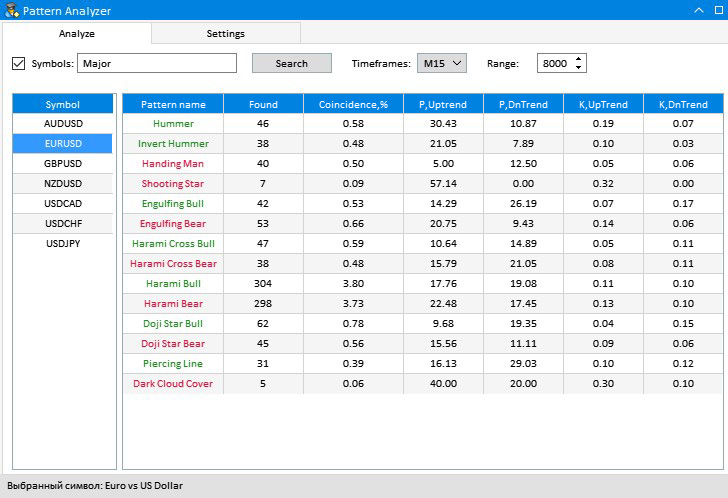
Fig.9 EURUSD analysis results.
The first pattern under analysis is Hammer. According to the pattern characteristics, it predicts an upward movement. During our tests, an upward movement was observed in 30% of cases and downward movement occurred in 10% of cases. Note that this is the movement of no less than the specified threshold value of 100 points. Considering that on a historical sample, the pattern was followed by an upward movement in more than a third of the cases, we can assume that it confirms the hypothesis that this candlestick pattern signals an uptrend.
However, this observation cannot be automatically applied to all other timeframes and samples. This refers to this specific case and result.
Now let us consider the Engulfing Bearish pattern. The pattern is considered to indicate a downtrend, so after it you should perform a short deal. However, the result shows that the behavior of this candlestick pattern is completely different in most cases: in 20% of cases, after the appearance of the pattern, the price went upwards by at least 100 points, while the share of downward movements was only 9% of all cases, which is more than two times less. Thus, testing showed that the pattern behaves the opposite way.
The third pattern to analyze is bullish Harami. As the name and the green tag imply, this patterns is a buy signal. However, the number of downward and upward cases is almost equal: 17% and 19%. Can we say that this pattern shows a certain signal? I doubt, since there is no clear prevalence of any of the sides. Thus, the testing result suggest that you should better refrain from using this pattern for trading EURUSD on the 15-minute timeframe.
Findings
Based on the results obtained, the following observations can be made: it is hard to clearly interpret candlestick patterns. Results greatly depend on conditions in which they appear. Thus, a pattern does not behave the same not only throughout the entire market, but even on the same currency pair with different timeframes. You should always re-check pattern signals.
Conclusions
The attached archive contains all the listed files, which are located in the appropriate folders. For their proper operation, you only need to save the MQL5 folder into the terminal folder.
Programs used in the article
| # |
Name |
Type |
Explanation |
|---|---|---|---|
| 1 |
PatternAnalyzer.mq5 | Graphical interface |
Toolbar for analyzing candlestick patterns |
| 2 | MainWindow.mqh | Code Base | GUI library |
| 3 | Program.mqh | Code Base | Library of methods for creating interface and calculation elements |
Translated from Russian by MetaQuotes Ltd.
Original article: https://www.mql5.com/ru/articles/5576
Warning: All rights to these materials are reserved by MetaQuotes Ltd. Copying or reprinting of these materials in whole or in part is prohibited.
This article was written by a user of the site and reflects their personal views. MetaQuotes Ltd is not responsible for the accuracy of the information presented, nor for any consequences resulting from the use of the solutions, strategies or recommendations described.

 Practical application of correlations in trading
- Free trading apps
- Over 8,000 signals for copying
- Economic news for exploring financial markets
You agree to website policy and terms of use
Finished it. I'm so outraged! Are you serious? You've even posted a paid product based on "this"!? What is the world coming to... Maybe everything else here is not much better, of course, but I expected much more (at least to take into account the basics of the matrix), especially it is clear that you have the opportunity, and it's not too late to take and redo all the smart.
the author wrote an article. He researched candlestick patterns as best as he could and publicly.
In fact, the article shows an attempt to do some statistical research with MQL tools:-) But not the evaluation of the candlesticks themselves, their frequency and legitimacy models.
And the author is good - he did not overdo it with quotes of his own code, everything is in general on the point.
the author wrote an article. As best he could, and publicly researched candlestick patterns.
In fact, the article shows an attempt to do some statistical research with MQL tools:-) But not at all the evaluation of the candlesticks themselves, their frequency models and legitimacy.
And the author is good - he did not overdo it with quotes of his own code, everything is in general on the point.
Well, you understand what is there and what is an attempt, but the article is also read by beginners, and the article is called
"Research of candlestick analysis methods (Part I): Testing Existing Patterns"But in fact it is not such an article, the existing patterns are not checked, and it is not clear what is investigated there,
but it is clear that the author was too lazy to read the fundamental materials on the topic of candlestick analysis,
It seems that the author was too eager to quickly write articles for the rating and put something on the market.
If the author reads it, no offence, maybe he will think that if you do it, you should do it normally, and not be spat on.
At the same time, the labour has been done, I hope it's not a monkey's work) and there is a reasonable link in the code, but since I see such obvious serious bloopers,
I don't need this code, I don't know what else the author screwed up, it's more reliable and correct to write it myself. And newcomers who think that on such a serious site only serious material,
they'll think they're doing candlestick analysis.
but how do I use it?
How do I launch it in mt5?
but how is it used?
How do I launch it in mt5?
You can't use it in the strategy tester (at least I couldn't).
But it's not necessary, you can do it in the window of any instrument, just drag the AE from the browser window to the instrument window.
Previously you must compile it in the metaeditor.