
Learn how to design a trading system by MACD
Introduction
In this article, we will study one of the most popular and commonly used trading tools. We will talk about the Moving Average Convergence Divergence (MACD) indicator. We will study it in detail and and see how we can benefit from using it in trading. In previous articles, we already mentioned that it is very important to identify the trend or the direction of the market in order to take appropriate trading decision as per this direction and to be at the right place.
So, the first step is to determine the direction of the market. There are two different types of movement according to the direction:
- Directional movement.
- Non-directional movement.
Directional movement: it means that we can clearly find a direction in which the prices move, either to up or down. So, according to this type of movements, we two different types of trend can be identified: they are Uptrend and Downtrend.
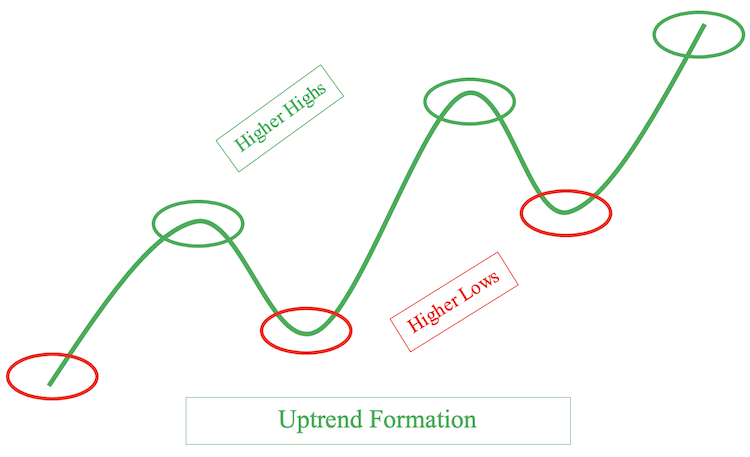
- Uptrend: means that the direction of the price is up or the price moves upwards which means that the price is growing. Usually this means that there is a control from buyers or bulls, and this market state is often referred to as a bullish market. This movement is shown in the next figure, in which prices create higher lows and higher highs.
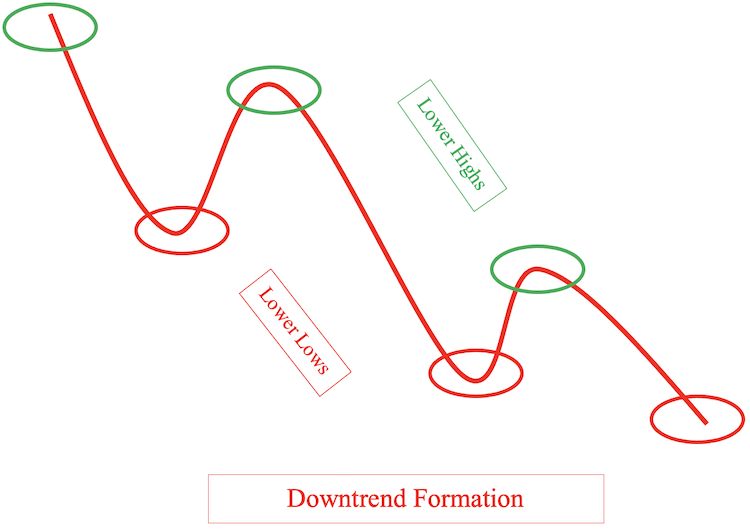
- Downtrend: means that the direction of the price is down or the price moves downwards. i.e. the price is declining. It can be said that there is a control from sellers or bears, so this market state is often referred to as a bearish market. This state is shown in the figure below, in which prices create lower highs and lower lows.
Non-directional movement: it means that we cannot find a clear price movement direction, i.e. determine whether prices move up or down. This type of movement can be called sideways. So, generally speaking, any movement except uptrend or downtrend can be referred to sideways. There are many formations that can be described as a sideways formation.
Now that we have identified the price action and found out how to determine its direction, there is another thing I need to mentioned. It is something more advanced about the price action as there is another dimension: we have to identify the momentum to refer to the velocity of price movement. There are many tools which can help us to determine the momentum and to determine if the direction is strong or not.
One of such tools is the Moving Average Convergence Divergence (MACD) indicator which is one of the most popular and commonly used indicators among technical traders. In this article, we will study this indicator in more details and will learn to design a trading system based on it. For this, we will go through the following topics:
We will learn about the MACD indicator in more details: what it measures and how it is calculated, and will see an example - this is in the 'MACD definition' part. Then we will learn simple strategies which can be used with MACD and they can be useful to our trading - the 'MACD strategy' part. After that, in the 'MACD blueprint' part, we will learn how to design a blueprint which can be helpful when designing a trading system for the mentioned MACD strategies. Then, we will learn how to design this trading system for these mentioned strategies.Again, we will use the MetaTrader 5 trading platform and the MetaQuotes Language Editor which is integrated into MetaTrader 5 to design this trading system. If you do not have it, you can download it at the following link: https://www.metatrader5.com/en/download
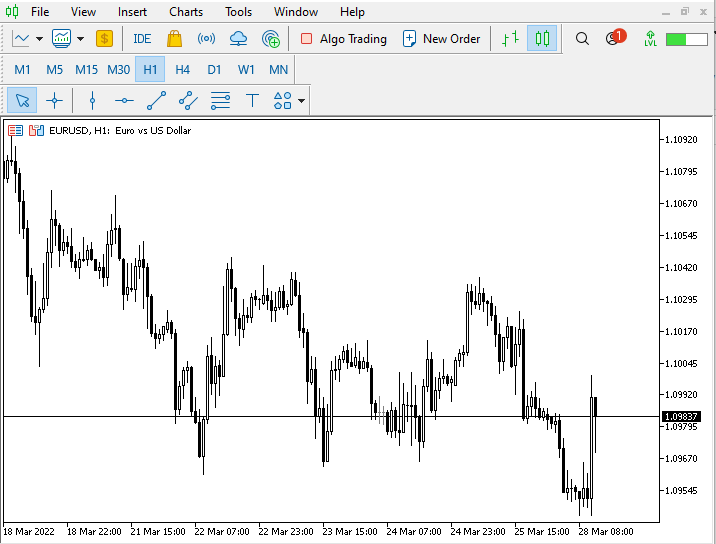
After downloading and installing it, you will see the following MetaTrader 5 window:
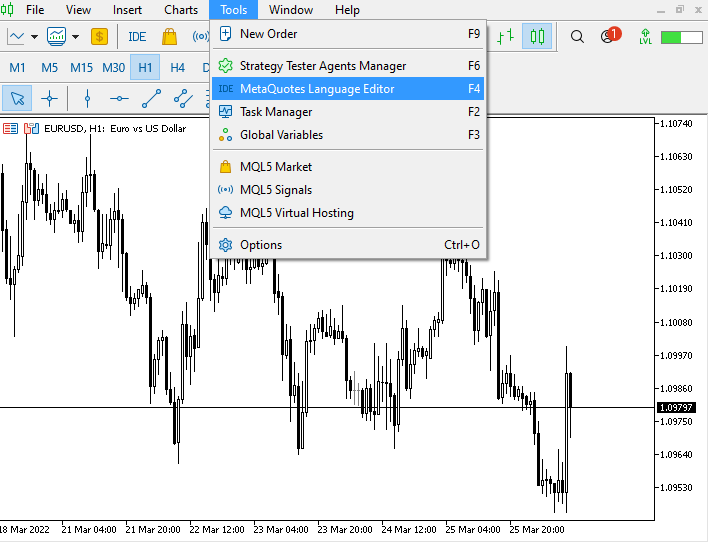
After that, you can open MetaQuotes Language Editor by pressing F4 in the open MetaTrader 5 or using the Tools menu -> MetaQuotes Language Editor as is shown in the following window:
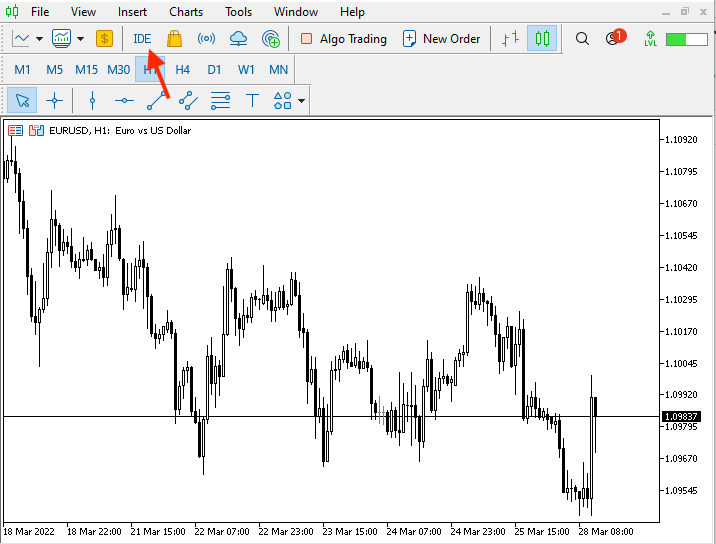
Or press on the IDE button:
Then the following window will be opened for MetaQuotes Language Editor:
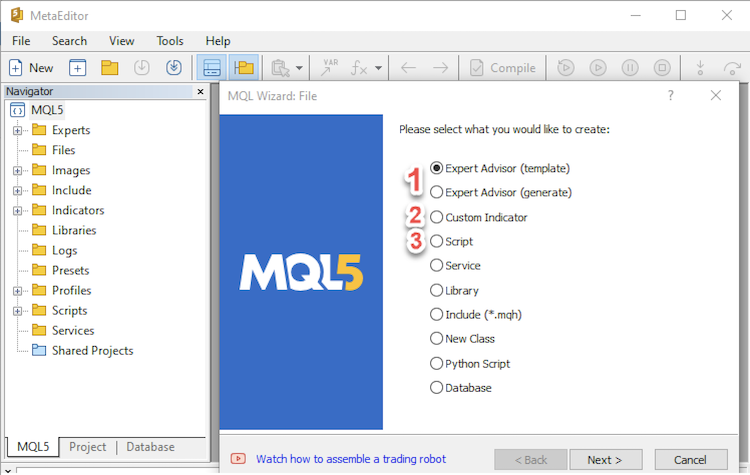
This window offers various options of what you can do using the editor, among them:
1. Open a new file to create an Expert Advisor which can execute the program's conditions automatically.
2. Open a new file to create a Custom Indicator to help us to read the chart clearly and see what does not appear on charts.
3. Open a new file to create a Script which can execute one-time instructions.
In this article, we will choose the first option to create an Expert Advisor which can be executed and run the program's instructions automatically.
In addition to that, I advise you to test everything you learn before using it. If you need to deepen your knowledge you have to practice and apply what you learn by yourself as this will help you to find more new ideas and insights which can be useful for your trading.
Disclaimer: Any information is provided ‘as is’ only for informational purposes and is not prepared for trading purposes or advice. It is no guarantee of any kind of results. If you choose to use these materials on any of your trading accounts, you are doing so at your own risk and you will be the only responsible.
Now, let's go through our topics to learn more about trading and how to create a trading system based on this new knowledge.
MACD definition
In this part of this interesting topic, we will learn in more details about one of the most popular, useful tools which can be used in trading — Moving Average Conversion Divergence which is known as MACD (usually pronounced as as M-A-C-D or MAC - Dee, which is not the important thing though). What's important is to learn how this indicator can be used, what it measures and how it is calculated. This knowledge can be useful for us and our trading as it can enhance our results and can open our eyes to new ideas which can be beneficial in trading.
What is MACD?
It is Moving Average Conversion Divergence, it is an oscillator indicator created or developed by Gerald Appel. It uses two exponential moving averages in its calculation. If you want to know more about Moving averages and their types, please read my previous article Learn how to design different moving average systems. MACD is a trend following indicator also as it follows the trend and confirms it.
It consists of two lines:
- The MACD Line, which is the faster one. It is the result of the difference between two exponential moving average: the period of the first one is 12 and of the second one is 26 by default, but you can change as per your preferences and trading needs.
- The Signal line, which is the slower one. It is the result of 9 period exponentially smoothed average of the MACD Line and that why this line is the slower as it is a moving average of the difference between two moving averages.
There is another component of the MACD indicator — the MACD histogram. It is the result of the difference between the MACD Line and the Signal Line. It shows the difference between the two MACD and Signal Lines and how it can be wide or narrow. But in this article we will focus on the two lines and strategies which can be used by using and reading them.
So, the MACD indicator calculation consists of the following steps:
- Get 12 period exponential moving average (12 EMA).
- Get 26 period exponential moving average (26 EMA).
- Get the difference between 12 EMA and 26 EMA = MACD Line.
- Get 9 period moving average for MACD Line = Signal Line.
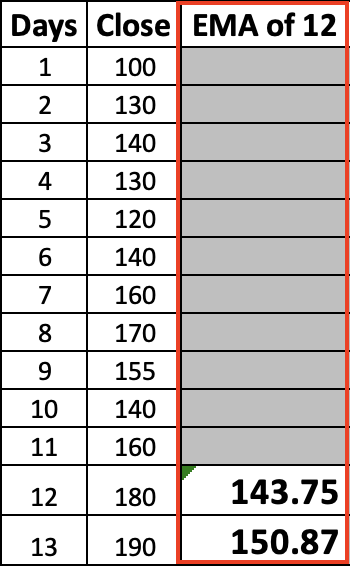
Where EMA = (Close*(2/(n+1)))+(previous MA*(1-(2/(n+1)))). Note that the first calculated moving average is simple and followed by exponential moving average in the calculation.
Let us see an example of how to apply this calculation:
We need a data with a minimum period 34, as it will be 12 period to calculate 12 EMA and 26 period to calculate 26 EMA and the difference between them is the MACD Line then we need more 9 period of MACD Line to calculate the Signal Line. So, if we have the following data for required periods:
| Period | Close |
|---|---|
| 1 | 100 |
| 2 | 130 |
| 3 | 140 |
| 4 | 130 |
| 5 | 120 |
| 6 | 140 |
| 7 | 160 |
| 8 | 170 |
| 9 | 155 |
| 10 | 140 |
| 11 | 160 |
| 12 | 180 |
| 13 | 190 |
| 14 | 200 |
| 15 | 210 |
| 16 | 200 |
| 17 | 190 |
| 18 | 185 |
| 19 | 195 |
| 20 | 200 |
| 21 | 210 |
| 22 | 220 |
| 23 | 215 |
| 24 | 225 |
| 25 | 230 |
| 26 | 235 |
| 27 | 230 |
| 28 | 225 |
| 29 | 220 |
| 30 | 215 |
| 31 | 225 |
| 32 | 235 |
| 33 | 240 |
| 34 | 245 |
Now we can calculate MACD indicator, first we will calculate 12 EMA and it will be like the following:
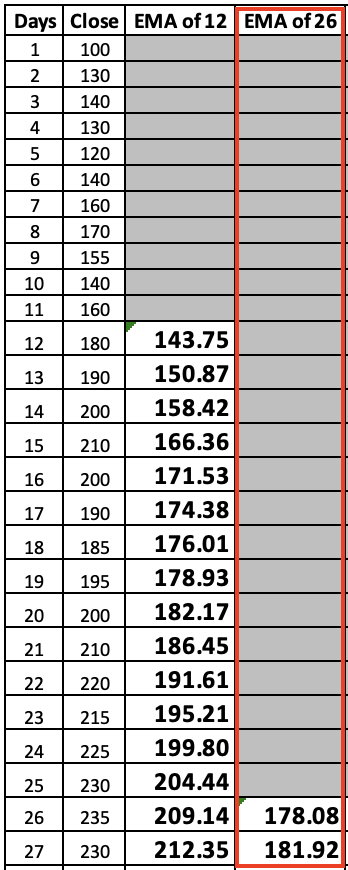
Then, we will calculate 26 EMA:
Then, we will calculate MACD line by calculating the difference between 12 EMA and 26 EMA and it will be the same like the following:
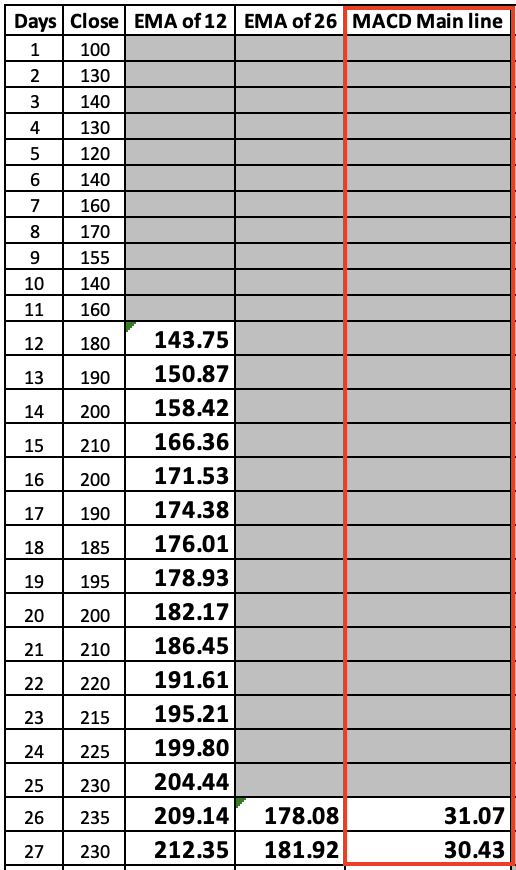
Then calculating the MACD line:
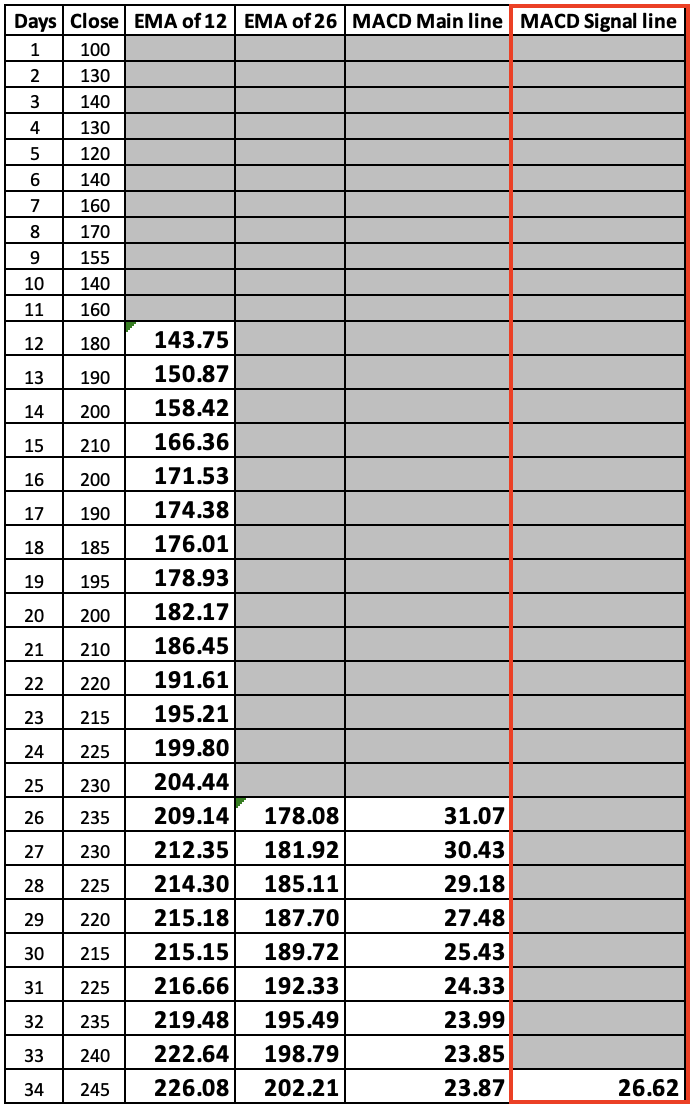
Thus we have calculated the MACD line for this example. Pay attention that we do not need to calculate it manually as this is a built-in indicator available straight in Meta Trader 5. By understanding every detail of the indicator we can better learn the concept. You will find that it appears different in MetaTrader 5 when inserting it because, as I mentioned, it has two lines (MACD line and Signal line) but the difference will appear as follows:
- Bars which represent the MACD Line
- Line which represent Signal Line
But it is the same indicator as the two lines, there is no difference except for the appearance. Now let's see how to insert the indicator and how it will appear on the chart.
In the open MetaTrader 5 terminal, click on the Insert menu, then choose Indicators -> Oscillators -> MACD.
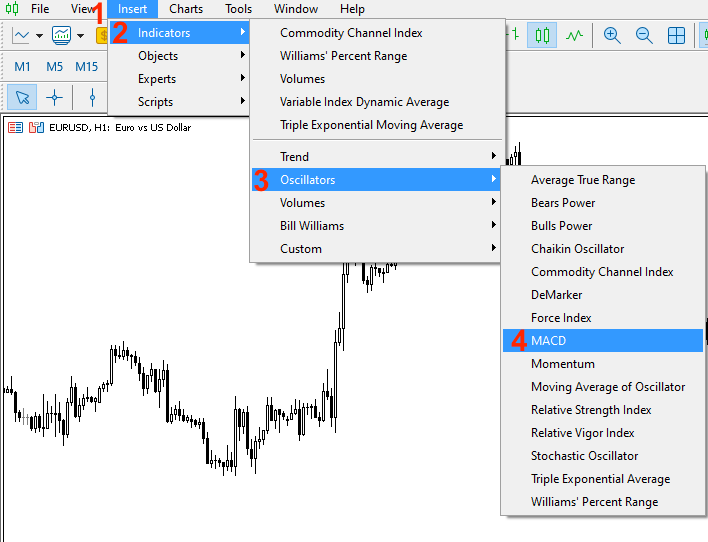
This will open the MACD parameters window:
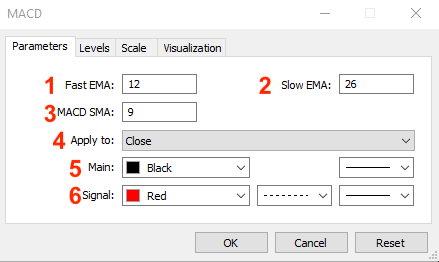
The window features the following MACD parameters:
1,2,3: determine periods to be used in MACD calculation.
4: determine the price types to be used in MACD calculation.
5: set color and bar thickness for MACD line.
6: set color, line style, and thickness for signal line.
After determining desired parameters of MACD and pressing ok, the indicator will appear on the chart as follows:
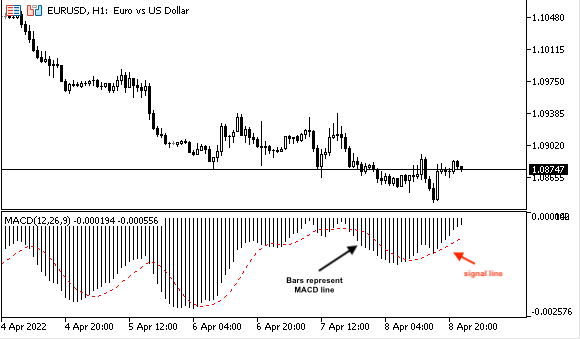
Now we have learnt what the MACD indicator is, how we can calculate it and how it appears on the chart.
MACD strategy
In this part, we will learn two simple strategies which can be used in our trading based on the MACD indicator. The strategy will depend on crossover as we mentioned that MACD indictor is an oscillator indicator and it oscillates around zero. MACD itself consists of two lines and according to these two concepts we will use our strategies.
- Strategy one: MACD Setup Detector.
According to this strategy, we need to identify the market setup: is it buying setup or shorting setup. In other words we need to identify the market direction, if it is bullish or bearish market, and this will be identified by MACD. If the MACD main line breaks above zero level, this will be a buying setup or bullish setup and vice versa if MACD main line breaks below zero level, this will be a shorting setup or bearish.
So,
MACD main line > 0 = Bullish Setup
MACD main line < 0 = Bearish Setup
- Strategy two: MACD Lines Crossover
According to this strategy, we need to identify generated signals if there is a buy signal or a sell signal based on MACD main line and Signal line crossover. If MACD main line breaks above Signal line, this will be a buy signal and if MACD main line breaks below Signal line, this will be a short signal.
So,
MACD main line > MACD signal line = Buying Signal
MACD main line < MACD signal line = Shorting signal
And these are two simple strategies that we can use based on the MACD indicator. Generally speaking, there are many strategies which can be used bsed on MACD and it is very useful. But we will only refer to simple strategies which can be used to understand the concept of MACD. Next, we will learn through the following topics how to design a trading system using these mentioned simple strategies.
MACD blueprint
In this part we need to create a blueprint that will help us to design a trading system for the mentioned two strategies to inform the computer through our designed system or program what to do exactly and this blueprint is to help us step by step what we need to do to create this trading system.
- Strategy one: MACD Setup Detector
According to this strategy we need to tell the computer to check the MACD main line value every tick and then output the setup based on the value compared to zero level. If the MACD main line is above zero, we need the program to give us a comment on the chart: "Bullish Setup As MACD MainLine is..." followed by the current MACD main line value. Or if MACD main line is below zero, we need the program to give us a comment on the chart with "Bearish Setup As MACD MainLine is..." followed by the current MACD main line value.
The following picture shows the blueprint of this strategy:
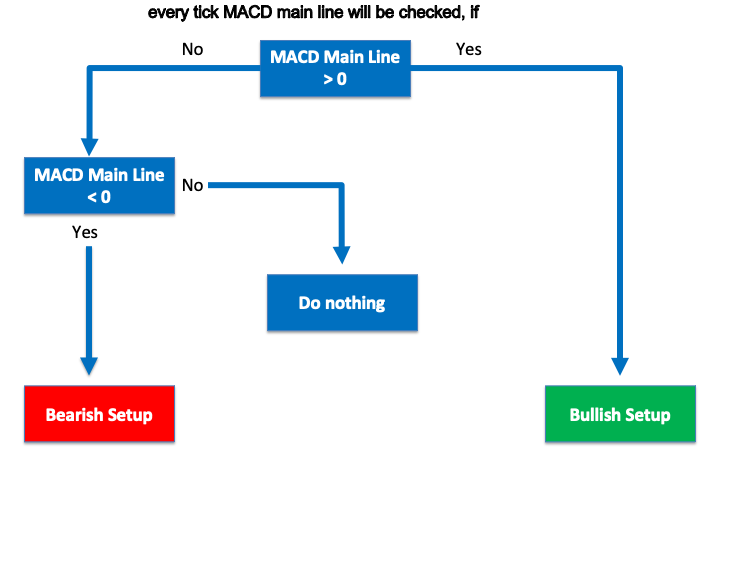
- Strategy two: MACD Lines Crossover
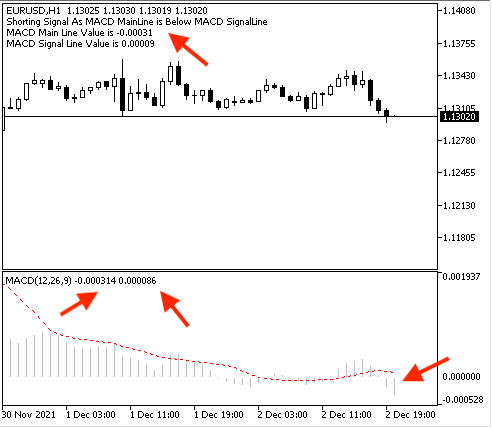
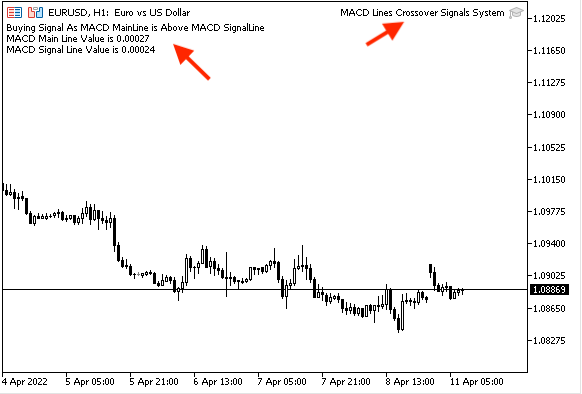
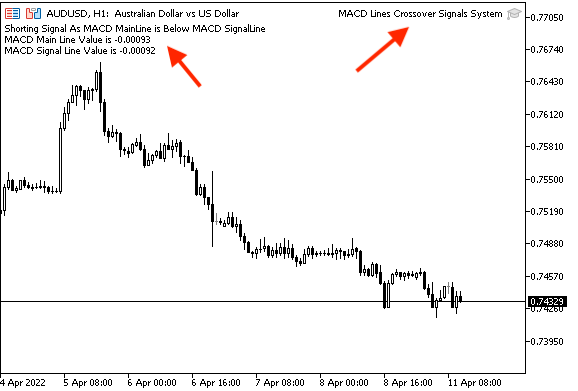
According to this strategy, we need to tell the computer to give us the suitable signal upon the crossover between MACD lines (Main line and Signal line). So, the program will check the MACD lines at every tick and when MACD main line breaks above MACD signal line, the program should comment on the chart with "Buying Signal As MACD MainLine is Above MACD SignalLine" followed by a new line with a comment on the chart with "MACD Main Line Value is..." followed by current MACD main line value followed by a new line with a comment on the chart with "MACD Signal Line Value is... followed by current MACD signal line value.
The following picture shows the blueprint of this strategy:
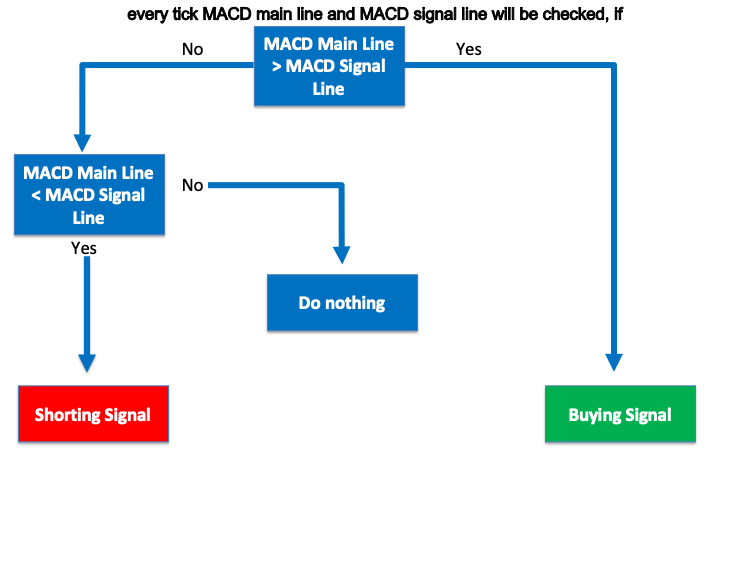
MACD trading system
In this part, we learn how to code these strategies to create our trading system using the MQL5 programming language. The resulting program should then be executed in the MetaTrader 5 trading platform to give us predetermined outputs as per predetermined conditions. But before creating these two simple strategies we will learn how to create a program which can show MACD values on the chart as a comment.
The following code of a program which will display a comment with MACD Main Line Value:
//+------------------------------------------------------------------+
//|                                  Simple MACD MainLine System.mq5 |
//|                                  Copyright 2022, MetaQuotes Ltd. |
//|                                             https://www.mql5.com |
//+------------------------------------------------------------------+
#property copyright "Copyright 2022, MetaQuotes Ltd."
#property link      "https://www.mql5.com"
#property version   "1.00"
//+------------------------------------------------------------------+
void OnTick()
  {
   //cretaing an array for prices
   double MACDMainLine[];

   //Defining MACD and its parameters
   int MACDDef = iMACD(_Symbol,_Period,12,26,9,PRICE_CLOSE);

   //Sorting price array from current data
   ArraySetAsSeries(MACDMainLine,true);

   //Storing results after defining MA, line, current data
   CopyBuffer(MACDDef,0,0,3,MACDMainLine);

   //Get values of current data
   float MACDMainLineVal = (MACDMainLine[0]);

   //Commenting on the chart the value of MACD
   Comment("MACD Value is ",MACDMainLineVal);
  }
//+------------------------------------------------------------------+
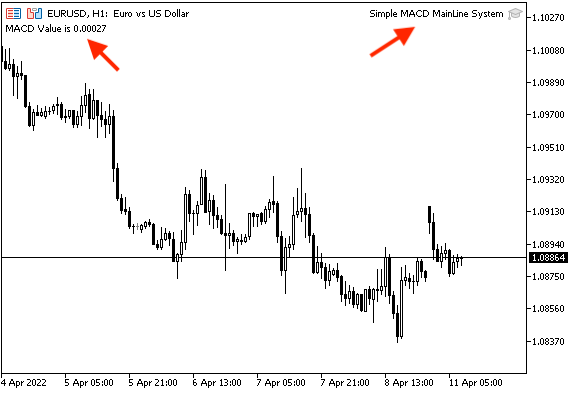
And this Expert Advisor will generate what we need to be generated: we need MACD main line value to be shown on the chart. Here it is:
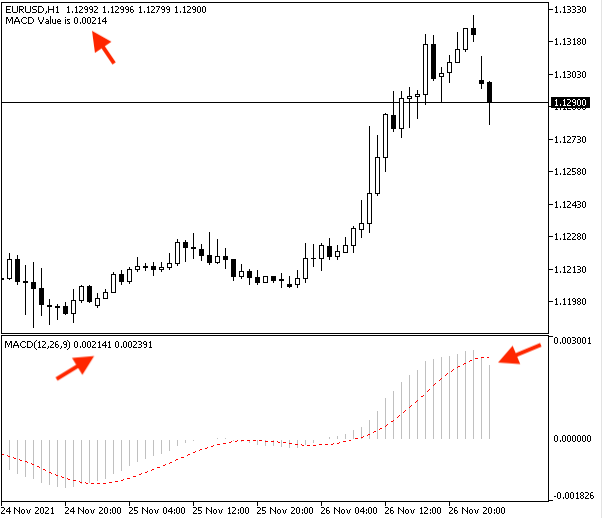
Now, we need to attach the file to the chart to generate the MACD main line value automatically. Find the program in Navigator which can be open by pressing ctrl+N in the open MetaTrader 5:
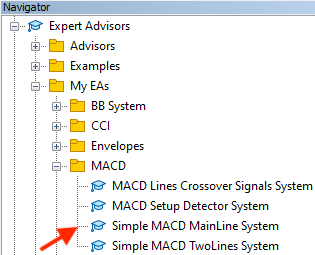
Then, we need now to run or execute this file and we can do that by dragging and dropping the file on the chart or by double clicking on the file and after doing that you can find the following window:
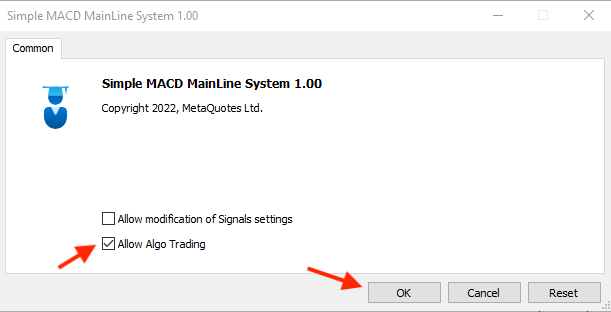
Enablethe "Allow Algo Trading" option and click OK, and the Expert Advisor will be attached to the chart and it will generate MACD main line automatically as follows:
Now, we need to do more by writing a code which can generate not only MACD main line but MACD signal line also. Below is the code for creating a program which can display a comment on the chart with MACD main line and a new line with MACD signal line:
//+------------------------------------------------------------------+
//|                                      Simple MACD TwoLines System |
//|                                  Copyright 2022, MetaQuotes Ltd. |
//|                                             https://www.mql5.com |
//+------------------------------------------------------------------+
#property copyright "Copyright 2022, MetaQuotes Ltd."
#property link      "https://www.mql5.com"
#property version   "1.00"
//+------------------------------------------------------------------+
void OnTick()
  {
   //cretaing an array for prices for MACD main line, MACD signal line
   double MACDMainLine[];
   double MACDSignalLine[];

   //Defining MACD and its parameters
   int MACDDef = iMACD(_Symbol,_Period,12,26,9,PRICE_CLOSE);

   //Sorting price array from current data for MACD main line, MACD signal line
   ArraySetAsSeries(MACDMainLine,true);
   ArraySetAsSeries(MACDSignalLine,true);

   //Storing results after defining MA, line, current data for MACD main line, MACD signal line
   CopyBuffer(MACDDef,0,0,3,MACDMainLine);
   CopyBuffer(MACDDef,1,0,3,MACDSignalLine);

   //Get values of current data for MACD main line, MACD signal line
   float MACDMainLineVal = (MACDMainLine[0]);
   float MACDSignalLineVal = (MACDSignalLine[0]);


   //Commenting on the chart the values of MACD main line and MACD signal line
   Comment("MACD Main Line Value is ",MACDMainLineVal,"\n"
   "MACD Signal Line Value is ",MACDSignalLineVal);
  }
//+------------------------------------------------------------------+
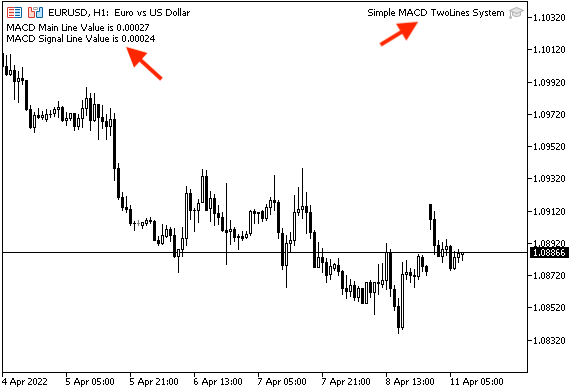
After writing this code and testing this code, it will generate MACD main line and MACD signal line as is shown in the following image:
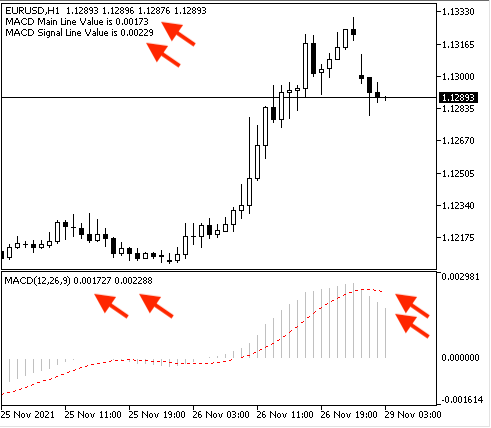
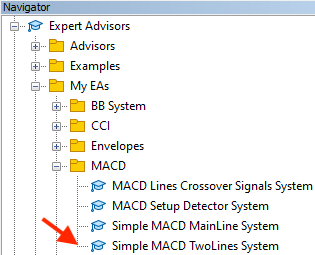
Now, we need to attach this file of the Expert Advisor to the chart to generate MACD line and MACD signal line values on the chart as a comment in two lines automatically. So, select the program in the Navigator:
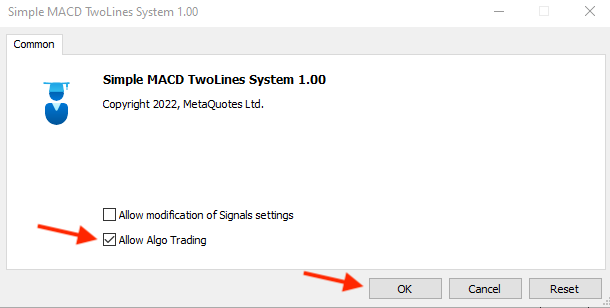
Double click or drag and drop the file to the chart. After that the follwing Expert Advisor window will open:
After pressing OK the expert will be attached and values will be generated on the chart automatically and the following picture represents that:
Now, we need to code our two strategies, MACD main line crossover with zero level and Crossover between MACD main line and MACD signal line. Please note that here we will mention only generated signals without take profits as there are many tools which can be used for this purpose, like the indicator itself or price action. Here we will focus on the generated signals. Let's proceed to creating the code of these strategies.
- Strategy one: MACD Setup Detector — generate the current market setup according to MACD main line crossover with zero level.
MACD main line > 0 = Bullish Setup
MACD main line < 0 = Bearish Setup
Below is the code of a program which generates comments with Market Setup according to MACD main line and zero level crossover and the MACD main line value:
//+------------------------------------------------------------------+
//|                                         MACD Setup Dectector.mq5 |
//|                                  Copyright 2022, MetaQuotes Ltd. |
//|                                             https://www.mql5.com |
//+------------------------------------------------------------------+
#property copyright "Copyright 2022, MetaQuotes Ltd."
#property link      "https://www.mql5.com"
#property version   "1.00"
//+------------------------------------------------------------------+
void OnTick()
  {
   //cretaing an array for prices for MACD main line
   double MACDMainLine[];

   //Defining MACD and its parameters
   int MACDDef = iMACD(_Symbol,_Period,12,26,9,PRICE_CLOSE);

   //Sorting price array from current data
   ArraySetAsSeries(MACDMainLine,true);

   //Storing results after defining MA, line, current data
   CopyBuffer(MACDDef,0,0,3,MACDMainLine);

   //Get values of current data
   float MACDMainLineVal = (MACDMainLine[0]);

   //Commenting on the chart the value of MACD
   if (MACDMainLineVal>0)
   Comment("Bullish Setup As MACD MainLine is ",MACDMainLineVal);

   if (MACDMainLineVal<0)
   Comment("Bearish Setup As MACD MainLine is ",MACDMainLineVal);
  }
//+------------------------------------------------------------------+
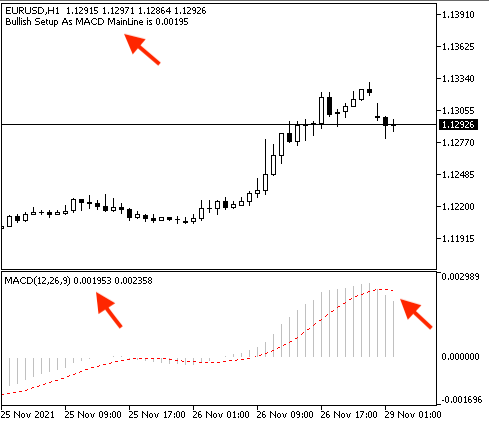
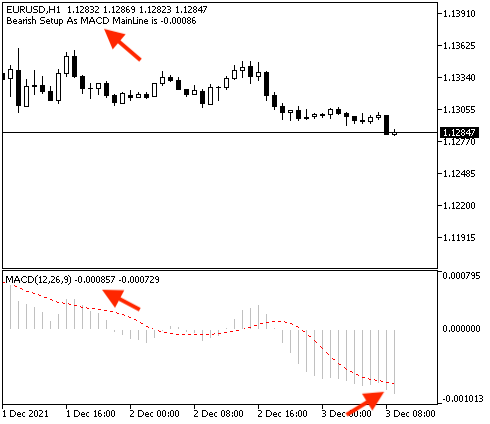
After writing this code and testing it, the following picture shows how it can generate current setup according to crossover between MACD main line and zero level:
Bullish Setup Signal:
Bearish Setup Signal:
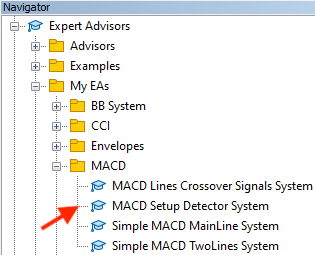
Now, after that we need to attach this expert to the chart to generate these signals automatically by dragging and dropping the file on the chart or double clicking on it from Navigator window:
This will open the following Expert Advisor window:
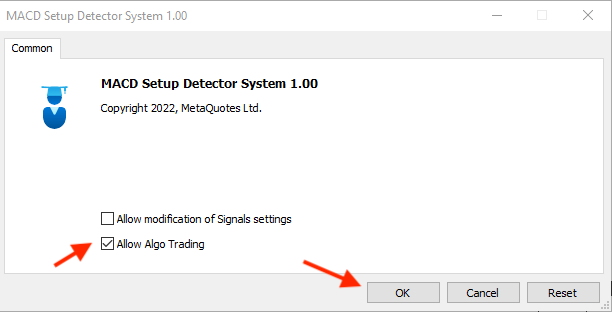
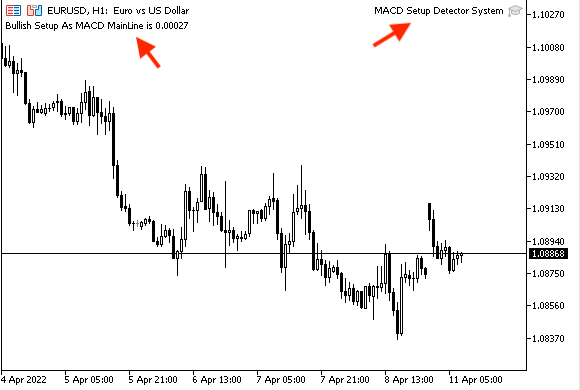
After pressing OK, the expert will be attached to the chart and signals will be generated on the chart as comments automatically.
Bullish Setup Signal with MACD MainLine Value:
Bearish Setup Signal with MACD MainLine Value:
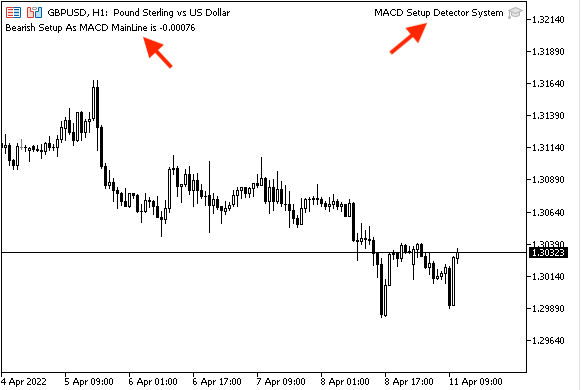
- Strategy two: MACD Lines Crossover — generate buying and shorting signals by crossover between MACD Main Line and MACD Signal Line:
MACD main line > MACD signal line = Buying Signal
MACD main line < MACD signal line = Shorting Signal
The following code creates a program generating comments on the chart with a signal for buying or shorting according to MACD main line and MACD signal line crossover with new two lines with MACD main line and MACD signal line values:
//+------------------------------------------------------------------+
//|                          MACD Lines Crossover Signals System.mq5 |
//|                                  Copyright 2022, MetaQuotes Ltd. |
//|                                             https://www.mql5.com |
//+------------------------------------------------------------------+
#property copyright "Copyright 2022, MetaQuotes Ltd."
#property link      "https://www.mql5.com"
#property version   "1.00"
//+------------------------------------------------------------------+
void OnTick()
  {
   //cretaing an array for prices for MACD main line, MACD signal line
   double MACDMainLine[];
   double MACDSignalLine[];

   //Defining MACD and its parameters
   int MACDDef = iMACD(_Symbol,_Period,12,26,9,PRICE_CLOSE);

   //Sorting price array from current data for MACD main line, MACD signal line
   ArraySetAsSeries(MACDMainLine,true);
   ArraySetAsSeries(MACDSignalLine,true);

   //Storing results after defining MA, line, current data for MACD main line, MACD signal line
   CopyBuffer(MACDDef,0,0,3,MACDMainLine);
   CopyBuffer(MACDDef,1,0,3,MACDSignalLine);

   //Get values of current data for MACD main line, MACD signal line
   float MACDMainLineVal = (MACDMainLine[0]);
   float MACDSignalLineVal = (MACDSignalLine[0]);


   //Commenting on the chart the value of MACD
   if (MACDMainLineVal>MACDSignalLineVal)
   Comment("Buying Signal As MACD MainLine is Above MACD SignalLine","\n"
   "MACD Main Line Value is ",MACDMainLineVal,"\n"
   "MACD Signal Line Value is ",MACDSignalLineVal);

   if (MACDMainLineVal<MACDSignalLineVal)
   Comment("Shorting Signal As MACD MainLine is Below MACD SignalLine","\n"
   "MACD Main Line Value is ",MACDMainLineVal,"\n"
   "MACD Signal Line Value is ",MACDSignalLineVal);
  }
//+------------------------------------------------------------------+
After writing this code and testing it, we will obtain a program that generates signals and lines values.
Buying Signal with mentioning MACD main line is above MACD signal line and MACD main line and MACD signal line values:
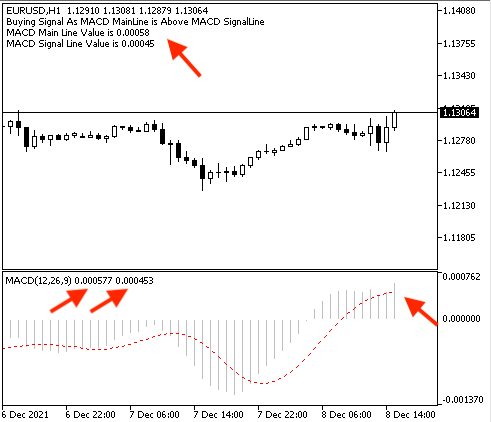
Shorting Signal with mentioning that MACD main line is below MACD signal line and new lines with lines values:
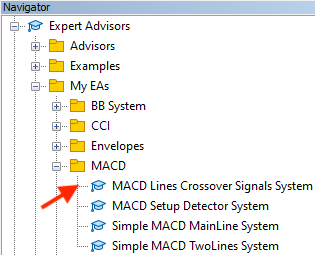
After writing the code, attach the expert file to the chart to generate signals automatically by double clicking on the file or dragging and dropping it on the chart from the Navigator window:
After that, the expert will be attached to the chart and will display signals on the chart.
Buying Signal with the reason for that according to strategy then new lines with MACD lines values as comments:
Shorting Signal with the reason behind that according to the strategy then two new lines with MACD lines values as comments:
Conclusion
Moving Average Convergence Divergence (MACD) indicator is one the most useful tools that can beneficial to our trading and it has many useful strategies which can be helpful to get better results in trading. It is very important to learn how to automate this great tool and create a trading system which can help us to make trading more easier, effective, profitable and in this article I tried to share with you some concepts.
We considered in details about MACD indicator itself about what does it mean and how we calculate it in applicable example to deepen our understanding for this indicator, then we knew simple strategies which can be used by MACD depending on the crossover concepts, then, we created blueprints to learn how to design a trading system for these strategies, then we knew how code MACD and mentioned strategies in details to create a trading system by these strategies. I advice you to test any thing you knew before using it a real account to make sure that it is suitable for your trading and your plan.
And what I believe that if you knew something in details this may lead to new insights and ideas related or non-related to the topic and that what I hope to happen after reading this article to open our eyes on new ideas which can make the difference and can be useful to our trading to get better results. So, I hope you find this article useful for you and your trading.
Warning: All rights to these materials are reserved by MetaQuotes Ltd. Copying or reprinting of these materials in whole or in part is prohibited.
This article was written by a user of the site and reflects their personal views. MetaQuotes Ltd is not responsible for the accuracy of the information presented, nor for any consequences resulting from the use of the solutions, strategies or recommendations described.
 Using the CCanvas class in MQL applications
 Multiple indicators on one chart (Part 01): Understanding the concepts
 Learn how to design a trading system by Stochastic
 Data Science and Machine Learning (Part 02): Logistic Regression
- Free trading apps
- Over 8,000 signals for copying
- Economic news for exploring financial markets
You agree to website policy and terms of use
I enjoy reading your article, and I hope you can design a trading system by Zigzag
Thanks Roberto, I will try to write about it.
New article Learn how to design a trading system by MACD has been published:
Author: Mohamed Abdelmaaboud
Very informative, detailed and helpful article.
Thank you for taking the time to write it down.
There is one thing I don't understand, why is it that when taking the value for MACD main line, MACD signal line uses FLOAT data type instead of using the DOUBLE data type as same type as the source?
Very informative, detailed and helpful article.
Thank you for taking the time to write it down.
There is one thing I don't understand, why is it that when taking the value for MACD main line, MACD signal line uses FLOAT data type instead of using the DOUBLE data type as same type as the source?
Thanks for your comment.
There is no difference, both are right in this case but sometimes FLOAT is used to save memory.