
Drawing Dial Gauges Using the CCanvas Class
Table Of Contents
- Introduction
- 1. Coordinates and Anchor
- 2. Gauge Elements
- 3. Functions
- 3.1. GaugeCreate
- 3.2. GaugeSetCaseParameters
- 3.3. GaugeSetScaleParameters
- 3.4. GaugeSetMarkParameters
- 3.5. GaugeSetMarkLabelFont
- 3.6. GaugeSetLegendParameters
- 3.7. GaugeSetRangeParameters
- 3.8. GaugeSetNeedleParameters
- 3.9. GaugeRedraw
- 3.10. GaugeNewValue
- 3.11. GaugeDelete
- 3.12. GaugeCalcLocation
- 3.13. GaugeRelocation
- 4. Enumerations
- 4.1. ENUM_CASE_BORDER_STYLE
- 4.2. ENUM_CASE_STYLE
- 4.3. ENUM_GAUGE_LEGEND
- 4.4. ENUM_MARK_STYLE
- 4.5. ENUM_MUL_SCALE
- 4.6. ENUM_NCENTER_STYLE
- 4.7. ENUM_NEEDLE_FILL
- 4.8. ENUM_REL_MODE
- 4.9. ENUM_SCALE_STYLE
- 4.10. ENUM_SIZE
- 5. Macro Substitution
- 6. Modifying the CCanvas Class
- 7. Application Examples
- 8. Resource Intensity Assessment
- Conclusion
Introduction
It all started when I first acquainted myself with the CCanvas class. When it came to practice, I stumbled upon an idea to draw a gauge indicator. My first gauges were pretty crude, but eventually they have been supplemented by new elements and become visually pleasing. And as a result, I have a small library now which allows to add a dial gauge to an indicator or an EA in a simple and easy manner. In this article, we will give consideration to structure of gauges, get acquainted with functions necessary for drawing and setting visual appearance, and assess resource intensity.
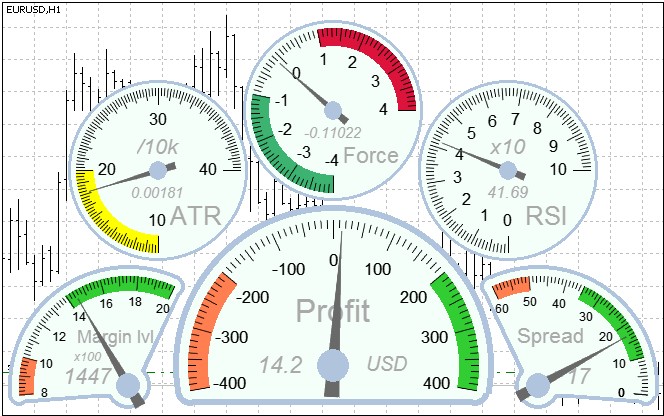
Fig.1. Dial gauges
1. Coordinates and Anchor
There are two types of positioning a gauge on a chart: absolute and relative.
In case of absolute positioning, coordinates represent distances in pixels from an anchor corner along X and Y axis.
In case of relative positioning, local origin of coordinates is created according to the specified type of the relative positioning. When the vertical type is selected, the origin is located below or above a reference object (if an upper or a lower anchor corner is selected respectively). When the vertical type is selected, it is located on the left or on the right in the direction from the anchor corner. In this case, specified coordinates represent an offset from their local origin. Positive offsets lead to moving an object away from the reference object. In case of negative offsets, the object will encroach on the reference one.
The reference object can be represented only by an object of another gauge. It is essential that both objects will have the same anchor corner.
Fig. 2 depicts an example of relative positioning.
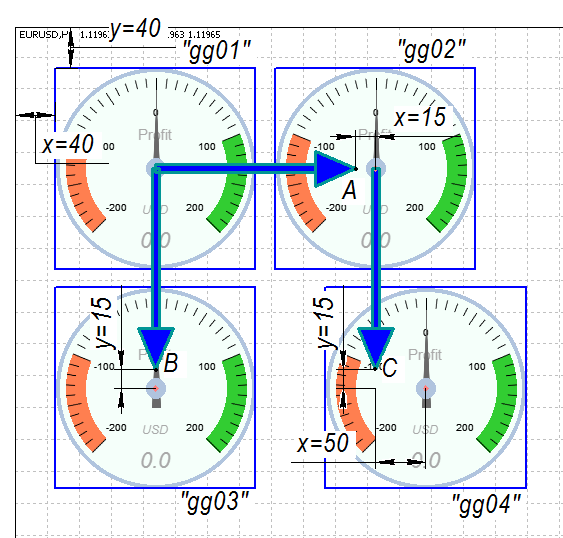
Fig.2. Relative positioning of gauges
Let's review settings of each gauge:
- The "gg01" gauge: relative positioning is disabled. Horizontal offset — 40, vertical offset — 40.
- The "gg02" gauge: relative positioning — horizontal, reference object — "gg01". Horizontal offset from the local origin of coordinates (point A) — 15, vertical offset — 0.
- The "gg03" gauge: relative positioning — vertical, reference object — "gg01". Horizontal offset from the local origin of coordinates (point B) — 0, vertical offset — 15.
- The "gg04" gauge: relative positioning — vertical, reference object — "gg02". Horizontal offset from the local origin of coordinates (point C) — 50, vertical offset — 15.
Relative positioning facilitates input setting if the chart has several indicators containing gauges. If you decide to change size of one gauge, other gauges' coordinates will be automatically recalculated.
The GaugeCreate() function sets the positioning type and coordinates.
2. Gauge Elements
The dial gauge consists of two graphical objects. One of them is called a scale layer, another one is called a needle layer. Both graphical objects have the same coordinates. The needle layer is placed over the scale layer. The gauge name set in input parameters serves as a prefix for names of both objects. For example, if the gauge name is "Gauge01", the scale layer will be called "Gauge01_s", and the needle layer will have name "Gauge01_n".
Fig.3 depicts structure of the gauge.
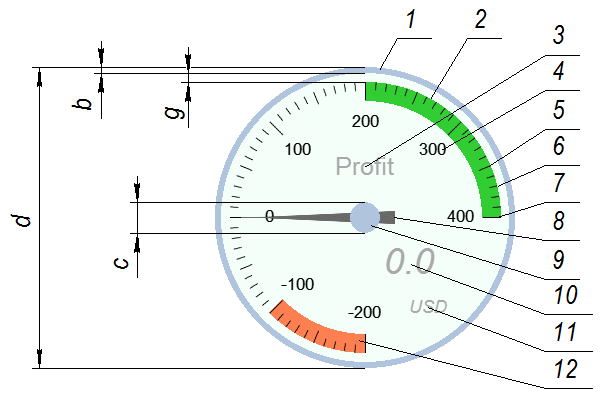
Fig.3. Gauge structure
The scale layer contains:
- border (1)
- scale graduation marks (5, 6, 7)
- scale graduation labels (4)
- highlighted ranges (2, 12)
- legends (3, 10, 11)
Legends are distinguished by purposes:
- gauge description (3)
- units of measure (11)
- current value (10)
- multiplier of scale labels (omitted)
Scale graduation is divided into:
- major (7)
- middle (5)
- minor (6)
Only major graduation points have labels. Graduation step is set as a numeric value. Middle graduation step is calculated depending on a specified number of middle marks between major ones. Minor graduation step is calculated depending on a specified number of minor marks between middle ones. Minor and middle graduation can be omitted.
The needle layer contains:
- needle (8)
- needle center (9)
Fig.3 depicts sizes of some gauge elements:
- d — gauge size which corresponds to the diameter of the external contour line of the gauge
- b — border size
- g — size of space between a border and scale elements
- c — size of the needle center.
NB. The gauge diameter is the only size set in pixels ("d" in fig.3). All other elements and fonts are set in conditional units and their sizes are calculated as percentage of the diameter. It is made to facilitate scaling. Change the diameter, and all other sizes will be proportionally recalculated. Calculation coefficients are listed in the Macro Substitution section and can be modified by the user.
There are two types of gauge body shape: a circle and a sector. The sector shape is more convenient if the scale range angle is less than 180 degrees.
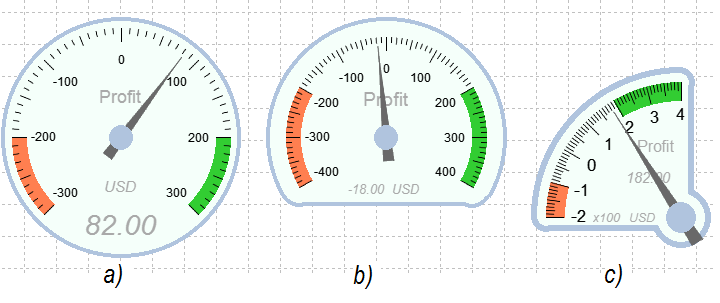
Fig.4. Gauge shape
Fig.4 depicts one circle gauge (a) and two sector shape gauges (b, c). The GaugeSetCaseParameters() function is used to set the desired body shape.
This is the most important element of the gauge. Data readability depends on its appearance. The scale should not be overcomplicated, but at the same time it must be informative enough. Selection of scale extreme values, as well as a step of major marks, call for special attention. The GaugeSetScaleParameters() function allows to set the scale range, its rotation and extreme values (minimum and maximum). Minimum value can be on the left (direct order) or on the right (inverse order).
The scale range is an angle contained by two radius vectors of scale extreme values. It is demonstrated in Fig.5.
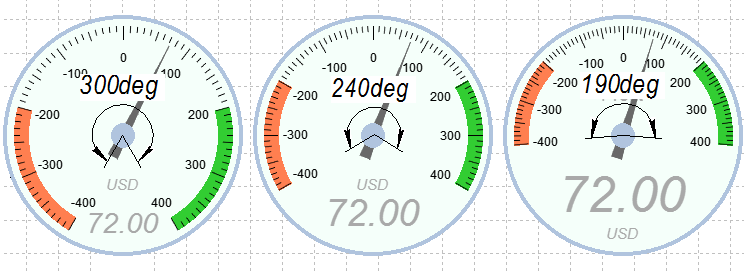
Fig.5. Scale range
The scale rotation is an angle of deviation of the scale range angle bisector from the line which upwardly and vertically comes from the gauge center. It is demonstrated in Fig.6.
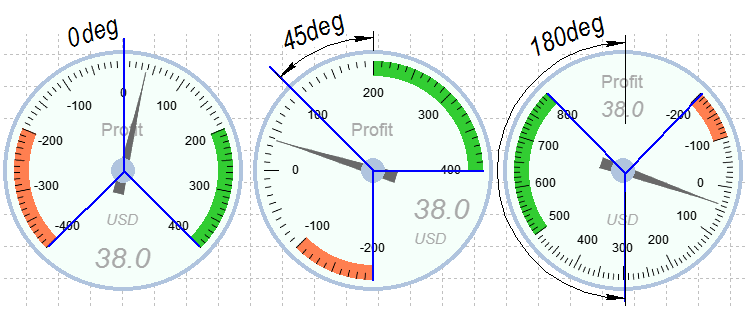
Fig.6. Scale rotation angle
Combining the scale range angle and the rotation angle can help you to set the gauge appearance in a quite flexible manner. Fig.4(c) demonstrates a gauge with 90 degree range and 45 degree rotation.
Maximum and minimum scale values are important parameters which should be selected depending on the range of allowed values of the displayed variable. Zero mark can be omitted for the sake of convenience. There is no point in drawing the scale from zero if your variable changes in the range from 400 to 600. Fig.7 depicts some examples of maximum and minimum scale values.
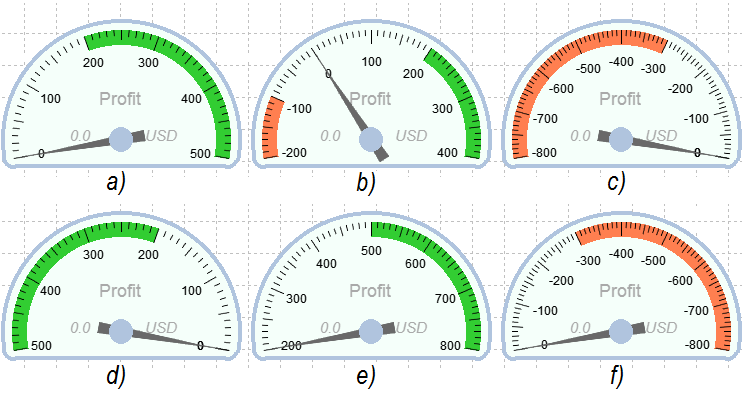
Fig.7. Maximum and minimum scale values
- a) values from 0 to 500, direct order
- b) values from -200 to 400, direct order
- c) values from -400 to 0, direct order
- d) values from 500 to 0, inverse order
- e) values from 200 to 800, direct order
- f) values from 0 to -800, inverse order
Graduation mark setting lies in selecting size of marks and aligning method.
Alignment can be as follows:
- inner edge of the scale
- outer edge of the scale
- center
Fig.8 depicts examples of aligning scale graduation marks:
- a — center
- b — inner edge
- c — outer edge
The GaugeSetMarkParameters() function is used for setting.
Position of labels for marks is referred to scale settings and adjusted using the GaugeSetScaleParameters() function.
Fig.8(a) depicts an example of positioning labels inside the scale, Fig.8(b) and 8(c) — outside the scale.
It is recommended to use a multiplier, a coefficient all displayed values will be divided by, so the labels won't occupy too much space on the scale. The multiplier can have values from 0.0001 to 10000. Fig.4(c) depicts an example of applying a multiplier equal to 100, which allowed to use one-digit numbers instead of three-digit numbers in labels. Fig.1 depicts a situation where we use a multiplier equal to 0.0001 for ATR, which allowed not to use the decimal point and zeros in labels. The GaugeSetScaleParameters() function sets the multiplier.
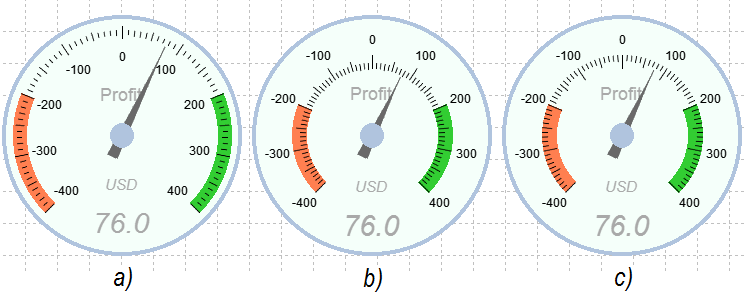
Fig.8. Positioning marks and labels
Legends are meant for displaying supplemental information and can be of four types:
- gauge description
- units of measure
- current value
- multiplier
Any legend can be hidden. Only the gauge description is displayed by default.
Legend positioning is set by the angle and the radius. The angle is set in degrees and its value is equal to the angle between the line, which upwardly and vertically comes from the gauge center, and an imaginary segment, which connects the gauge center and the legend center. The radius is set in conditional units. It can have values from 0 to 10, where 0 corresponds to the radius of the needle center and 10 corresponds to the outer radius of the scale.
Fig.9 depicts an example of legend positioning.
- The "Profit" legend (gauge description) has following coordinates: angle - 0, radius - 3.
- The "0.00" legend (current value) has following coordinates: angle - 225, radius - 4.
- The "USD" legend (units of measure) has following coordinates: angle - 215, radius - 8.
The GaugeSetLegendParameters() function is used for setting the legend parameters.
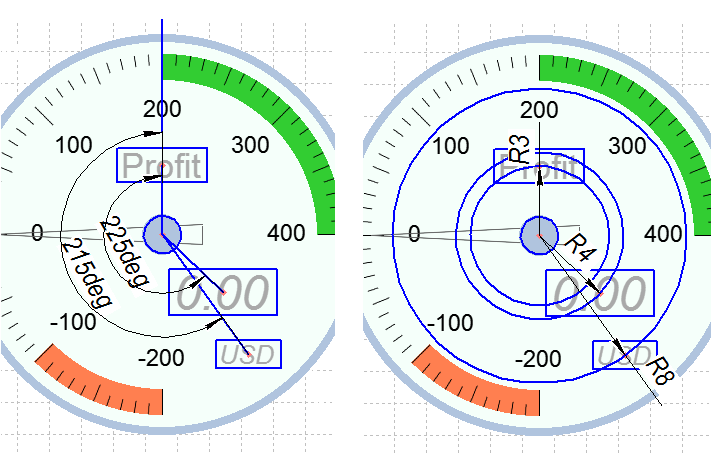
Fig.9. Legend coordinates
NB. Legends are not fixed on the scale and their angles are not connected with the scale rotation angle.
Highlighted data ranges represent an inherent element of any gauge. They help to see that the variable has taken on an emergency value or entered some special range. The GaugeSetRangeParameters() function can set up to four highlighted ranges. To do so, you need to set extreme values and color for highlighting. Fig.1 depicts the Profit indicator with two highlighted ranges: from 200 to 400 is the green range, which indicates time for fixing profit, and from -200 to -400 is the orange range, warning about large drawdown.
The GaugeSetNeedleParameters() function sets the size of the needle center and the type of area fill. The type of area fill influences on resource intensity of the indicator, as the needle layer is fully redrawn every time after data update. Fig.10 depicts example of area fill.
- filled needle with the use of antialiasing algorithm (a)
- filled needle without the use of antialiasing algorithm (b)
- not filled needle with the antialiased contour line (c)
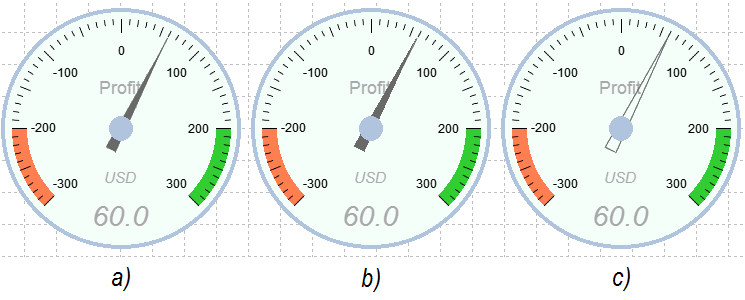
Fig.10. Methods of needle area fill
Pros and cons of each method are described in sections devoted to modification of the CCanvas class and resource intensity assessment.
3. Functions
Table 1 lists functions for drawing gauges and setting their appearance.
| Function | Behavior |
|---|---|
| GaugeCalcLocation | Calculates gauge center coordinates |
| GaugeCreate | Creates the gauge |
| GaugeDelete | Deletes the gauge |
| GaugeNewValue | Updates position of the needle and displayed value |
| GaugeRedraw | Redraws the gauge |
| GaugeRelocation | Changes location of gauge objects on the chart |
| GaugeSetCaseParameters | Sets gauge body parameters |
| GaugeSetLegendParameters | Sets legend parameters |
| GaugeSetMarkLabelFont | Sets font of graduation labels |
| GaugeSetMarkParameters | Sets scale graduation parameters |
| GaugeSetNeedleParameters | Sets needle parameters |
| GaugeSetRangeParameters | Sets range parameters |
| GaugeSetScaleParameters | Sets scale parameters |
Table 1. List of functions
Let's consider each function in depth. They are represented in the order in which we recommend to call them when initializing.
Creates the gauge.
bool GaugeCreate(
   string name,              // gauge name
   GAUGE_STR &g,             // reference to the gauge structure
   int x,                    // horizontal indent from the anchor corner
   int y,                    // vertical indent from the anchor corner
   int size,                 // gauge size
   string ObjRel,            // name of a graphical object relatively to which the position is set
   ENUM_REL_MODE rel_mode,   // relative positioning
   ENUM_BASE_CORNER corner,  // anchor corner
   bool back,                // objects on the background
   uchar scale_transparency, // scale transparency
   uchar needle_transparency // needle transparency
 );
Parameters
name
[in] Gauge name. Used as a prefix for names of graphical objects which compose the gauge.
g
[out] Reference to the gauge structure.
x
[in] Distance in pixels from the anchor corner along the X axis. In case of relative positioning — distance from the local origin of coordinates.
y
[in] Distance in pixels from the anchor corner along the Y axis. In case of relative positioning — distance from the local origin of coordinates.
size
[in] Size of the gauge. Represented as the body diameter.
ObjRel
[in] Name of another graphical object relatively to which the position is set. Remains pertinent only if relative positioning is set.
rel_mode
[in] Method of relative positioning. Can have any value listed in ENUM_REL_MODE.
corner
[in] Chart corner to anchor the graphical object. Can have any value listed in ENUM_BASE_CORNER.
back
[in] Objects on the background.
scale_transparency
[in] Scale transparency level. Can have values from 0 to 255.
needle_transparency
[in] Needle transparency level. Can have values from 0 to 255.
Return value
Returns true if objects of the scale layer and the needle layer have been created. Otherwise returns false.
Sets gauge body parameters.
void GaugeSetCaseParameters(
   GAUGE_STR &g,                  // reference to the gauge structure
   ENUM_CASE_STYLE style,         // body style
   color ccol,                    // body color
   ENUM_CASE_BORDER_STYLE bstyle, // border style
   color bcol,                    // border color
   ENUM_SIZE border_gap_size      // size of space between a border and scale elements
);
Parameters
g
[out] Reference to the gauge structure.
style
[in] Body style. Can have any value listed in ENUM_CASE_STYLE.
ccol
[in] Body color.
bstyle
[in] Border style. Can have any value listed in ENUM_CASE_BORDER_STYLE.
bcol
[in] Border color.
gap_size
[in] Area between the internal line of the border and the nearest scale element ("g" in fig.3). Can have any value listed in ENUM_SIZE.
Sets scale parameters.
void GaugeSetScaleParameters(
   GAUGE_STR &g,           // reference to the gauge structure
   int range,              // scale range
   int rotation,           // angle of rotation
   double min,             // minimum value (left)
   double max,             // maximum value (right)
   ENUM_MUL_SCALE mul,     // multiplier of scale labels
   ENUM_SCALE_STYLE style, // scale style
   color col,              // scale color
   bool display_arc        // display scale line
);
Parameters
g
[out] Reference to the gauge structure.
range
[in] Scale range. Set as an angle contained by two radius vectors of scale extreme marks. Can have values from 30 to 320 degrees (Fig.5).
rotation
[in] Scale rotation angle (Fig.6).
min
[in] Minimum scale value in case of direct number assignment.
max
[in] Maximum scale value in case of direct number assignment.
mul
[in] Multiplier of scale labels. Can have any value listed in ENUM_MUL_SCALE.
style
[in] Scale style. Can have any value listed in ENUM_SCALE_STYLE.
col
[in] Scale color.
display_arc=false
[in] Display scale line.
Sets scale graduation parameters.
void GaugeSetMarkParameters(
   GAUGE_STR &g,          // reference to the gauge structure
   ENUM_MARK_STYLE style, // style of scale marks
   ENUM_SIZE size,        // size of marks
   double major_tmi,      // major mark interval
   int middle_tmarks,     // number of middle marks between major ones
   int minor_tmarks       // number of minor marks between middle ones
);
Parameters
g
[out] Reference to the gauge structure.
style
[in] Style of scale graduation. Can have any value listed in ENUM_MARK_STYLE.
size
[in] Mark size. Can have any value listed in ENUM_SIZE.
major_tmi
[in] Step of major graduation marks. Major marks are accompanied by labels with relevant values.
middle_tmarks
[in] Number of middle marks between major ones. Can have any positive value. No size constraints. If set to 0, middle marks are not displayed.
minor_tmarks
[in] Number of minor marks between middle ones (or between major marks if middle ones are not displayed). Can have any positive value. No size constraints. If set to 0, minor marks are not displayed.
Sets font of graduation marks.
void GaugeSetMarkLabelFont(
   GAUGE_STR &g,        // reference to the gauge structure
   ENUM_SIZE font_size, // font size
   string font,         // font
   bool italic,         // italic
   bool bold,           // bold
   color col            // color
);
Parameters
g
[out] Reference to the gauge structure.
font_size
[in] Font size of graduation labels. Can have any value listed in ENUM_SIZE.
font
[in] Font.
italic
[in] Italic.
bold
[in] Bold.
col
[in] Font color.
Sets legend parameters.
void GaugeSetLegendParameters(
   GAUGE_STR &g,         // reference to the gauge structure
   ENUM_GAUGE_LEGEND gl, // legend type
   bool enable,          // display legend
   string str,           // string (or a complementary parameter)
   int radius,           // coordinates - radius
   double angle,         // coordinates - angle
   uint font_size,       // font size
   string font,          // font
   bool italic,          // italic
   bool bold,            // bold
   color col             // color
);
Parameters
g
[out] Reference to the gauge structure
gl
[in] Legend type. Can have any value listed in ENUM_GAUGE_LEGEND.
enable
[in] Display the legend.
str
[in] This is a displayed string for legends of LEGEND_DESCRIPTION or LEGEND_UNITS type. This parameter is ignored for a legend of the LEGEND_MUL type. Number of decimal places for a legend of the LEGEND_VALUE type. Can have values from "0" to "8". Any other values are perceived as "0". For example, the string "2" means two decimal places. The string "hello" means 0 decimal places.
radius
[in] Radius. Distance from the gauge center to the legend center in conditional units (fig. 9).
angle
[in] Angular coordinates. Its value is equal to the angle between the line, which upwardly and vertically comes from the gauge center, and an imaginary segment, which connects the gauge center and the legend center (Fig.9).
font_size
[in] Legend font size.
font
[in] Font.
italic
[in] Italic.
bold
[in] Bold.
col
[in] Font color.
Sets highlighted range parameters.
void GaugeSetRangeParameters(
   GAUGE_STR &g, // reference to the gauge structure
   int index,    // range index
   bool enable,  // display range
   double start, // initial value
   double end,   // final value
   color col     // color
);
Parameters
g
[out] Reference to the gauge structure.
index
[in] Range index. Can have values from 0 to 3.
enable
[in] Display range.
start
[in] Initial value.
end
[in] Final value.
col
[in] Color to highlight the range.
Sets needle parameters.
void GaugeSetNeedleParameters(
   GAUGE_STR &g,                     // reference to the gauge structure
   ENUM_NCENTER_STYLE ncenter_style, // needle center style
   color ncenter_col,                // needle center color
   color needle_col,                 // needle color
   ENUM_NEEDLE_FILL needle_fill      // method of needle area fill
);
Parameters
g
[out] Reference to the gauge structure.
ncenter_style
[in] Style of the needle center. Can have any value listed in ENUM_NCENTER_STYLE.
ncenter_col
[in] Needle center color.
needle_col
[in] Needle color.
needle_fill
[in] Method of needle area fill. Can have any value listed in ENUM_NEEDLE_FILL.
Redraws the gauge. The function has to be called after changing any parameters to apply these changes.
void GaugeRedraw(
   GAUGE_STR &g       // reference to the gauge structure
);
Parameters
g
[in] Reference to the gauge structure.
Updates position of the needle and displayed value.
void GaugeNewValue(
   GAUGE_STR &g,     // reference to the gauge structure
   double v          // variable value
);
Parameters
g
[in] Reference to the gauge structure.
v
[in] Current value of variable.
Deletes graphical objects which compose the gauge. Call the function from the OnDeinit() handler.
void GaugeDelete(
   GAUGE_STR &g      // reference to the gauge structure
);
Parameters
g
[in] Reference to the gauge structure.
Calculates coordinates of gauge objects. If relative positioning is disabled, it will always return same coordinates. Otherwise coordinates may differ from previous values if the reference object has changed its location or size.
bool GaugeCalcLocation(
   GAUGE_STR& g         // reference to the gauge structure
);
Parameters
g
[in] Reference to the gauge structure.
Return value
Returns true if coordinate values differ from previous ones. Otherwise returns false. If the function returns true, call the GaugeRelocation() function to apply calculated parameters.
Locates graphical objects which compose the gauge on the specified spot of the chart. Necessary to call if relative positioning is set and the GaugeCalcLocation() function has returned true.
void GaugeRelocation(
   GAUGE_STR &g       // reference to the gauge structure
);
Parameters
g
[in] Reference to the gauge structure.
4. Enumerations
Table 2 lists enumerations used as function parameters.
| Enumeration | Description |
|---|---|
| ENUM_CASE_BORDER_STYLE | Border style |
| ENUM_CASE_STYLE | Body style |
| ENUM_GAUGE_LEGEND | Legend type |
| ENUM_MARK_STYLE | Style of scale graduation |
| ENUM_MUL_SCALE | Multiplier of scale graduation labels |
| ENUM_NCENTER_STYLE | Style of the needle center |
| ENUM_NEEDLE_FILL | Method of needle area fill |
| ENUM_REL_MODE | Method of relative positioning |
| ENUM_SCALE_STYLE | Scale style |
| ENUM_SIZE | Size |
Table 2. List of enumerations
4.1. ENUM_CASE_BORDER_STYLE
Border style. Values are listed in table 3.
| Identifier | Description |
|---|---|
| CASE_BORDER_NONE | No border |
| CASE_BORDER_THIN | Thin border |
| CASE_BORDER_THICK | Thick border |
Table 3. Values of ENUM_CASE_BORDER_STYLE
4.2. ENUM_CASE_STYLE
Body style. Values are listed in table 4.
| Identifier | Description |
|---|---|
| CASE_ROUND | Circular body |
| CASE_SECTOR | Sector-type body |
Table 4. Values of ENUM_CASE_STYLE
4.3. ENUM_GAUGE_LEGEND
Legend type. Values are listed in table 5.
| Identifier | Description |
|---|---|
| LEGEND_DESCRIPTION | Gauge description |
| LEGEND_UNITS | Units of measure |
| LEGEND_MUL | Multiplier of scale labels |
| LEGEND_VALUE | Current value of variable |
Table 5. Values of ENUM_GAUGE_LEGEND
4.4. ENUM_MARK_STYLE
Style of scale graduation. Values are listed in table 6.
| Identifier | Description |
|---|---|
| MARKS_INNER | Aligning marks by the inner edge |
| MARKS_MIDDLE | Aligning marks by the center |
| MARKS_OUTER | Aligning marks by the outer edge |
Table 6. Values of ENUM_MARK_STYLE
4.5. ENUM_MUL_SCALE
Multiplier of scale graduation labels. Values are listed in table 7.
| Identifier | Meaning | Display |
|---|---|---|
| MUL_10000 | 10000 | х10k |
| MUL_1000 | 1000 | х1k |
| MUL_100 | 100 | х100 |
| MUL_10 | 10 | х10 |
| MUL_1 | 1 | Not displayed |
| MUL_01 | 0.1 | /10 |
| MUL_001 | 0.01 | /100 |
| MUL_0001 | 0.001 | /1k |
| MUL_00001 | 0.0001 | /10k |
Table 7. Values of ENUM_MUL_SCALE
4.6. ENUM_NCENTER_STYLE
Style of the needle center. Values are listed in table 8.
| Identifier | Description |
|---|---|
| NDCS_NONE | Don't display the needle center |
| NDCS_SMALL | Display small |
| NDCS_LARGE | Display large |
Table 8. Values of ENUM_NCENTER_STYLE
4.7. ENUM_NEEDLE_FILL
Method of needle area fill. Values are listed in table 9.
| Identifier | Description |
|---|---|
| NEEDLE_FILL | Fill the needle without antialiasing of edges |
| NEEDLE_FILL_AA | Fill the needle with antialiasing of edges |
| NEEDLE_NOFILL_AA | Don't fill the needle but apply antialiasing of edges |
Table 9. Values of ENUM_NEEDLE_FILL
4.8. ENUM_REL_MODE
Method of relative positioning. Values are listed in table 10.
| Identifier | Description |
|---|---|
| RELATIVE_MODE_NONE | Relative positioning is disabled |
| RELATIVE_MODE_HOR | Horizontally |
| RELATIVE_MODE_VERT | Vertically |
| RELATIVE_MODE_DIAG | Diagonally |
Table 10. Values of ENUM_REL_MODE
4.9. ENUM_SCALE_STYLE
Scale style. Values are listed in table 11.
| Identifier | Description |
|---|---|
| SCALE_INNER | Graduation labels inside the scale |
| SCALE_OUTER | Graduation labels outside the scale |
Table 11. Values of ENUM_SCALE_STYLE
4.10. ENUM_SIZE
Size. Values are listed in table 12.
| Identifier | Description |
|---|---|
| SIZE_SMALL | Small |
| SIZE_MIDDLE | Middle |
| SIZE_LARGE | Large |
Table 12. Values of ENUM_SIZE
5. Macro Substitution
Coefficients for sizes:
#define DIAM_TO_NDCSL_RATIO   5   //needle center diameter (small) as percentage of the body diameter
#define DIAM_TO_NDCSB_RATIO   7.5 //needle center diameter (large) as percentage of the body diameter
//---
#define DIAM_TO_BD_SIZE_S     2 //border width (small) as percentage of the body diameter
#define DIAM_TO_BD_SIZE_B     5 //border width (large) as percentage of the body diameter
//---
#define DIAM_TO_BD_GAP_S      2.0 //space from the body border to inner elements of the gauge (small) as percentage of the body diameter
#define DIAM_TO_BD_GAP_M      3.0 //space from the body border to inner elements of the gauge (middle) as percentage of the body diameter
#define DIAM_TO_BD_GAP_L      7.0 //space from the body border to inner elements of the gauge (large) as percentage of the body diameter
//---
#define DIAM_TO_MSZ_MJ_S      3.3 //size of major scale (small) graduation as percentage of the body diameter
#define DIAM_TO_MSZ_MD_S      2.3 //size of middle scale (small) graduation as percentage of the body diameter
#define DIAM_TO_MSZ_MN_S      1.3 //size of minor scale (small) graduation as percentage of the body diameter
//---
#define DIAM_TO_MSZ_MJ_M      6.5 //size of major scale (middle) graduation as percentage of the body diameter
#define DIAM_TO_MSZ_MD_M      4.8 //size of middle scale (middle) graduation as percentage of the body diameter
#define DIAM_TO_MSZ_MN_M      3.0 //size of minor scale (middle) graduation as percentage of the body diameter
//---
#define DIAM_TO_MSZ_MJ_L      10.0 //size of major scale (large) graduation as percentage of the body diameter
#define DIAM_TO_MSZ_MD_L      7.5  //size of middle scale (large) graduation as percentage of the body diameter
#define DIAM_TO_MSZ_MN_L      5.0  //size of minor scale (large) graduation as percentage of the body diameter
//---
#define DIAM_TO_MFONT_SZ_S    4   //font size of scale (small) graduation labels as percentage of the body diameter
#define DIAM_TO_MFONT_SZ_M    6.5 //font size of scale (middle) graduation labels as percentage of the body diameter
#define DIAM_TO_MFONT_SZ_L    10  //font size of scale (large) graduation labels as percentage of the body diameter
Default colors:
#define DEF_COL_SCALE      clrBlack
#define DEF_COL_MARK_FONT  clrBlack
#define DEF_COL_CASE       clrMintCream
#define DEF_COL_BORDER     clrLightSteelBlue
#define DEF_COL_LAB        clrDarkGray
#define DEF_COL_NCENTER    clrLightSteelBlue
#define DEF_COL_NEEDLE     clrDimGray
6. Modifying the CCanvas Class
6.1. Drawing a Segment Using Antialiasing Algorithm
The LineAA method allows to draw a segment using the antialiasing algorithm. But one problem turns up when we draw circular scale marks. When we convert coordinates of the segment's initial and final points from polar to rectangular coordinate system, we have fractional numbers which round up to a whole number. Consequently marks look crooked, which is shown in fig.11(b).
That's why we have added the LineAA2 method, which differs from LineAA by the fact that the type of x1, y1, x2, y2 input parameters has been changed to double. Thus we can deliver fractional values of coordinates and get rid of the mentioned problem, which is vividly seen in figure 11(c).
//+------------------------------------------------------------------+
//| Draw line with antialiasing (with style) v.2                     |
//+------------------------------------------------------------------+
void CCanvas::LineAA2(const double x1,const double y1,const double x2,const double y2,const uint clr,const uint style)
  {
//--- line is out of image boundaries
   if((x1<0 && x2<0) || (y1<0 && y2<0))
      return;
   if(x1>=m_width && x2>=m_width)
      return;
   if(y1>=m_height && y2>=m_height)
      return;
//--- check
   if(x1==x2 && y1==y2)
     {
      PixelSet(int(x1),int(y1),clr);
      return;
     }
//--- set the line style
   if(style!=UINT_MAX)
      LineStyleSet(style);
//--- preliminary calculations
   double dx=x2-x1;
   double dy=y2-y1;
   double xy=sqrt(dx*dx+dy*dy);
   double xx=x1;
   double yy=y1;
   uint   mask=1<<m_style_idx;
//--- set pixels
   dx/=xy;
   dy/=xy;
   do
     {
      if((m_style&mask)==mask)
         PixelSetAA(xx,yy,clr);
      xx+=dx;
      yy+=dy;
      mask<<=1;
      if(mask==0x1000000)
         mask=1;
     }
   while(fabs(x2-xx)>=fabs(dx) && fabs(y2-yy)>=fabs(dy));
  }
Fig.11 depicts examples of various methods of drawing scale marks:
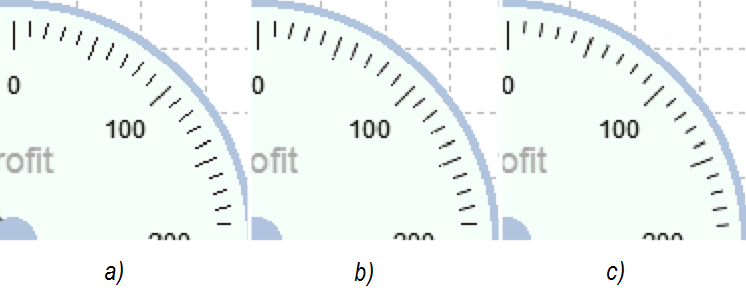
Fig. 11. Various methods of drawing scale marks (increased by 200%)
6.2. Filling an Area with Antialiased Edges
The Fill method is meant for filling an area bounded by segments drawn without use of antialiasing algorithm. If we use this method for filling an area bounded by segments drawn by the LineAA method, the area will be filled incompletely, which is seen in fig.12(a).
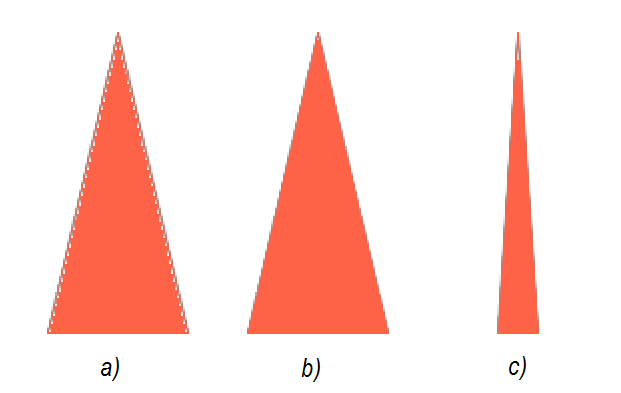
Fig.12. Filling an area with antialiased edges (increased by 200%)
So we have added the Fill2 method. The difference is that it fills not the background color, but any color different from color of segments which bound the area. It allows to fill undertints, which cannot be done using the Fill method. Fig.12(b) depicts an example.
//+------------------------------------------------------------------+
//| Fill closed region with color (v.2)                              |
//+------------------------------------------------------------------+
void CCanvas::Fill2(int x,int y,const uint clr)
  {
//--- check
   if(x<0 || x>=m_width || y<0 || y>=m_height)
      return;
//---
   int  index=y*m_width+x;
   uint old_clr=m_pixels[index];
//--- check if replacement is necessary
   if(old_clr==clr)
      return;
//--- use pseudo stack to emulate deeply-nested recursive calls
   int  stack[];
   uint count=1;
   int  idx;
   int  total=ArraySize(m_pixels);
//--- allocate memory for stack
   if(ArrayResize(stack,total)==-1)
      return;
   stack[0]=index;
   m_pixels[index]=clr;
   for(uint i=0;i<count;i++)
     {
      index=stack[i];
      x=index%m_width;
      //--- left adjacent point
      idx=index-1;
      if(x>0 && m_pixels[idx]!=clr)
        {
         stack[count]=idx;
         if(m_pixels[idx]==old_clr)
            count++;
         m_pixels[idx]=clr;
        }
      //--- top adjacent point
      idx=index-m_width;
      if(idx>=0 && m_pixels[idx]!=clr)
        {
         stack[count]=idx;
         if(m_pixels[idx]==old_clr)
            count++;
         m_pixels[idx]=clr;
        }
      //--- right adjacent point
      idx=index+1;
      if(x<m_width-1 && m_pixels[idx]!=clr)
        {
         stack[count]=idx;
         if(m_pixels[idx]==old_clr)
            count++;
         m_pixels[idx]=clr;
        }
      //--- bottom adjacent point
      idx=index+m_width;
      if(idx<total && m_pixels[idx]!=clr)
        {
         stack[count]=idx;
         if(m_pixels[idx]==old_clr)
            count++;
         m_pixels[idx]=clr;
        }
     }
//--- deallocate memory
   ArrayFree(stack);
  }
Nevertheless, this method also has disadvantages. If there is a small acute angle, its part will remain unfilled, which is shown in fig.12(c). So we have found a way out of this problem.
1) First the whole canvas (needle layer) is filled with color meant for the needle:
n.canvas.Fill(10, 10, ColorToARGB(n.needle.c, n.transparency));
2) Then we draw the needle composed of three segments using the LineAA2 method:
n.canvas.LineAA2(db_xbuf[0], db_ybuf[0], db_xbuf[1], db_ybuf[1], 0);
n.canvas.LineAA2(db_xbuf[1], db_ybuf[1], db_xbuf[2], db_ybuf[2], 0);
n.canvas.LineAA2(db_xbuf[2], db_ybuf[2], db_xbuf[0], db_ybuf[0], 0);
3) After this we fill the area around the needle with transparent color using the Fill2 method:
n.canvas.Fill2(10, 10, 0);
This method is not the best one, but it allows to draw the proper needle.
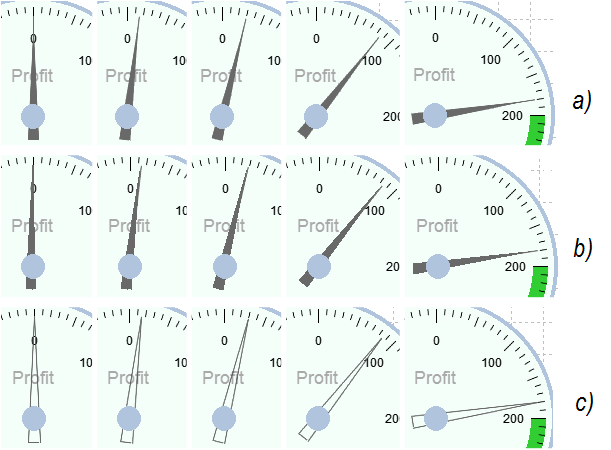
Fig.13. Needles filled using different methods
Fig.13 depicts needles filled using different methods.
- a) The needle composed of three segments drawn using the LineAA2 method and filled using the Fill2 method.
- b) The needle drawn via the FillTriangle method.
- c) The unfilled needle composed of three segments drawn using the LineAA2 method.
As we can see, the needle shown in fig.13(b) is craggy and has small deviation from angles divisible by 90 degrees. Besides, we can see that the needle is shifted from the center which is caused by rounding off values of coordinates when we convert them from polar to rectangular coordinate system. But at the same time this method is the most practical in the context of resource intensity (we will come back to this issue later). The needle shown in fig.13(c) is a trade-off in two methods described above. It is composed of three segments drawn using the LineAA2 method but without area fill.
7. Application Examples
Let's review the application of the gauge library through several examples.
7.1. Indicator of Current Profit
We will start with the simplest one. The following example demonstrates the basic set for adding the gauge to an EA or an indicator.
//+------------------------------------------------------------------+
//|                                       profit_gauge_indicator.mq5 |
//|                                         Copyright 2015, Decanium |
//+------------------------------------------------------------------+
#property copyright "Copyright 2015, Decanium"
#property version   "1.00"
#property indicator_plots 0
#property indicator_chart_window

#include <Gauge\gauge_graph.mqh>

input string inp_gauge_name="gg01";                  // Indicator name
input int inp_x = 40;                                // Horizontal offset
input int inp_y = 40;                                // Vertical offset
input int inp_size=300;                              // Indicator size
input string inp_ObjRel="";                          // Name of the base indicator in case of relative positioning
input ENUM_REL_MODE inp_rel_mode=RELATIVE_MODE_NONE; // Relative positioning mode
input ENUM_BASE_CORNER inp_corner=CORNER_LEFT_UPPER; // Anchor corner
input bool inp_back=false;                           // Indicator is in the background
input uchar inp_scale_transparency=0;                // Scale transparency level, 0..255
input uchar inp_needle_transparency=0;               // Needle transparency level, 0..255

//--- declaration of the gauge structure
GAUGE_STR g0;
//+------------------------------------------------------------------+
//| Custom indicator initialization function                         |
//+------------------------------------------------------------------+
int OnInit()
  {
//--- creating the gauge
   if(GaugeCreate(inp_gauge_name,g0,inp_x,inp_y,inp_size,inp_ObjRel,inp_rel_mode,
      inp_corner,inp_back,inp_scale_transparency,inp_needle_transparency)==false)
      return(INIT_FAILED);
//--- drawing the gauge
   GaugeRedraw(g0);
//---
   return(INIT_SUCCEEDED);
  }
//+------------------------------------------------------------------+
//| Custom indicator deinitialization function                       |
//+------------------------------------------------------------------+
void OnDeinit(const int reason)
  {
//--- deleting the gauge
   GaugeDelete(g0);
   ChartRedraw();
  }
//+------------------------------------------------------------------+
//| Custom indicator iteration function                              |
//+------------------------------------------------------------------+
int OnCalculate(const int rates_total,
                const int prev_calculated,
                const int begin,
                const double &price[])
  {
//--- updating readings
   double profit=AccountInfoDouble(ACCOUNT_PROFIT);
   GaugeNewValue(g0,profit);
//---
   return(rates_total);
  }
//+------------------------------------------------------------------+
//| ChartEvent function                                              |
//+------------------------------------------------------------------+
void OnChartEvent(const int id,
                  const long &lparam,
                  const double &dparam,
                  const string &sparam)
  {
//---
   if(id==CHARTEVENT_CHART_CHANGE)
     {
      if(GaugeCalcLocation(g0)==true)
         GaugeRelocation(g0);
     }
  }
//+------------------------------------------------------------------+
First we need to declare the gauge structure. Then we continue with the initialization function where we create the gauge using the GaugeCreate() function and call the drawing function — GaugeRedraw(). GaugeNewValue() can be used to update readings. In this example, it is called from the OnCalculate() handler.
The gauge will look as shown in fig.14.
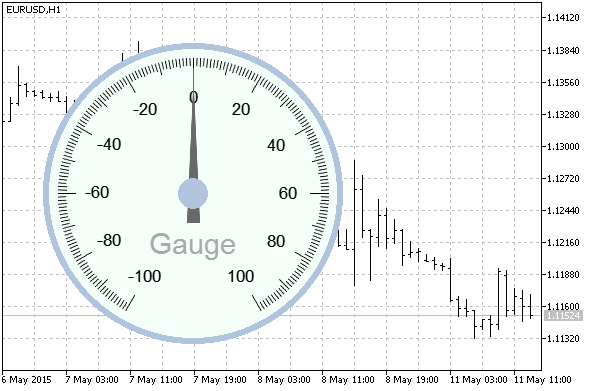
Fig.14. Default appearance of the gauge
Now we will add ability to set the scale range and the rotation angle. It will add two parameters to the list of inputs.
input int inp_scale_range=270;   // Scale range, 30..320 degrees
input int inp_rotation=45;       // Scale rotation, 0..359 degrees
Now we extent the initialization code with the call of the function for setting scale parameters.
//--- setting parameters of the scale and marks on the scale
   GaugeSetScaleParameters(g0,inp_scale_range,inp_rotation,-200,400,MUL_1,SCALE_INNER,clrBlack);
Complementary to new input parameters we will also set:
- new maximum and minimum values (-200 and 400 respectively)
- multiplier of scale graduation labels (MUL_1)
- scale style (SCALE_INNER — graduation labels are inside)
- color of labels (clrBlack)
As we have changed scale extreme values, it is desirable to correct a step of major marks. The best value is 100, as it excludes text abundance. At that we will place one middle mark between two major ones and 4 minor marks between two middle ones. Thus we will have a minimum step between marks equal to 10.
GaugeSetMarkParameters(g0,MARKS_INNER,SIZE_MIDDLE,100,1,4);
Now we will highlight two data ranges. The range having index 0, which starts with 200 and ends with 400, will be highlighted with the clrLimeGreen color. The range having index 1, which starts with -100 and ends with -200, will be highlighted with the clrCoral color.
//--- highlighting ranges on the scale
   GaugeSetRangeParameters(g0,0,true,200,400,clrLimeGreen);
   GaugeSetRangeParameters(g0,1,true,-100,-200,clrCoral);
Now we are going to set legends. We determine the gauge description, units of measure and the current value with one decimal place. Let's review them one by one.
Gauge description:
GaugeSetLegendParameters(g0,LEGEND_DESCRIPTION,true,"Profit",3,0,14,"Arial",false,false);
Displayed string is "Profit", radius is 3, angle is 0, font is 14 conditional units.
Units of measure:
GaugeSetLegendParameters(g0,LEGEND_UNITS,true,"USD",8,215,10,"Arial",true,false);
Displayed string is "USD", radius is 8, angle is 215, font is 10 conditional units.
Current value:
GaugeSetLegendParameters(g0,LEGEND_VALUE,true,"1",4,225,20,"Arial",true,false);
Here the string "1" means the format of displaying (one decimal place). Coordinates: radius is 4, angle is 255. Font size is 20 conditional units.
Thus, after we have performed some additional settings, the gauge will look as shown in fig.15.
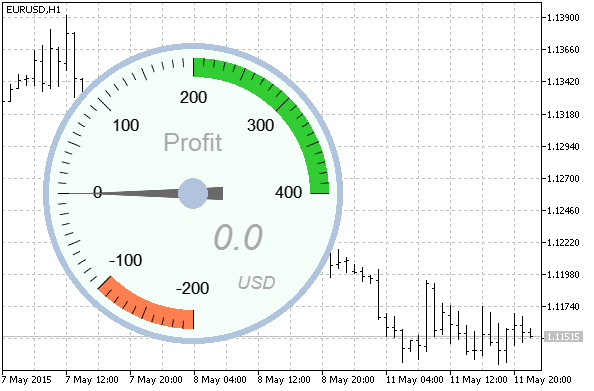
Fig.15. Appearance of the gauge after additional setting
Now we are going to review more complicated example, namely the Dashboard indicator. It is shown in fig.1. The indicator displays the current profit, spread, free margin as percentage and current values of ATR, Force Index and RSI.
First we will declare the gauge structure array.
//--- declaration of the gauge structure array
GAUGE_STR gg[6];
Then we will create and adjust gauges.
The margin level indicator will be placed in the bottom left corner. It will have absolute coordinates, and all other indicators will be located regarding to this indicator or the neighboring one.
//--- building the gg00 gauge, margin level
   if(GaugeCreate("gg00",gg[0],5,-90,240,"",RELATIVE_MODE_NONE,
      CORNER_LEFT_LOWER,inp_back,inp_scale_transparency,inp_needle_transparency)==false)
      return(INIT_FAILED);
//--- setting body parameters
   GaugeSetCaseParameters(gg[0],CASE_SECTOR,DEF_COL_CASE,CASE_BORDER_THIN,DEF_COL_BORDER,SIZE_MIDDLE);
//--- setting parameters of the scale and marks on the scale
   GaugeSetScaleParameters(gg[0],120,35,800,2000,MUL_100,SCALE_INNER,clrBlack);
   GaugeSetMarkParameters(gg[0],MARKS_INNER,SIZE_MIDDLE,200,1,4);
   GaugeSetMarkLabelFont(gg[0],SIZE_MIDDLE,"Arial",false,false,DEF_COL_MARK_FONT);
//--- highlighting ranges on the scale
   GaugeSetRangeParameters(gg[0],0,true,1400,2000,clrLimeGreen);
   GaugeSetRangeParameters(gg[0],1,true,1000,800,clrCoral);
//--- setting text labels
   GaugeSetLegendParameters(gg[0],LEGEND_DESCRIPTION,true,"Margin lvl",4,15,12,"Arial",false,false);
   GaugeSetLegendParameters(gg[0],LEGEND_VALUE,true,"0",3,80,16,"Arial",true,false);
   GaugeSetLegendParameters(gg[0],LEGEND_MUL,true,"",4,55,8,"Arial",true,false);
//--- setting needle parameters
   GaugeSetNeedleParameters(gg[0],NDCS_SMALL,DEF_COL_NCENTER,DEF_COL_NEEDLE,NEEDLE_FILL_AA);
We continue arranging the bottom row. The next is the current profit indicator.
//--- building the gg01 gauge, current profit
   if(GaugeCreate("gg01",gg[1],-80,20,320,"gg00",RELATIVE_MODE_HOR,
      CORNER_LEFT_LOWER,inp_back,inp_scale_transparency,inp_needle_transparency)==false)
      return(INIT_FAILED);
//--- setting body parameters
   GaugeSetCaseParameters(gg[1],CASE_SECTOR,DEF_COL_CASE,CASE_BORDER_THIN,DEF_COL_BORDER,SIZE_MIDDLE);
//--- setting parameters of the scale and marks on the scale
   GaugeSetScaleParameters(gg[1],200,0,-400,400,MUL_1,SCALE_INNER,clrBlack);
   GaugeSetMarkParameters(gg[1],MARKS_INNER,SIZE_MIDDLE,100,1,4);
   GaugeSetMarkLabelFont(gg[1],SIZE_MIDDLE,"Arial",false,false,DEF_COL_MARK_FONT);
//--- highlighting ranges on the scale
   GaugeSetRangeParameters(gg[1],0,true,200,400,clrLimeGreen);
   GaugeSetRangeParameters(gg[1],1,true,-200,-400,clrCoral);
//--- setting text labels
   GaugeSetLegendParameters(gg[1],LEGEND_DESCRIPTION,true,"Profit",3,0,16,"Arial",false,false);
   GaugeSetLegendParameters(gg[1],LEGEND_UNITS,true,"USD",3,-90,10,"Arial",true,false);
   GaugeSetLegendParameters(gg[1],LEGEND_VALUE,true,"1",3,90,12,"Arial",true,false);
//--- setting needle parameters
   GaugeSetNeedleParameters(gg[1],NDCS_SMALL,DEF_COL_NCENTER,DEF_COL_NEEDLE,NEEDLE_FILL_AA);
The spread indicator closes the bottom row.
//--- building the gg02 gauge, spread
   if(GaugeCreate("gg02",gg[2],-80,-20,240,"gg01",RELATIVE_MODE_HOR,
      CORNER_LEFT_LOWER,inp_back,inp_scale_transparency,inp_needle_transparency)==false)
      return(INIT_FAILED);
//--- setting body parameters
   GaugeSetCaseParameters(gg[2],CASE_SECTOR,DEF_COL_CASE,CASE_BORDER_THIN,DEF_COL_BORDER,SIZE_MIDDLE);
//--- setting parameters of the scale and marks on the scale
   GaugeSetScaleParameters(gg[2],120,-35,60,0,MUL_1,SCALE_INNER,clrBlack);
   GaugeSetMarkParameters(gg[2],MARKS_INNER,SIZE_MIDDLE,10,1,4);
   GaugeSetMarkLabelFont(gg[2],SIZE_MIDDLE,"Arial",false,false,DEF_COL_MARK_FONT);
//--- highlighting ranges on the scale
   GaugeSetRangeParameters(gg[2],0,true,35,10,clrLimeGreen);
   GaugeSetRangeParameters(gg[2],1,true,50,60,clrCoral);
//--- setting text labels
   GaugeSetLegendParameters(gg[2],LEGEND_DESCRIPTION,true,"Spread",4,-15,14,"Arial",false,false);
   GaugeSetLegendParameters(gg[2],LEGEND_VALUE,true,"0",3,-80,16,"Arial",true,false);
//--- setting needle parameters
   GaugeSetNeedleParameters(gg[2],NDCS_SMALL,DEF_COL_NCENTER,DEF_COL_NEEDLE,NEEDLE_FILL_AA);
The ATR indicator (the left one in the upper row) is placed relatively to the free margin indicator.
//--- building the gg03 gauge, ATR
   if(GaugeCreate("gg03",gg[3],30,0,180,"gg00",RELATIVE_MODE_VERT,
      CORNER_LEFT_LOWER,inp_back,inp_scale_transparency,inp_needle_transparency)==false)
      return(INIT_FAILED);
//--- setting body parameters
   GaugeSetCaseParameters(gg[3],CASE_ROUND,DEF_COL_CASE,CASE_BORDER_THIN,DEF_COL_BORDER,SIZE_MIDDLE);
//--- setting parameters of the scale and marks on the scale
   GaugeSetScaleParameters(gg[3],270,45,0.001,0.004,MUL_00001,SCALE_INNER,clrBlack);
   GaugeSetMarkParameters(gg[3],MARKS_INNER,SIZE_LARGE,0.001,9,3);
   GaugeSetMarkLabelFont(gg[3],SIZE_LARGE,"Arial",false,false,DEF_COL_MARK_FONT);
//--- highlighting ranges on the scale
   GaugeSetRangeParameters(gg[3],0,true,0.002,0.001,clrYellow);
//--- setting text labels
   GaugeSetLegendParameters(gg[3],LEGEND_DESCRIPTION,true,"ATR",7,-140,26,"Arial",false,false);
//GaugeSetLegendParameters(gg[3],LEGEND_UNITS,true,"USD",8,180,5,"Arial",true,false);
   GaugeSetLegendParameters(gg[3],LEGEND_VALUE,true,"5",2,180,14,"Arial",true,false);
   GaugeSetLegendParameters(gg[3],LEGEND_MUL,true,"",2,0,20,"Arial",true,false);
//--- setting needle parameters
   GaugeSetNeedleParameters(gg[3],NDCS_SMALL,DEF_COL_NCENTER,DEF_COL_NEEDLE,NEEDLE_FILL_AA);
The RSI indicator is placed relatively to the spread indicator (above).
//--- building the gg04 gauge, RSI
   if(GaugeCreate("gg04",gg[4],-30,0,180,"gg02",RELATIVE_MODE_VERT,
      CORNER_LEFT_LOWER,inp_back,inp_scale_transparency,inp_needle_transparency)==false)
      return(INIT_FAILED);
//--- setting body parameters
   GaugeSetCaseParameters(gg[4],CASE_ROUND,DEF_COL_CASE,CASE_BORDER_THIN,DEF_COL_BORDER,SIZE_MIDDLE);
//--- setting parameters of the scale and marks on the scale
   GaugeSetScaleParameters(gg[4],270,45,0,100,MUL_10,SCALE_INNER,clrBlack);
   GaugeSetMarkParameters(gg[4],MARKS_INNER,SIZE_LARGE,10,1,4);
   GaugeSetMarkLabelFont(gg[4],SIZE_LARGE,"Arial",false,false,DEF_COL_MARK_FONT);
//--- setting text labels
   GaugeSetLegendParameters(gg[4],LEGEND_DESCRIPTION,true,"RSI",7,-140,26,"Arial",false,false);
   GaugeSetLegendParameters(gg[4],LEGEND_VALUE,true,"2",2,180,16,"Arial",true,false);
   GaugeSetLegendParameters(gg[4],LEGEND_MUL,true,"",2,0,20,"Arial",true,false);
//--- setting needle parameters
   GaugeSetNeedleParameters(gg[4],NDCS_SMALL,DEF_COL_NCENTER,DEF_COL_NEEDLE,NEEDLE_FILL_AA);
The Force Index indicator is placed above the current profit indicator.
//--- building the gg05 gauge, Force
   if(GaugeCreate("gg05",gg[5],-10,60,180,"gg03",RELATIVE_MODE_HOR,
      CORNER_LEFT_LOWER,inp_back,inp_scale_transparency,inp_needle_transparency)==false)
      return(INIT_FAILED);
//--- setting body parameters
   GaugeSetCaseParameters(gg[5],CASE_ROUND,DEF_COL_CASE,CASE_BORDER_THIN,DEF_COL_BORDER,SIZE_MIDDLE);
//--- setting parameters of the scale and marks on the scale
   GaugeSetScaleParameters(gg[5],270,45,-4,4,MUL_1,SCALE_INNER,clrBlack);
   GaugeSetMarkParameters(gg[5],MARKS_INNER,SIZE_LARGE,1,1,4);
   GaugeSetMarkLabelFont(gg[5],SIZE_LARGE,"Arial",false,false,DEF_COL_MARK_FONT);
//--- highlighting ranges on the scale
   GaugeSetRangeParameters(gg[5],0,true,-1,-4,clrMediumSeaGreen);
   GaugeSetRangeParameters(gg[5],1,true,1,4,clrCrimson);
//--- setting text labels
   GaugeSetLegendParameters(gg[5],LEGEND_DESCRIPTION,true,"Force",7,-140,20,"Arial",false,false);
   GaugeSetLegendParameters(gg[5],LEGEND_VALUE,true,"5",2,180,14,"Arial",true,false);
   GaugeSetLegendParameters(gg[5],LEGEND_MUL,true,"",3,0,10,"Arial",true,false);
//--- setting needle parameters
   GaugeSetNeedleParameters(gg[5],NDCS_SMALL,DEF_COL_NCENTER,DEF_COL_NEEDLE,NEEDLE_FILL_AA);
Gauges can be drawn in a cyclic manner.
//--- drawing gauges
   for(int i=0; i<6;i++)
     {
      GaugeRedraw(gg[i]);
      GaugeNewValue(gg[i],0);
     }
When the OnCalculate() event occurs, we recalculate current values and call the GaugeNewValue() function for each indicator.
//--- updating readings
//--- spread
   GaugeNewValue(gg[2],spread[rates_total-1]);
//--- current profit
   double profit=AccountInfoDouble(ACCOUNT_PROFIT);
   GaugeNewValue(gg[1],profit);
//--- margin level
   double margin_level=AccountInfoDouble(ACCOUNT_MARGIN_LEVEL);
   GaugeNewValue(gg[0],margin_level);
//--- the ATR indicator
   calculated=BarsCalculated(handle_ATR);
   if(calculated>0)
     {
      double ival[1];
      if(CopyBuffer(handle_ATR,0,0,1,ival)<0)
         Print("ATR CopyBuffer error");
      else
         GaugeNewValue(gg[3],ival[0]);
     }
//--- the RSI indicator
   calculated=BarsCalculated(handle_RSI);
   if(calculated>0)
     {
      double ival[1];
      if(CopyBuffer(handle_RSI,0,0,1,ival)<0)
         Print("RSI CopyBuffer error");
      else
         GaugeNewValue(gg[4],ival[0]);
     }
//--- the Force Index indicator
   calculated=BarsCalculated(handle_Force);
   if(calculated>0)
     {
      double ival[1];
      if(CopyBuffer(handle_Force,0,0,1,ival)<0)
         Print("Force Index CopyBuffer error");
      else
         GaugeNewValue(gg[5],ival[0]);
     }
Please note, that there is no point to call GaugeRelocation() from the OnChartEvent() event in the given example. Although relative positioning is used here, we do not need to recalculate coordinates of gauges if position or size of one of them has changed, as gauges are initialized all at once.
8. Resource Intensity Assessment
The needle layer is fully redrawn whenever readings update. It may happen quite often, even several times per second in some instances. That is why the problem of resource intensity of drawing the needle is quite acute. We will write a small script to assess the CPU overhead for drawing the needle using various area fill methods.
//+------------------------------------------------------------------+
//|                                                    test_fill.mq5 |
//|                                         Copyright 2015, Decanium |
//+------------------------------------------------------------------+
#property copyright "Copyright 2015, Decanium"
#property version   "1.00"

#include <Canvas/Canvas2.mqh>

CCanvas canvas;
//+------------------------------------------------------------------+
//| Script program start function                                    |
//+------------------------------------------------------------------+
void OnStart()
  {
   Print("***** start test *****");
//---
   string ObjName="test";
   ObjectDelete(0,ObjName);
   canvas.CreateBitmapLabel(ObjName,10,10,400,400,COLOR_FORMAT_ARGB_NORMALIZE);
//---
   int x[3]={200,185,215};
   int y[3]={70, 250,250};
   int cycles=1000;
   uint col=ColorToARGB(clrRed,255);
   uint c1,c2;
//--- testing the area fill with antialiased edges
   canvas.Erase();
   c1=GetTickCount();
   for(int i=0; i<cycles; i++)
     {
      canvas.Fill(10, 10, col);
      canvas.LineAA2(x[0], y[0], x[1], y[1], 0);
      canvas.LineAA2(x[1], y[1], x[2], y[2], 0);
      canvas.LineAA2(x[2], y[2], x[0], y[0], 0);
      canvas.Fill2(10, 10, 0);
     }
   c2=GetTickCount();
   canvas.Update(true);
   Print("Filled AA: ",c2-c1," ms, ",cycles," cycles, ",
         DoubleToString(double(c2-c1)/double(cycles),2)," ms per cycle");
//--- testing the antialiased contour without filling
   canvas.Erase();
   c1=GetTickCount();
   for(int i=0; i<cycles; i++)
     {
      canvas.LineAA2(x[0], y[0], x[1], y[1], col);
      canvas.LineAA2(x[1], y[1], x[2], y[2], col);
      canvas.LineAA2(x[2], y[2], x[0], y[0], col);
     }
   c2=GetTickCount();
   canvas.Update(true);
   Print("Not filled AA: ",c2-c1," ms, ",cycles," cycles, ",
         DoubleToString(double(c2-c1)/double(cycles),2)," ms per cycle");
//--- testing the area fill without antialiasing
   canvas.Erase();
   c1=GetTickCount();
   for(int i=0; i<cycles; i++)
     {
      canvas.FillTriangle(x[0],y[0],x[1],y[1],x[2],y[2],col);
      canvas.LineAA2(x[0], y[0], (x[1]+x[2])/2, y[1], col);
     }
   c2=GetTickCount();
   canvas.Update(true);
   Print("Filled: ",c2-c1," ms, ",cycles," cycles, ",
         DoubleToString(double(c2-c1)/double(cycles),2)," ms per cycle");
  }
//+------------------------------------------------------------------+
The script launches each method of drawing the needle 1000 times in a cycle and measures the time spent for this process in milliseconds.

Fig.16. Results of the resource intensity test
As you can see by the results, the filled needle with antialiased edges is drawn hundreds of times longer than the filled needle without antialiasing and tens of times longer than just an antialiased contour line without filling. In this case, beauty really has its price.
Conclusion
In this article, we have reviewed the set of functions for drawing gauges. The main target of the library creation was the simplicity of adding gauges to an EA or an indicator without delving into the details of drawing and geometry. Though, it's up to you to decide whether we have reached this target.
Special attention should be paid to the resource intensity. Time-consuming computations in the OnCalculate() handler can cause the terminal suspension. So we recommend applying the compromise method of drawing the needle (antialiasing without filling).
Translated from Russian by MetaQuotes Ltd.
Original article: https://www.mql5.com/ru/articles/1699
Warning: All rights to these materials are reserved by MetaQuotes Ltd. Copying or reprinting of these materials in whole or in part is prohibited.
This article was written by a user of the site and reflects their personal views. MetaQuotes Ltd is not responsible for the accuracy of the information presented, nor for any consequences resulting from the use of the solutions, strategies or recommendations described.
 Managing the MetaTrader Terminal via DLL
 Statistical Verification of the Labouchere Money Management System
 Price Action. Automating the Inside Bar Trading Strategy
- Free trading apps
- Over 8,000 signals for copying
- Economic news for exploring financial markets
You agree to website policy and terms of use
Hi
can you create this indicator for me? (for mt5)
for display price position in daily price limit.
max daily limit and min daily limit set by user.
In case anyone is having trouble figuring out how to specify a decimal for the main value, here's the function:
"1" is the number of decimal places.
And the value itself is specified through the function:
in case someone is looking for an updatet version, see enclosed its fully compatible mql5 ccanvas ( 2025 )
@Serhii Shevchuk may be you can update your article with it ( i replace all your variable declaration such a s by sls which avoid global declaration of s in other libraries)