
LifeHack for Traders: Indicators of Balance, Drawdown, Load and Ticks during Testing

Table of Contents
- Introduction
- 1. The LifeHack Ticks indicator
- 2. The LifeHack Balance Equity indicator
- 3. The LifeHack Drawdown Load indicator
- Conclusion
Introduction
You may run visual testing in the MetaTrader 5 Strategy Tester for different purposes. For example, sometimes you may want to see how the balance and equity of a trading account were changing during testing. Sometimes, you may need to visually monitor the possibility of trend emergence while testing in the "Every tick based on real ticks" mode. It means a separate LifeHack indicator is required in each case. We will run different indicators in the MetaTrader 5 Strategy Tester, while saving the chart template as tester.tpl (the template of a chart, on which testing results are displayed).
The common rules for the use of indicators in the tester:
- Run one of the LifeHack indicators on the chart.
- Save the template as tester.tpl.
- Start visual testing.
There is another way to save the template — by running the following script:
//+------------------------------------------------------------------+
//|                                  ChartSaveTemplateTester_tpl.mq5 |
//|                              Copyright © 2016, Vladimir Karputov |
//|                                           http://wmua.ru/slesar/ |
//+------------------------------------------------------------------+
#property copyright "Copyright © 2016, Vladimir Karputov"
#property link      "http://wmua.ru/slesar/"
#property version   "1.00"
//+------------------------------------------------------------------+
//| Script program start function                                    |
//+------------------------------------------------------------------+
void OnStart()
  {
   ResetLastError();
//--- save the current chart in a template
   if(!ChartSaveTemplate(0,"tester"))
      MessageBox("Error SaveTemplate #"+IntegerToString(GetLastError()));
   else
      MessageBox("Template \"tester.tpl\" overwritten!");
  }
//+------------------------------------------------------------------+
In this script, the template name "tester" is hard coded, because the script is highly specialized. You can also assign a hot key for the script:
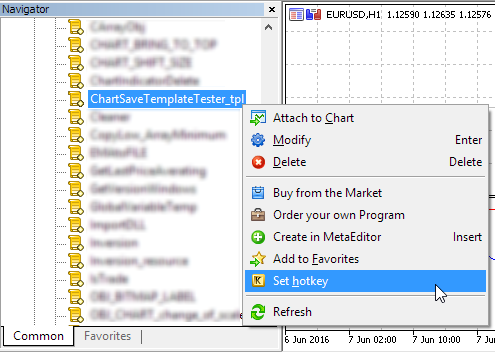
Fig. 1. Assigning a hot key
The LifeHack Ticks indicator
The indicator of ticks LifeHack Ticks shows the last 300 ticks:
//--- indicator buffers
double         AskBuffer[];
double         BidBuffer[];
double         AskBufferTemp[];
double         BidBufferTemp[];
//--- parameters
int            InpVisible=300;
//+------------------------------------------------------------------+
//| Custom indicator initialization function                         |
//+------------------------------------------------------------------+
int OnInit()
You can change the InpVisible parameter. However, I would not recommend using a value greater than 1000, because this would cause an unnecessary load on the terminal.
By the way, the indicator also shows the difference between the real and emulate ticks:

Fig. 2. "Every tick based on real ticks"

Fig. 3. "Every tick"
The below video demonstrates the difference between the two types of tick generation:
Also, the LifeHack Ticks indicator shows the time of the last tick in its subwindow. This makes it possible to jump to the desired date and view appropriate ticks in the step-by-step mode in the Strategy Tester.
For example, you may want to view testing on ticks starting with 2016.06.03 15:00 on the chart of EURUSDH1:

Fig. 4. Analyzing ticks from 2016.06.03 15:00
Procedure:
1. Run the LifeHack Ticks indicator and save the chart template as tester.tpl. Right click on the chart and select "Templates - "Save Template...". In the Explorer, select the template tester.tpl (if there is no such template, then you should type this name) and click "Save":
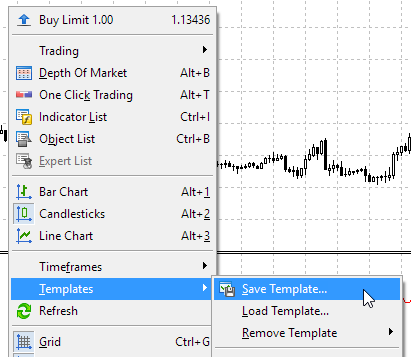
Fig. 5. Saving the chart template
2. In the MetaTrader 5 Strategy Tester, specify the time interval so that it includes 2016.06.03, select EURUSD, choose testing timeframe H1 and testing type "Every tick based on real ticks":
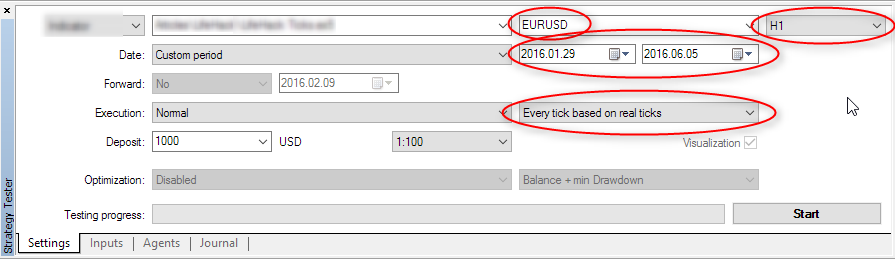
Fig. 6. Testing.
3. Start visual testing.
4. In the tester, click on "Pause Visualization, Space" (①), in the "Skip to" field specify 2016.06.03 14:59 (②), and then switch ticks in the step-by-step mode (③):
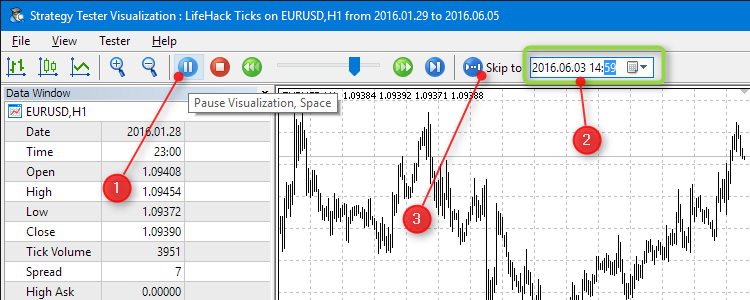
Fig. 7. Jump to the desired date
or start testing at a low speed.
The LifeHack Balance Equity indicator
The LifeHack Balance Equity indicator visualizes how the trade account balance and equity are changing.

Fig. 8. The LifeHack Balance Equity indicator
The LifeHack Drawdown Load indicator
The LifeHack Drawdown Load indicator allows you to review the drawdown and the deposit load during the visual testing process. The drawdown is calculated by the following formula:
drawdown=(balance-equity)/balance*100.0
Running both LifeHack Drawdown Load and LifeHack Balance Equity in the MetaTrader 5 Strategy Tester:

Fig. 9. The LifeHack Drawdown Load indicator
For convenience, the types of drawing (line and histogram) are added to the indicator label names. Another important moment: labels "Drawdown (line)" and "Load (histogram)" preserve their highest value on the current bar. That is, if the maximum deposit load on the current bar was 80%, and then it fell to 10%, the label of "Load (histogram)" would still show the maximum value of 80%.
Conclusion
I hope that the approach of creating the tester.tpl template with the required indicators of the LifeHack series will allow you to visually detect the strengths and weaknesses of the applications that you test.
Translated from Russian by MetaQuotes Ltd.
Original article: https://www.mql5.com/ru/articles/2501
Warning: All rights to these materials are reserved by MetaQuotes Ltd. Copying or reprinting of these materials in whole or in part is prohibited.
This article was written by a user of the site and reflects their personal views. MetaQuotes Ltd is not responsible for the accuracy of the information presented, nor for any consequences resulting from the use of the solutions, strategies or recommendations described.

 The checks a trading robot must pass before publication in the Market
 Universal Expert Advisor: Integration with Standard MetaTrader Modules of Signals (Part 7)
 Working with sockets in MQL, or How to become a signal provider
- Free trading apps
- Over 8,000 signals for copying
- Economic news for exploring financial markets
You agree to website policy and terms of use
tester.tpl
It says in the article.
Are you sure you first sketch LifeHack-series indicators on the chart, and then save the template?
The general recipe for using indicators in the tester:
In general, give screenshots, in detail, what you do....