
Creating an Indicator with Graphical Control Options

Introduction
Those who are familiar with the market sentiments, know the MACD indicator (its full name the Convergence Divergence Moving Averages), as a powerful tool for a price movement analysis that is used by traders since the first moments of the appearance of computer analysis methods.
For a long time I have studied the MACD indicator that won its place in the chart. I have seen many different types of this indicator with different options and different calculating algorithms, so I have decided to combine all types I know in one indicator.
Types of MACD indicator
The indicator will have the conventional MACD lines and oSMA histogram. Let's define the main modifications of MACD:- Elder's MACD, also known as an Impulse System;
- Elder's MACD without checking by the moving line;
- The oSMA, plotted with different colors for growing and falling cases;
- Only oSMA-histogram is plotted;
- Only MACD lines are plotted;
Initial Settings of the Indicator
We will need the following parameters for the calculation:
- The value of a fast MACD line;
- The value of a slow MACD line;
- The value of a signal MACD line;
- The value of Trend Verification line by the Elder's method;
To plot this indicator, we will need the following:
- The MACD-line;
- The signal line;
- The 3-color OSMA histogram.
Go to the menu of MQL5 Wizard:

Figure 1. Creation of the indicator using the MQL5 Wizard

Figure 2. Defining common indicator parameters in the MQL5 Wizard

Figure 3. Defining the drawing properties of the indicator in the MQL5 Wizard
Creating an Indicator
We've got an initial template of the indicator. First, we need to calculate the MACD line of our indicator.
We will not dive deep into the exact formula for the calculation of this line - we will use the iMACD function:
int iMACD (
   string symbol,           // symbol name
   ENUM_TIMEFRAMES period,   // time period
   int fast_ema_period,    // fast averaging period
   int slow_ema_period,    // slow averaging period
   int signal_period,      // averaging period of a signal line
   ENUM_APPLIED_PRICE applied_price // type of price or a handle
   )
This function returns a handle of the appropriate copy of the indicator. Using this handle, it's possible to get the data, calculated by this indicator. The data from an indicator buffer (technical indicators contain the calculated data in their own internal buffers, that can be up to 5, depending on the indicator), can be copied using function CopyBuffer().
Next, we generate a request for MACD data using function iMACD:
int MACDhadling = iMACD(NULL,0,Fast,Slow,Signal,PRICE_CLOSE);
It will return us a handle of the indicator copy.
Copy the data into the necessary buffer through the function CopyBuffer :
int  CopyBuffer(
   int       indicator_handle,     // indicator's handle
   int       buffer_num,           // buffer number of the indicator
   int       start_pos,            // start position
   int       count,                // number of data to copy
   double    buffer[]              // target array for the data to copy
   );
Now let's request the MACD line of the indicator:
CopyBuffer(MACDhadling,0,0,NewData,MACDlineBuffer);
We obtain the signal line of the indicator:
CopyBuffer(MACDhadling,1,0,NewData,SignallineBuffer);
Let's gather it all an see what we have got:
int MACDhadling=iMACD(NULL,0,Fast,Slow,Signal,PRICE_CLOSE);
CopyBuffer(MACDhadling,0,0,rates_total,MACDlineBuffer);
CopyBuffer(MACDhadling,1,0,rates_total,SignallineBuffer);
Now we have the calculated MACD and signal lines.
Let's continue.
Because of the fact that the data from the
MACDlineBuffer
and
SignallineBuffer
buffers has been obtained by copying, their indexing is from the end of the chart.
Historically, an access to the data of the price array is performed from the end of the data. Physically, the new data are always written at the end of the array, but the index of the current (uncompleted) bar is always equal to zero. The index equal to 0 in the timeseries array means the data of the current bar, that corresponds to the uncompleted time interval of this timeframe.
In order to use the same indexing direction in the all buffers, we should define the other buffers as timeseries.
ArraySetAsSeries(HistogramBuffer,false);
ArraySetAsSeries(HistogramColors,false);
We need to get the data of a histogram, it's calculated using the subtraction of the signal line from the MACD line:
for(int i=0;i<rates_total;i++)
  {
   HistogramBuffer[i]=MACDlineBuffer[i]-SignallineBuffer[i];
  }
Let's combine all together:
ArraySetAsSeries(HistogramBuffer,false);
ArraySetAsSeries(HistogramColors,false);

int MACDhadling=iMACD(NULL,0,Fast,Slow,Signal,PRICE_CLOSE);
CopyBuffer(MACDhadling,0,0,rates_total,MACDlineBuffer);
CopyBuffer(MACDhadling,1,0,rates_total,SignallineBuffer);

for(int i=0;i<rates_total;i++)
  {
   HistogramBuffer[i]=MACDlineBuffer[i]-SignallineBuffer[i];
   HistogramColors[i]=1;
  }
Creating a Graphic System of the Indicator Control
We have 5 varieties of this indicator.
First, we implement the items №3 and №4.
3. Only oSMA-histogram is plotted;
4. Only the MACD lines are plotted.
Let's create the appropriate buttons.
For item 4:
ObjectCreate(0,"ShowMACD",OBJ_BUTTON,ChartWindowFind(),100,100);   //creating the button
ObjectSetInteger(0,"ShowMACD",OBJPROP_XDISTANCE,75);              //assign the coordinates
ObjectSetInteger(0,"ShowMACD",OBJPROP_YDISTANCE,5);
ObjectSetInteger(0,"ShowMACD",OBJPROP_CORNER,CORNER_RIGHT_UPPER);  // and an anchor point
ObjectSetString(0,"ShowMACD",OBJPROP_TEXT,"ShowMACD");            // button label
ObjectSetInteger(0,"ShowMACD",OBJPROP_FONTSIZE,8);
ObjectSetInteger(0,"ShowMACD",OBJPROP_XSIZE,70);                 // size of buttons
ObjectSetInteger(0,"ShowMACD",OBJPROP_YSIZE,20);
ObjectSetInteger(0,"ShowMACD",OBJPROP_SELECTABLE,false);         // to make it selectable
For a case of the accidental button deletion or its shift at next tick, the button will return back.
For the item №3:
ObjectCreate(0,"ShowOsMA",OBJ_BUTTON,ChartWindowFind(),100,100);
ObjectSetInteger(0,"ShowOsMA",OBJPROP_XDISTANCE,75);
ObjectSetInteger(0,"ShowOsMA",OBJPROP_YDISTANCE,30);
ObjectSetInteger(0,"ShowOsMA",OBJPROP_CORNER,CORNER_RIGHT_UPPER);
ObjectSetString (0,"ShowOsMA",OBJPROP_TEXT,"Show OsMA");
ObjectSetInteger(0,"ShowOsMA",OBJPROP_FONTSIZE,8);
ObjectSetInteger(0,"ShowOsMA",OBJPROP_XSIZE,70);
ObjectSetInteger(0,"ShowOsMA",OBJPROP_YSIZE,20);
ObjectSetInteger(0,"ShowOsMA",OBJPROP_SELECTABLE,false);
Let's create the implementation for the case of pressed and unpressed button for condition 4.
This requires viewing the buffer indexes.
SetIndexBuffer(0,MACDlineBuffer,INDICATOR_DATA);
SetIndexBuffer(1,SignallineBuffer,INDICATOR_DATA);
SetIndexBuffer(2,HistogramBuffer,INDICATOR_DATA);
SetIndexBuffer(3,HistogramColors,INDICATOR_COLOR_INDEX);
if(ObjectGetInteger(0,"ShowMACD",OBJPROP_STATE)!=1)
  {
   PlotIndexSetInteger(0,PLOT_DRAW_TYPE,DRAW_NONE); // the buffer with index 0 isn't plotted
   PlotIndexSetInteger(1,PLOT_DRAW_TYPE,DRAW_NONE); // the buffer with index 1 isn't plotted
  }
else
  {
   PlotIndexSetInteger(0,PLOT_DRAW_TYPE,DRAW_LINE); // the buffer with index 0 is plotted as line
   PlotIndexSetInteger(1,PLOT_DRAW_TYPE,DRAW_LINE); // the buffer with index 1 is plotted as line
  }
MACD lines are plotted of the button is pressed, and aren't plotted it its is not.
Let's create the implementation for the case of the pressed and not pressed button for condition 3.
if(ObjectGetInteger(0,"ShowOsMA",OBJPROP_STATE)!=1)
  {
   //the buffer with index 2 isn't plotted
   PlotIndexSetInteger(2,PLOT_DRAW_TYPE,DRAW_NONE);
  }
else
  {
   //the buffer with index 2 is plotted as a color histogram
   PlotIndexSetInteger(2,PLOT_DRAW_TYPE,DRAW_COLOR_HISTOGRAM);
  }
Let's create two buttons: "2color" and "Impulse" and locate them in the right bottom corner of the chart.
ObjectCreate(0,"2color",OBJ_BUTTON,ChartWindowFind(),100,100);
ObjectSetInteger(0,"2color",OBJPROP_XDISTANCE,75);
ObjectSetInteger(0,"2color",OBJPROP_YDISTANCE,50);
ObjectSetInteger(0,"2color",OBJPROP_CORNER,CORNER_RIGHT_LOWER);
ObjectSetInteger(0,"2color",OBJPROP_FONTSIZE,8);
ObjectSetInteger(0,"2color",OBJPROP_XSIZE,70);
ObjectSetInteger(0,"2color",OBJPROP_YSIZE,20);
ObjectSetInteger(0,"2color",OBJPROP_SELECTABLE,false);
ObjectSetString (0,"2color",OBJPROP_TEXT,"MultiColor");

ObjectCreate(0,"Impulse",OBJ_BUTTON,ChartWindowFind(),100,100);
ObjectSetInteger(0,"Impulse",OBJPROP_XDISTANCE,75);
ObjectSetInteger(0,"Impulse",OBJPROP_YDISTANCE,25);
ObjectSetInteger(0,"Impulse",OBJPROP_CORNER,CORNER_RIGHT_LOWER);
ObjectSetInteger(0,"Impulse",OBJPROP_FONTSIZE,8);
ObjectSetInteger(0,"Impulse",OBJPROP_XSIZE,70);
ObjectSetInteger(0,"Impulse",OBJPROP_YSIZE,20);
ObjectSetInteger(0,"Impulse",OBJPROP_SELECTABLE,false);
For the Impuse checking according to the Elder system, we have to add a new array where EldersMA values will be located.
To do it, we have to increase the total number of buffers by one.+
#property indicator_buffers 4should be changed to:
#property indicator_buffers 5and we declare a new buffer.
double EldersiEMA[];
We define it as a buffer for internal calculations:
SetIndexBuffer(4,EldersiEMA,INDICATOR_CALCULATIONS);
Now let's copy the exponential moving average values to the buffer:
// you can do all in single line
CopyBuffer(iMA(NULL,0,EldersEMA,0,MODE_EMA,PRICE_CLOSE),0,0,rates_total,EldersiEMA);
Since the buffer has been obtained by the copy function, its indexing is the same as for the other buffers of our chart - from the chart ent.
Now let's write down the conditions for the 2-color OsMA:
if (ObjectGetInteger(0,"2color",OBJPROP_STATE))
  {
   for(int i=1;i<rates_total;i++)
     {
      // if the histogram rises, the color is set to 0
      if(HistogramBuffer[i] > HistogramBuffer[i-1]) HistogramColors[i]=0;
      // if the histogram falls, the color is set to 1
      if(HistogramBuffer[i] < HistogramBuffer[i-1]) HistogramColors[i]=1;
     }
  }
else
  {
   ObjectSetString(0,"2color",OBJPROP_TEXT,"MultiColor");
   // Here are the conditions for multi-color OSMA
  }
The color indexes are specified in the lines:
#property indicator_label3  "Histogram"
#property indicator_type3   DRAW_COLOR_HISTOGRAM
#property indicator_color3  DeepSkyBlue,Red,Green
The index of the first color is equal to 0, the index of the second is 1, and so on.
Now let's write down the conditions for the variations of the Impulse System:
if (ObjectGetInteger(0,"Impulse",OBJPROP_STATE)) // // "Impulse" button is checked
  {
   ObjectSetString(0,"Impulse",OBJPROP_TEXT,"Impulse");  // checking for a trend using the MACD-Line
   for(int i=1;i<rates_total;i++)
     {
      // the histogram rises and MACD-line rises
      if((HistogramBuffer[i]>HistogramBuffer[i-1]) && (MACDlineBuffer[i]>MACDlineBuffer[i-1])) HistogramColors[i]=0;
      else
        {
         // the histogram falls and MACD-line falls
         if((HistogramBuffer[i]<HistogramBuffer[i-1]) && (MACDlineBuffer[i]<MACDlineBuffer[i-1])) HistogramColors[i]=1;
         else HistogramColors[i]=2; // if there isn't any conditions satisfied
        }
     }
  }
else
  {
   ObjectSetString(0,"Impulse",OBJPROP_TEXT,"Elder's");  // checking for a trend using the EMA-line
   for(int i=1;i<rates_total;i++)
     {
      // the histogram rises and EMA-line rises
      if((HistogramBuffer[i]>HistogramBuffer[i-1]) && (EldersiEMA[i]>EldersiEMA[i-1])) HistogramColors[i]=0;
      else
        {
         // the histogram falls and EMA-line falls
         if((HistogramBuffer[i]<HistogramBuffer[i-1]) && (EldersiEMA[i]<EldersiEMA[i-1])) HistogramColors[i]=1;
         else HistogramColors[i]=2;// if there isn't any conditions satisfied
        }
     }
  }
Now let's add the Impulse System conditions to the OsMA plotting conditions:
if (ObjectGetInteger(0,"2color",OBJPROP_STATE))
  {
   for(int i=1;i<rates_total;i++)
     {
      if(HistogramBuffer[i] > HistogramBuffer[i-1]) HistogramColors[i]=0;
      if(HistogramBuffer[i] < HistogramBuffer[i-1]) HistogramColors[i]=1;
     }
  }
else
  {
   ObjectSetString(0,"2color",OBJPROP_TEXT,"MultiColor");
   if(ObjectGetInteger(0,"Impulse",OBJPROP_STATE))
     {
      ObjectSetString(0,"Impulse",OBJPROP_TEXT,"Impulse");
      for(int i=1;i<rates_total;i++)
        {
         if((HistogramBuffer[i]>HistogramBuffer[i-1]) && (MACDlineBuffer[i]>MACDlineBuffer[i-1])) HistogramColors[i]=0;
         else
           {
            if((HistogramBuffer[i]<HistogramBuffer[i-1]) && (MACDlineBuffer[i]<MACDlineBuffer[i-1])) HistogramColors[i]=1;
            else HistogramColors[i]=2;
           }
        }
     }
   else
     {
      ObjectSetString(0,"Impulse",OBJPROP_TEXT,"Elder's");
      for(int i=1;i<rates_total;i++)
        {
         if((HistogramBuffer[i]>HistogramBuffer[i-1]) && (EldersiEMA[i]>EldersiEMA[i-1])) HistogramColors[i]=0;
         else
           {
            if((HistogramBuffer[i]<HistogramBuffer[i-1]) && (EldersiEMA[i]<EldersiEMA[i-1])) HistogramColors[i]=1;
            else HistogramColors[i]=2;
           }
        }
     }
  }
Now, let's write conditions to prevent the unnecessary button flashes:
if (ObjectGetInteger(0,"2color",OBJPROP_STATE)) ObjectSetString (0,"2color",OBJPROP_TEXT,"2ColorMACD");
else ObjectSetString(0,"2color",OBJPROP_TEXT,"MultiColor");
if (ObjectGetInteger(0,"Impulse",OBJPROP_STATE)) ObjectSetString (0,"Impulse",OBJPROP_TEXT,"Impulse");
else ObjectSetString(0,"Impulse",OBJPROP_TEXT,"Elder's")
we delete the code, that changes the text of a button.
Combining all together:
//+------------------------------------------------------------------+
//|                                            MACD_By_CoreWinTT.mq5 |
//|                        Copyright 2010, MetaQuotes Software Corp. |
//|                                              http://www.mql5.com |
//+------------------------------------------------------------------+
#property copyright "2010, MetaQuotes Software Corp."
#property link      "http://www.mql5.com"
#property version   "1.00"
#property indicator_separate_window
#property indicator_buffers 5
#property indicator_plots   3
//---- plot MACDline
#property indicator_label1  "MACDline"
#property indicator_type1   DRAW_LINE
#property indicator_color1  Green
#property indicator_style1  STYLE_SOLID
#property indicator_width1  1
//---- plot Signalline
#property indicator_label2  "Signalline"
#property indicator_type2   DRAW_LINE
#property indicator_color2  Red
#property indicator_style2  STYLE_SOLID
#property indicator_width2  1
//---- plot Histogram
#property indicator_label3  "Histogram"
#property indicator_type3   DRAW_COLOR_HISTOGRAM
#property indicator_color3  DeepSkyBlue,Red,Green
#property indicator_style3  STYLE_SOLID
#property indicator_width3  2

//--- input parameters
input int      Fast=12;
input int      Slow=26;
input int      Signal=9;
input int      EldersEMA=13;
//--- indicator buffers
double         MACDlineBuffer[];
double         SignallineBuffer[];
double         HistogramBuffer[];
double         HistogramColors[];
double         EldersiEMA[];
//+------------------------------------------------------------------+
//| Custom indicator initialization function                         |
//+------------------------------------------------------------------+
int OnInit()
  {
//--- indicator buffers mapping
   SetIndexBuffer(0,MACDlineBuffer,INDICATOR_DATA);
   SetIndexBuffer(1,SignallineBuffer,INDICATOR_DATA);
   SetIndexBuffer(2,HistogramBuffer,INDICATOR_DATA);
   SetIndexBuffer(3,HistogramColors,INDICATOR_COLOR_INDEX);
   SetIndexBuffer(4,EldersiEMA,INDICATOR_CALCULATIONS);
//---
   return(0);
  }
//+------------------------------------------------------------------+
//| Custom indicator iteration function                              |
//+------------------------------------------------------------------+
int OnCalculate(const int rates_total,
                const int prev_calculated,
                const datetime &time[],
                const double &open[],
                const double &high[],
                const double &low[],
                const double &close[],
                const long &tick_volume[],
                const long &volume[],
                const int &spread[])
  {
   ArraySetAsSeries(HistogramBuffer,false);
   ArraySetAsSeries(HistogramColors,false);

   int MACDhadling=iMACD(NULL,0,Fast,Slow,Signal,PRICE_CLOSE);
   CopyBuffer(MACDhadling,0,0,rates_total,MACDlineBuffer);
   CopyBuffer(MACDhadling,1,0,rates_total,SignallineBuffer);

   for(int i=0;i<rates_total;i++) { HistogramBuffer[i]=MACDlineBuffer[i]-SignallineBuffer[i];HistogramColors[i]=1; }

   ObjectCreate(0,"ShowMACD",OBJ_BUTTON,ChartWindowFind(),100,100);
   ObjectSetInteger(0,"ShowMACD",OBJPROP_XDISTANCE,75);
   ObjectSetInteger(0,"ShowMACD",OBJPROP_YDISTANCE,5);
   ObjectSetInteger(0,"ShowMACD",OBJPROP_CORNER,CORNER_RIGHT_UPPER);
   ObjectSetString(0,"ShowMACD",OBJPROP_TEXT,"ShowMACD");
   ObjectSetInteger(0,"ShowMACD",OBJPROP_FONTSIZE,8);
   ObjectSetInteger(0,"ShowMACD",OBJPROP_XSIZE,70);
   ObjectSetInteger(0,"ShowMACD",OBJPROP_YSIZE,20);
   ObjectSetInteger(0,"ShowMACD",OBJPROP_SELECTABLE,false);

   ObjectCreate(0,"ShowOsMA",OBJ_BUTTON,ChartWindowFind(),100,100);
   ObjectSetInteger(0,"ShowOsMA",OBJPROP_XDISTANCE,75);
   ObjectSetInteger(0,"ShowOsMA",OBJPROP_YDISTANCE,30);
   ObjectSetInteger(0,"ShowOsMA",OBJPROP_CORNER,CORNER_RIGHT_UPPER);
   ObjectSetString(0,"ShowOsMA",OBJPROP_TEXT,"Show OsMA");
   ObjectSetInteger(0,"ShowOsMA",OBJPROP_FONTSIZE,8);
   ObjectSetInteger(0,"ShowOsMA",OBJPROP_XSIZE,70);
   ObjectSetInteger(0,"ShowOsMA",OBJPROP_YSIZE,20);
   ObjectSetInteger(0,"ShowOsMA",OBJPROP_SELECTABLE,false);

   if(ObjectGetInteger(0,"ShowMACD",OBJPROP_STATE)!=1)
     {
      PlotIndexSetInteger(0,PLOT_DRAW_TYPE,DRAW_NONE);
      PlotIndexSetInteger(1,PLOT_DRAW_TYPE,DRAW_NONE);
     }
   else
     {
      PlotIndexSetInteger(0,PLOT_DRAW_TYPE,DRAW_LINE);
      PlotIndexSetInteger(1,PLOT_DRAW_TYPE,DRAW_LINE);
     }

   if(ObjectGetInteger(0,"ShowOsMA",OBJPROP_STATE)!=1)
     {
      PlotIndexSetInteger(2,PLOT_DRAW_TYPE,DRAW_NONE);
     }
   else
     {
      PlotIndexSetInteger(2,PLOT_DRAW_TYPE,DRAW_COLOR_HISTOGRAM);
     }

   ObjectCreate(0,"2color",OBJ_BUTTON,ChartWindowFind(),100,100);
   ObjectSetInteger(0,"2color",OBJPROP_XDISTANCE,75);
   ObjectSetInteger(0,"2color",OBJPROP_YDISTANCE,50);
   ObjectSetInteger(0,"2color",OBJPROP_CORNER,CORNER_RIGHT_LOWER);
   ObjectSetInteger(0,"2color",OBJPROP_FONTSIZE,8);
   ObjectSetInteger(0,"2color",OBJPROP_XSIZE,70);
   ObjectSetInteger(0,"2color",OBJPROP_YSIZE,20);
   ObjectSetInteger(0,"2color",OBJPROP_SELECTABLE,false);
   ObjectSetString(0,"2color",OBJPROP_TEXT,"MultiColor");

   ObjectCreate(0,"Impulse",OBJ_BUTTON,ChartWindowFind(),100,100);
   ObjectSetInteger(0,"Impulse",OBJPROP_XDISTANCE,75);
   ObjectSetInteger(0,"Impulse",OBJPROP_YDISTANCE,25);
   ObjectSetInteger(0,"Impulse",OBJPROP_CORNER,CORNER_RIGHT_LOWER);
   ObjectSetInteger(0,"Impulse",OBJPROP_FONTSIZE,8);
   ObjectSetInteger(0,"Impulse",OBJPROP_XSIZE,70);
   ObjectSetInteger(0,"Impulse",OBJPROP_YSIZE,20);
   ObjectSetInteger(0,"Impulse",OBJPROP_SELECTABLE,false);
   ObjectSetString(0,"Impulse",OBJPROP_TEXT,"Impulse");

   if(ObjectGetInteger(0,"2color",OBJPROP_STATE)) ObjectSetString(0,"2color",OBJPROP_TEXT,"2ColorMACD");
   else ObjectSetString(0,"2color",OBJPROP_TEXT,"MultiColor");
   if(ObjectGetInteger(0,"Impulse",OBJPROP_STATE)) ObjectSetString(0,"Impulse",OBJPROP_TEXT,"Impulse");
   else ObjectSetString(0,"Impulse",OBJPROP_TEXT,"Elder's");

   CopyBuffer(iMA(NULL,0,EldersEMA,0,MODE_EMA,PRICE_CLOSE),0,0,rates_total,EldersiEMA);

   if(ObjectGetInteger(0,"2color",OBJPROP_STATE))
     {
      for(int i=1;i<rates_total;i++)
        {
         if(HistogramBuffer[i] > HistogramBuffer[i-1]) HistogramColors[i]=0;
         if(HistogramBuffer[i] < HistogramBuffer[i-1]) HistogramColors[i]=1;
        }
     }
   else
     {
      if(ObjectGetInteger(0,"Impulse",OBJPROP_STATE))
        {
         for(int i=1;i<rates_total;i++)
           {
            if((HistogramBuffer[i]>HistogramBuffer[i-1]) && (MACDlineBuffer[i]>MACDlineBuffer[i-1])) HistogramColors[i]=0;
            else
              {
               if((HistogramBuffer[i]<HistogramBuffer[i-1]) && (MACDlineBuffer[i]<MACDlineBuffer[i-1])) HistogramColors[i]=1;
               else HistogramColors[i]=2;
              }
           }
        }
      else
        {
         for(int i=1;i<rates_total;i++)
           {
            if((HistogramBuffer[i]>HistogramBuffer[i-1]) && (EldersiEMA[i]>EldersiEMA[i-1])) HistogramColors[i]=0;
            else
              {
               if((HistogramBuffer[i]<HistogramBuffer[i-1]) && (EldersiEMA[i]<EldersiEMA[i-1])) HistogramColors[i]=1;
               else HistogramColors[i]=2;
              }
           }

        }
     }

//--- return value of prev_calculated for next call
   return(rates_total);
  }
//+------------------------------------------------------------------+
The block diagram of the algorithm is shown in Figure 4:

Figure 4. The block diagram of the indicator algorithm
The result is shown in Figures 5-7.
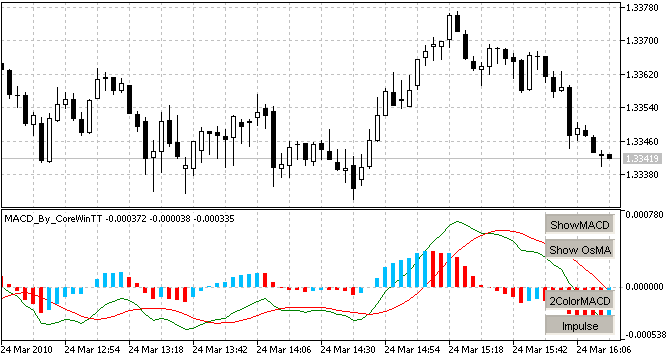
Fig. 5
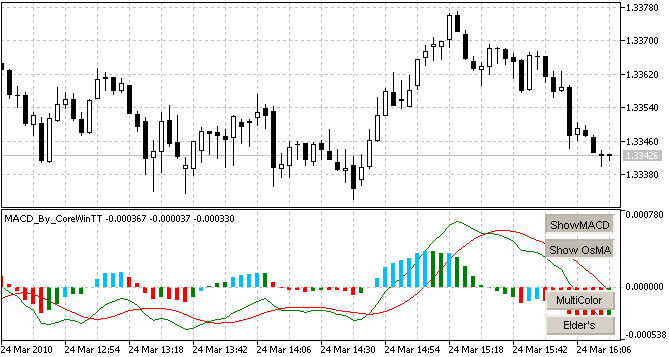
Fig. 6
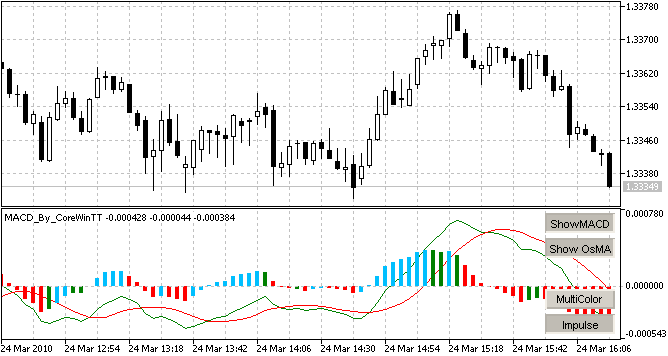
Fig. 7
Conclusion
This article can be considered as a guide for the beginners, who start studying the markets using the computer analysis of prices and implementation of the simple methods of graphical control of indicators.
I hope this article will improve your technical skills in creation of graphical control systems and will help you find your own "market vision" by hiding the things that hinder.
Translated from Russian by MetaQuotes Ltd.
Original article: https://www.mql5.com/ru/articles/42
Warning: All rights to these materials are reserved by MetaQuotes Ltd. Copying or reprinting of these materials in whole or in part is prohibited.
This article was written by a user of the site and reflects their personal views. MetaQuotes Ltd is not responsible for the accuracy of the information presented, nor for any consequences resulting from the use of the solutions, strategies or recommendations described.

 A Virtual Order Manager to track orders within the position-centric MetaTrader 5 environment
 MetaTrader 5: Publishing trading forecasts and live trading statements via e-mail on blogs, social networks and dedicated websites
 Creating a "Snake" Game in MQL5
- Free trading apps
- Over 8,000 signals for copying
- Economic news for exploring financial markets
You agree to website policy and terms of use
The indicator is just wonderful, the article is 5+, the author is smart!
But it is for MT5, I really want to use it in mt4, as I am not strong in programming can not port it for mt4, friends, how do I do it? Maybe there is already ready, please give me a link...
It is not possible to port it as it is, MQL4 does not have the same capabilities as MQL5.
Specifically, this indicator lacks objects...
OBJ_BUTTONBut if you do it for yourself, I can give advice, you can replace the objects "buttons" with scripts that will change global variables, and the scripts should be hung on hotkeys. Accordingly, the control should be tied not to buttons, but to the state of global variables.
It is not possible to port it as it is, MQL4 does not have the same capabilities as MQL5.
Specifically, this indicator lacks objects....
But if you do it for yourself, I can give advice, the objects "buttons" can be replaced by scripts that will change global variables, and the scripts can be hung on hotkeys. Accordingly, the control is tied not to the buttons but to the state of global variables.
but everything works for me... strange :)
but it's all working for me... weird :)
Desculpe Vasily, eu não entendo nada de Programação.
Estou procurando por um MACD que tenha 5 linhas, sendo que as quatro primeiras receba as mesmas configurações, SM, EMA, ..., porem a última possa receber uma configuração SM, EMA, .... diferente.
Até não sei se isso é possível, mas, se sim, como faço para adicionar em seu código?
OBS: esta última é de um período extremamente longo.
Grato.
-------------------------------------------------------------------------------------
Google TranslateUnfortunately Vasile, don't know anything about programming know.
I am looking for a MACD that has 5 lines, with the first four getting the same configuration, SM, EMA, ..., but the last one can get the configuration SM, EMA, .... different.
I don't even know if this is possible, but if so, how can I add to my code?
Note: The last one is extremely long period.
Thanks.
Hello,
I'm looking for an EA that could execute entries based on the colour strategy, Example: on the second candle of the change of the high or low colours the robot would execute an order in favour, does this EA exist? or where can I find a material to study and manufacture, I intend to use it on the IQoption platform? thank you for your support.
I look forward to hearing from you