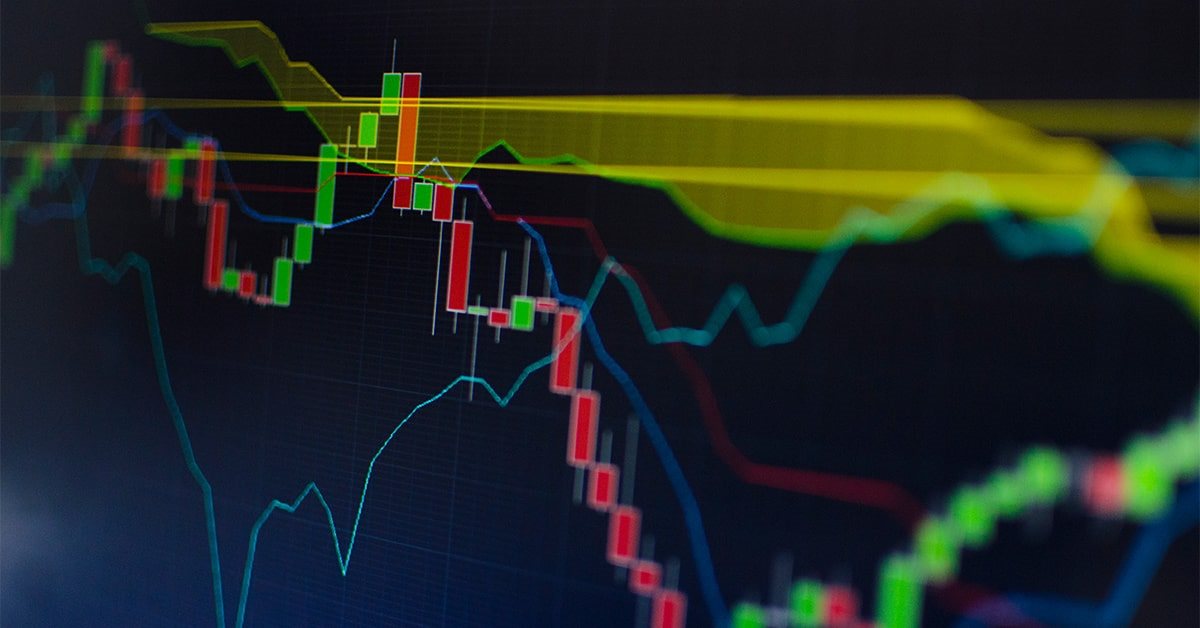
Articles on the MQL5 programming and use of technical indicators
Technical indicators constitute an important part of trading, and every trader tries to find something new. The authors of these articles talk about econometrics and machine learning, automatic marking of Elliott Waves and digital filters - everything from the classical methods of analysis to the modern interpretation of classical ideas.
The category features articles that will teach you how to develop a custom indicator and contains unique collections of ready-to-use mathematically explained William Blau's trading ideas.
Add a new article

You are missing trading opportunities:
- Free trading apps
- Over 8,000 signals for copying
- Economic news for exploring financial markets
Registration
Log in
You agree to website policy and terms of use
If you do not have an account, please register


Developing Pivot Mean Oscillator: a novel Indicator for the Cumulative Moving Average
This article presents Pivot Mean Oscillator (PMO), an implementation of the cumulative moving average (CMA) as a trading indicator for the MetaTrader platforms. In particular, we first introduce Pivot Mean (PM) as a normalization index for timeseries that computes the fraction between any data point and the CMA. We then build PMO as the difference between the moving averages applied to two PM signals. Some preliminary experiments carried out on the EURUSD symbol to test the efficacy of the proposed indicator are also reported, leaving ample space for further considerations and improvements.

The NRTR indicator and trading modules based on NRTR for the MQL5 Wizard
In this article we are going to analyze the NRTR indicator and create a trading system based on this indicator. We are going to develop a module of trading signals that can be used in creating strategies based on a combination of NRTR with additional trend confirmation indicators.

Developing Advanced ICT Trading Systems: Implementing Order Blocks in an Indicator
In this article, we will learn how to create an indicator that detects, draws, and alerts on the mitigation of order blocks. We will also take a detailed look at how to identify these blocks on the chart, set accurate alerts, and visualize their position using rectangles to better understand the price action. This indicator will serve as a key tool for traders who follow the Smart Money Concepts and the Inner Circle Trader methodology.

Custom Indicators (Part 1): A Step-by-Step Introductory Guide to Developing Simple Custom Indicators in MQL5
Learn how to create custom indicators using MQL5. This introductory article will guide you through the fundamentals of building simple custom indicators and demonstrate a hands-on approach to coding different custom indicators for any MQL5 programmer new to this interesting topic.

Gap - a profitable strategy or 50/50?
The article dwells on gaps — significant differences between a close price of a previous timeframe and an open price of the next one, as well as on forecasting a daily bar direction. Applying the GetOpenFileName function by the system DLL is considered as well.
Learn how to design a trading system by Ichimoku
Here is a new article in our series about how to design a trading system b the most popular indicators, we will talk about the Ichimoku indicator in detail and how to design a trading system by this indicator.

Manual charting and trading toolkit (Part I). Preparation: structure description and helper class
This is the first article in a series, in which I am going to describe a toolkit which enables manual application of chart graphics by utilizing keyboard shortcuts. It is very convenient: you press one key and a trendline appears, you press another key — this will create a Fibonacci fan with the necessary parameters. It will also be possible to switch timeframes, to rearrange layers or to delete all objects from the chart.

Better Programmer (Part 02): Stop doing these 5 things to become a successful MQL5 programmer
This is the must read article for anyone wanting to improve their programming career. This article series is aimed at making you the best programmer you can possibly be, no matter how experienced you are. The discussed ideas work for MQL5 programming newbies as well as professionals.
Multicurrency monitoring of trading signals (Part 2): Implementation of the visual part of the application
In the previous article, we created the application framework, which we will use as the basis for all further work. In this part, we will proceed with the development: we will create the visual part of the application and will configure basic interaction of interface elements.

A New Approach to Interpreting Classic and Hidden Divergence. Part II
The article provides a critical examination of regular divergence and efficiency of various indicators. In addition, it contains filtering options for an increased analysis accuracy and features description of non-standard solutions. As a result, we will create a new tool for solving the technical task.
MQL5.com Freelance: Developers' Source of Income (Infographic)
On the occasion of the MQL5 Freelance Service fourth birthday, we have prepared an info-graphic demonstrating the service results for the entire time of its existence. The figures speak for themselves: more than 10 000 orders worth about $600,000 in total have been executed to date, while 3 000 customers and 300 developers have already used the service.

How to analyze the trades of the Signal selected in the chart
The trade Signals service develops in leaps and bounds. Trusting our funds to a signal provider, we would like to minimize the risk of losing our deposit. So how to puzzle out in this forest of trade signals? How to find the one that would produce profits? This paper proposes to create a tool for visually analyzing the history of trades on trade signals in a symbol chart.

Learn how to design a trading system by Envelopes
In this article, I will share with you one of the methods of how to trade bands. This time we will consider Envelopes and will see how easy it is to create some strategies based on the Envelopes.

Cluster analysis (Part I): Mastering the slope of indicator lines
Cluster analysis is one of the most important elements of artificial intelligence. In this article, I attempt applying the cluster analysis of the indicator slope to get threshold values for determining whether a market is flat or following a trend.

Data Exchange between Indicators: It's Easy
We want to create such an environment, which would provide access to data of indicators attached to a chart, and would have the following properties: absence of data copying; minimal modification of the code of available methods, if we need to use them; MQL code is preferable (of course, we have to use DLL, but we will use just a dozen of strings of C++ code). The article describes an easy method to develop a program environment for the MetaTrader terminal, that would provide means for accessing indicator buffers from other MQL programs.

Random Walk and the Trend Indicator
Random Walk looks very similar to the real market data, but it has some significant features. In this article we will consider the properties of Random Walk, simulated using the coin-tossing game. To study the properties of the data, the trendiness indicator is developed.

Practical Implementation of Digital Filters in MQL5 for Beginners
The idea of digital signal filtering has been widely discussed on forum topics about building trading systems. And it would be imprudent not to create a standard code of digital filters in MQL5. In this article the author describes the transformation of simple SMA indicator's code from his article "Custom Indicators in MQL5 for Newbies" into code of more complicated and universal digital filter. This article is a logical sequel to the previous article. It also tells how to replace text in code and how to correct programming errors.

Learn how to design a trading system by Stochastic
In this article, we continue our learning series — this time we will learn how to design a trading system using one of the most popular and useful indicators, which is the Stochastic Oscillator indicator, to build a new block in our knowledge of basics.

Introduction to MQL5 (Part 7): Beginner's Guide to Building Expert Advisors and Utilizing AI-Generated Code in MQL5
Discover the ultimate beginner's guide to building Expert Advisors (EAs) with MQL5 in our comprehensive article. Learn step-by-step how to construct EAs using pseudocode and harness the power of AI-generated code. Whether you're new to algorithmic trading or seeking to enhance your skills, this guide provides a clear path to creating effective EAs.
Multicurrency monitoring of trading signals (Part 1): Developing the application structure
In this article, we will discuss the idea of creating a multicurrency monitor of trading signals and will develop a future application structure along with its prototype, as well as create its framework for further operation. The article presents a step-by-step creation of a flexible multicurrency application which will enable the generation of trading signals and which will assist traders in finding the desired signals.

Learn how to design a trading system by CCI
In this new article from our series for learning how to design trading systems, I will present the Commodities Channel Index (CCI), explain its specifics, and share with you how to create a trading system based on this indicator.

Time Series Forecasting Using Exponential Smoothing (continued)
This article seeks to upgrade the indicator created earlier on and briefly deals with a method for estimating forecast confidence intervals using bootstrapping and quantiles. As a result, we will get the forecast indicator and scripts to be used for estimation of the forecast accuracy.

Learn how to design a trading system by Fractals
This article is a new one from our series about how to design a trading system based on the most popular technical indicators. We will learn a new indicator which Fractals indicator and we will learn how to design a trading system based on it to be executed in the MetaTrader 5 terminal.
Learn how to design a trading system by Volumes
Here is a new article from our series about learning how to design a trading system based on the most popular technical indicators. The current article will be devoted to the Volumes indicator. Volume as a concept is one of the very important factors in financial markets trading and we have to pay attention to it. Through this article, we will learn how to design a simple trading system by Volumes indicator.

3 Methods of Indicators Acceleration by the Example of the Linear Regression
The article deals with the methods of indicators computational algorithms optimization. Everyone will find a method that suits his/her needs best. Three methods are described here.One of them is quite simple, the next one requires solid knowledge of Math and the last one requires some wit. Indicators or MetaTrader5 terminal design features are used to realize most of the described methods. The methods are quite universal and can be used not only for acceleration of the linear regression calculation, but also for many other indicators.

Learn how to design a trading system by Momentum
In my previous article, I mentioned the importance of identifying the trend which is the direction of prices. In this article I will share one of the most important concepts and indicators which is the Momentum indicator. I will share how to design a trading system based on this Momentum indicator.

Improved candlestick pattern recognition illustrated by the example of Doji
How to find more candlestick patterns than usual? Behind the simplicity of candlestick patterns, there is also a serious drawback, which can be eliminated by using the significantly increased capabilities of modern trading automation tools.

Studying candlestick analysis techniques (Part II): Auto search for new patterns
In the previous article, we analyzed 14 patterns selected from a large variety of existing candlestick formations. It is impossible to analyze all the patterns one by one, therefore another solution was found. The new system searches and tests new candlestick patterns based on known candlestick types.

Price Action Analysis Toolkit Development (Part 28): Opening Range Breakout Tool
At the start of each trading session, the market’s directional bias often becomes clear only after price moves beyond the opening range. In this article, we explore how to build an MQL5 Expert Advisor that automatically detects and analyzes Opening Range Breakouts, providing you with timely, data‑driven signals for confident intraday entries.
Multicurrency monitoring of trading signals (Part 4): Enhancing functionality and improving the signal search system
In this part, we expand the trading signal searching and editing system, as well as introduce the possibility to use custom indicators and add program localization. We have previously created a basic system for searching signals, but it was based on a small set of indicators and a simple set of search rules.
Rope Indicator by Erik Nayman
The article reveals how the "Rope" indicator is created based on "The Small Encyclopedia of Trader" by Erik L. Nayman. This indicator shows the direction of the trend using the calculated values of bulls and bears over a specified period of time. The article also contains principles of creating and calculating indicators along with the examples of codes. Other subjects covered include building an Expert Advisor based on the indicator, and the optimization of external parameters.

MQL5 Integration: Python
Python is a well-known and popular programming language with many features, especially in the fields of finance, data science, Artificial Intelligence, and Machine Learning. Python is a powerful tool that can be useful in trading as well. MQL5 allows us to use this powerful language as an integration to get our objectives done effectively. In this article, we will share how we can use Python as an integration in MQL5 after learning some basic information about Python.

Learn how to deal with date and time in MQL5
A new article about a new important topic which is dealing with date and time. As traders or programmers of trading tools, it is very crucial to understand how to deal with these two aspects date and time very well and effectively. So, I will share some important information about how we can deal with date and time to create effective trading tools smoothly and simply without any complicity as much as I can.

An Insight Into Accumulation/Distribution And Where It Can Get You
The Accumulation/Distribution (A/D) Indicator has one interesting feature - a breakout of the trend line plotted in this indicator chart suggests, with a certain degree of probability, a forthcoming breakout of the trend line in the price chart. This article will be useful and interesting for those who are new to programming in MQL4. Having this in view, I have tried to present the information in an easy to grasp manner and use the simplest code structures.
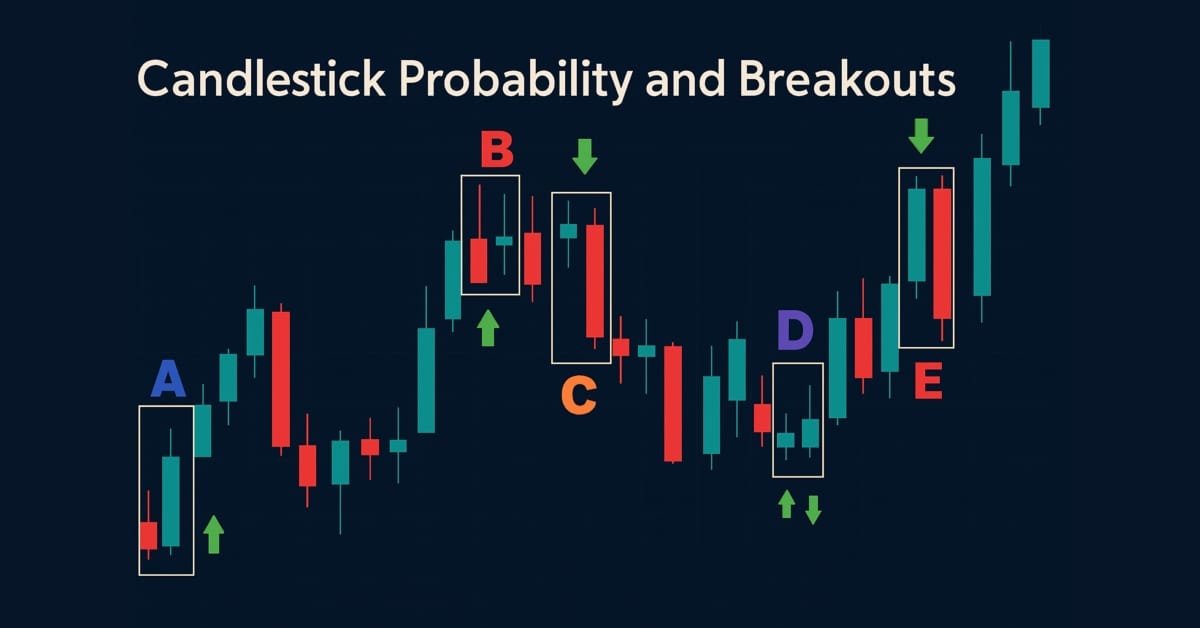
Price Action Analysis Toolkit Development (Part 43): Candlestick Probability and Breakouts
Enhance your market analysis with the MQL5-native Candlestick Probability EA, a lightweight tool that transforms raw price bars into real-time, instrument-specific probability insights. It classifies Pinbars, Engulfing, and Doji patterns at bar close, uses ATR-aware filtering, and optional breakout confirmation. The EA calculates raw and volume-weighted follow-through percentages, helping you understand each pattern's typical outcome on specific symbols and timeframes. On-chart markers, a compact dashboard, and interactive toggles allow easy validation and focus. Export detailed CSV logs for offline testing. Use it to develop probability profiles, optimize strategies, and turn pattern recognition into a measurable edge.
Fast Testing of Trading Ideas on the Chart
The article describes the method of fast visual testing of trading ideas. The method is based on the combination of a price chart, a signal indicator and a balance calculation indicator. I would like to share my method of searching for trading ideas, as well as the method I use for fast testing of these ideas.

Manual charting and trading toolkit (Part III). Optimization and new tools
In this article, we will further develop the idea of drawing graphical objects on charts using keyboard shortcuts. New tools have been added to the library, including a straight line plotted through arbitrary vertices, and a set of rectangles that enable the evaluation of the reversal time and level. Also, the article shows the possibility to optimize code for improved performance. The implementation example has been rewritten, allowing the use of Shortcuts alongside other trading programs. Required code knowledge level: slightly higher than a beginner.
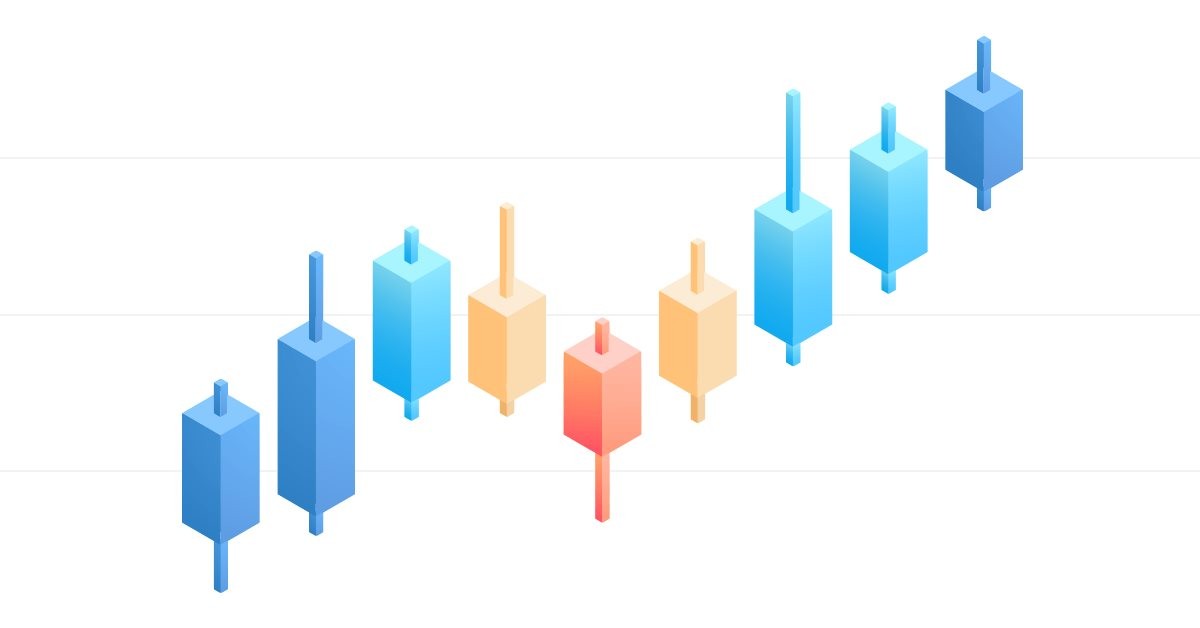
Exploring options for creating multicolored candlesticks
In this article I will address the possibilities of creating customized indicators with candlesticks, pointing out their advantages and disadvantages.

Learn how to design a trading system by Alligator
In this article, we'll complete our series about how to design a trading system based on the most popular technical indicator. We'll learn how to create a trading system based on the Alligator indicator.

Modeling time series using custom symbols according to specified distribution laws
The article provides an overview of the terminal's capabilities for creating and working with custom symbols, offers options for simulating a trading history using custom symbols, trend and various chart patterns.