Articles on the MQL5 programming and use of technical indicators
Technical indicators constitute an important part of trading, and every trader tries to find something new. The authors of these articles talk about econometrics and machine learning, automatic marking of Elliott Waves and digital filters - everything from the classical methods of analysis to the modern interpretation of classical ideas.
The category features articles that will teach you how to develop a custom indicator and contains unique collections of ready-to-use mathematically explained William Blau's trading ideas.
Add a new article

You are missing trading opportunities:
- Free trading apps
- Over 8,000 signals for copying
- Economic news for exploring financial markets
Registration
Log in
You agree to website policy and terms of use
If you do not have an account, please register
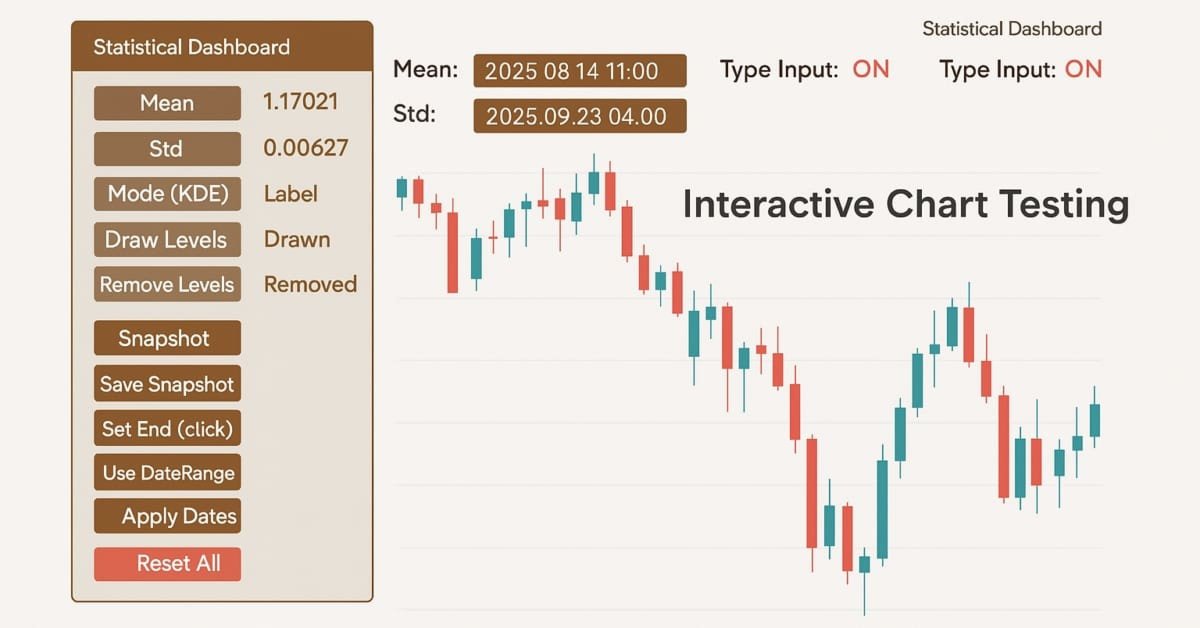
Price Action Analysis Toolkit Development (Part 42): Interactive Chart Testing with Button Logic and Statistical Levels
In a world where speed and precision matter, analysis tools need to be as smart as the markets we trade. This article presents an EA built on button logic—an interactive system that instantly transforms raw price data into meaningful statistical levels. With a single click, it calculates and displays mean, deviation, percentiles, and more, turning advanced analytics into clear on-chart signals. It highlights the zones where price is most likely to bounce, retrace, or break, making analysis both faster and more practical.

Statistical Arbitrage with predictions
We will walk around statistical arbitrage, we will search with python for correlation and cointegration symbols, we will make an indicator for Pearson's coefficient and we will make an EA for trading statistical arbitrage with predictions done with python and ONNX models.

Larry Williams Market Secrets (Part 5): Automating the Volatility Breakout Strategy in MQL5
This article demonstrates how to automate Larry Williams’ volatility breakout strategy in MQL5 using a practical, step-by-step approach. You will learn how to calculate daily range expansions, derive buy and sell levels, manage risk with range-based stops and reward-based targets, and structure a professional Expert Advisor for MetaTrader 5. Designed for traders and developers looking to transform Larry Williams’ market concepts into a fully testable and deployable automated trading system.
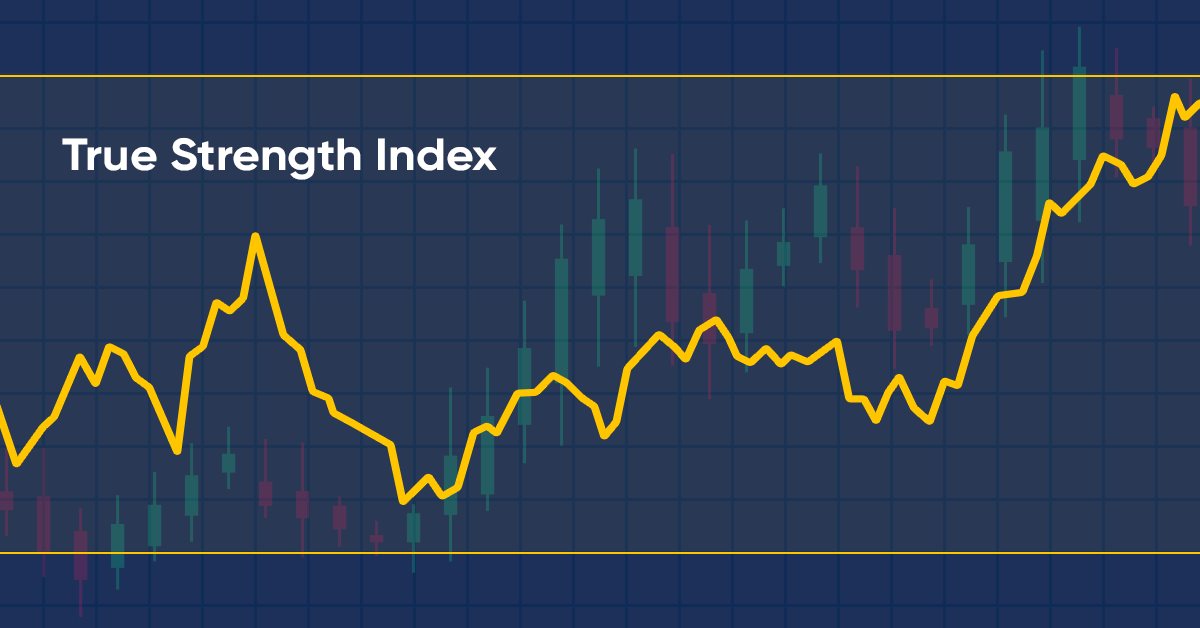
How to create a custom True Strength Index indicator using MQL5
Here is a new article about how to create a custom indicator. This time we will work with the True Strength Index (TSI) and will create an Expert Advisor based on it.

Improve Your Trading Charts With Interactive GUI's in MQL5 (Part I): Movable GUI (I)
Unleash the power of dynamic data representation in your trading strategies or utilities with our comprehensive guide on creating movable GUI in MQL5. Dive into the core concept of chart events and learn how to design and implement simple and multiple movable GUI on the same chart. This article also explores the process of adding elements to your GUI, enhancing their functionality and aesthetic appeal.

Parafrac Oscillator: Combination of Parabolic and Fractal Indicator
We will explore how the Parabolic SAR and the Fractal indicator can be combined to create a new oscillator-based indicator. By integrating the unique strengths of both tools, traders can aim at developing a more refined and effective trading strategy.

Category Theory in MQL5 (Part 1)
Category Theory is a diverse and expanding branch of Mathematics which as of yet is relatively uncovered in the MQL community. These series of articles look to introduce and examine some of its concepts with the overall goal of establishing an open library that attracts comments and discussion while hopefully furthering the use of this remarkable field in Traders' strategy development.


CCI indicator. Three transformation steps
In this article, I will make additional changes to the CCI affecting the very logic of this indicator. Moreover, we will be able to see it in the main chart window.

Developing a Trading Strategy: Using a Volume-Bound Approach
In the world of technical analysis, price often takes center stage. Traders meticulously map out support, resistance, and patterns, yet frequently ignore the critical force that drives these movements: volume. This article delves into a novel approach to volume analysis: the Volume Boundary indicator. This transformation, utilizing sophisticated smoothing functions like the butterfly and triple sine curves, allows for clearer interpretation and the development of systematic trading strategies.

William Gann methods (Part I): Creating Gann Angles indicator
What is the essence of Gann Theory? How are Gann angles constructed? We will create Gann Angles indicator for MetaTrader 5.

Multiple indicators on one chart (Part 03): Developing definitions for users
Today we will update the functionality of the indicator system for the first time. In the previous article within the "Multiple indicators on one chart" we considered the basic code which allows using more than one indicator in a chart subwindow. But what was presented was just the starting base of a much larger system.

Introduction to MQL5 (Part 16): Building Expert Advisors Using Technical Chart Patterns
This article introduces beginners to building an MQL5 Expert Advisor that identifies and trades a classic technical chart pattern — the Head and Shoulders. It covers how to detect the pattern using price action, draw it on the chart, set entry, stop loss, and take profit levels, and automate trade execution based on the pattern.

Creating a Dynamic Multi-Symbol, Multi-Period Relative Strength Indicator (RSI) Indicator Dashboard in MQL5
In this article, we develop a dynamic multi-symbol, multi-period RSI indicator dashboard in MQL5, providing traders real-time RSI values across various symbols and timeframes. The dashboard features interactive buttons, real-time updates, and color-coded indicators to help traders make informed decisions.

Larry Williams Market Secrets (Part 11): Detecting Smash Day Reversals with a Custom Indicator
We convert Larry Williams’ Smash Day reversal rules into a practical MQL5 indicator that flags confirmed setups with arrows. Step by step, the text shows buffer binding, plot properties, historical mapping, and real‑time updates inside OnCalculate. Adjustable lookback parameters and clean chart rendering help you detect valid reversals quickly while keeping final trade decisions discretionary and context‑driven.

Larry Williams Market Secrets (Part 14): Detecting Hidden Smash Day Reversals with a Custom Indicator
This article develops a practical MQL5 indicator that identifies Hidden Smash Day bars by strict numeric criteria and optional confirmation on the following session. We cover detection routines, buffer registration, and plot configuration to place arrows at valid bars. The approach delivers stable, non-repainting signals for historical testing and real-time monitoring.

Econometric tools for forecasting volatility: GARCH model
The article describes the properties of the non-linear model of conditional heteroscedasticity (GARCH). The iGARCH indicator has been built on its basis for predicting volatility one step ahead. The ALGLIB numerical analysis library is used to estimate the model parameters.

Price Movement: Mathematical Models and Technical Analysis
Forecasting the movements of currency pairs is an important factor in trading success. This article explores various price movement models, analyzes their advantages and disadvantages, and explores their practical application in trading strategies. We will consider approaches that allow us to identify hidden patterns and improve the accuracy of forecasts.
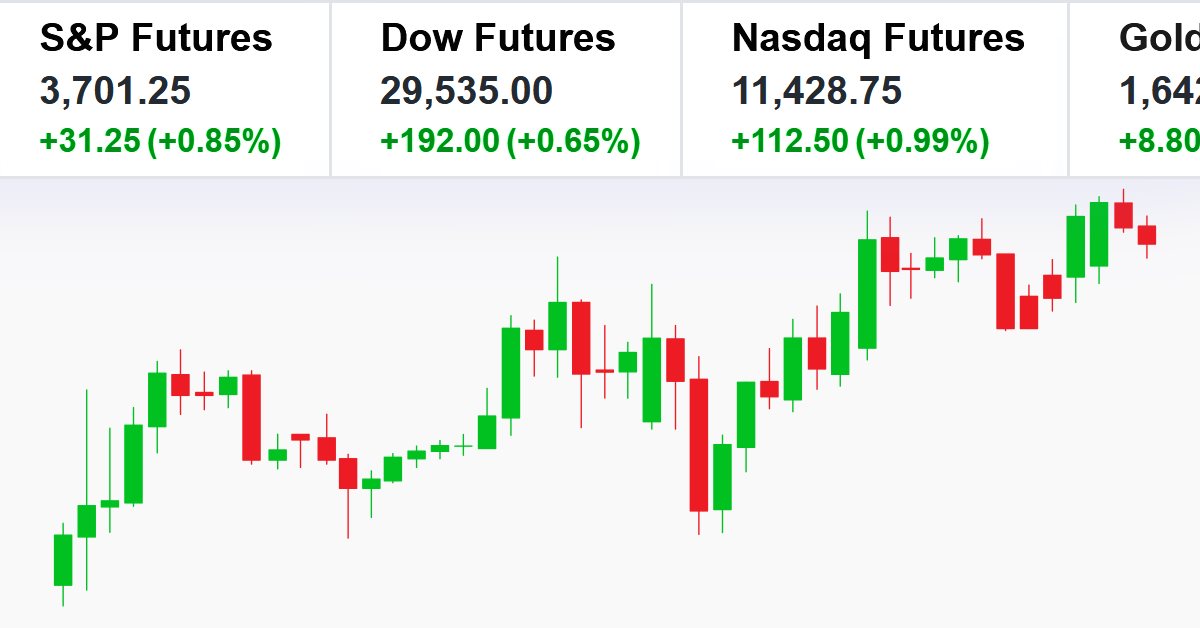
Creating a ticker tape panel: Basic version
Here I will show how to create screens with price tickers which are usually used to display quotes on the exchange. I will do it by only using MQL5, without using complex external programming.

Introduction to MQL5 (Part 24): Building an EA that Trades with Chart Objects
This article teaches you how to create an Expert Advisor that detects support and resistance zones drawn on the chart and executes trades automatically based on them.

Price Action Analysis Toolkit Development (Part 66): Developing a Structured Head and Shoulders Scanner in MQL5
Head and Shoulders patterns are difficult to identify consistently in live market data due to noise and structural ambiguity. This article presents a structured, triangle-based MQL5 indicator that isolates pattern components, constructs the neckline, and validates formations using ATR, symmetry, and slope constraints. The system detects and draws standard and inverse patterns, assigns a quality score, and confirms breakouts with optional alerts, enabling consistent and rule-based chart analysis.

Developing a trading Expert Advisor from scratch (Part 9): A conceptual leap (II)
In this article, we will place Chart Trade in a floating window. In the previous part, we created a basic system which enables the use of templates within a floating window.

Developing a trading Expert Advisor from scratch (Part 13): Time and Trade (II)
Today we will construct the second part of the Times & Trade system for market analysis. In the previous article "Times & Trade (I)" we discussed an alternative chart organization system, which would allow having an indicator for the quickest possible interpretation of deals executed in the market.
Timeseries in DoEasy library (part 48): Multi-period multi-symbol indicators on one buffer in a subwindow
The article considers an example of creating multi-symbol multi-period standard indicators using a single indicator buffer for construction and working in the indicator subwindow. I am going to prepare the library classes for working with standard indicators working in the program main window and having more than one buffer for displaying their data.
Revisiting Murray system
Graphical price analysis systems are deservedly popular among traders. In this article, I am going to describe the complete Murray system, including its famous levels, as well as some other useful techniques for assessing the current price position and making a trading decision.

Creating Custom Indicators in MQL5 (Part 6): Evolving RSI Calculations with Smoothing, Hue Shifts, and Multi-Timeframe Support
In this article, we build a versatile RSI indicator in MQL5 supporting multiple variants, data sources, and smoothing methods for improved analysis. We add hue shifts for color visuals, dynamic boundaries for overbought/oversold zones, and notifications for trend alerts. It includes multi-timeframe support with interpolation, offering us a customizable RSI tool for diverse strategies.

How to build and optimize a volume-based trading system (Chaikin Money Flow - CMF)
In this article, we will provide a volume-based indicator, Chaikin Money Flow (CMF) after identifying how it can be constructed, calculated, and used. We will understand how to build a custom indicator. We will share some simple strategies that can be used and then test them to understand which one is better.

Implementing the Janus factor in MQL5
Gary Anderson developed a method of market analysis based on a theory he dubbed the Janus Factor. The theory describes a set of indicators that can be used to reveal trends and assess market risk. In this article we will implement these tools in mql5.
Timeseries in DoEasy library (part 47): Multi-period multi-symbol standard indicators
In this article, I will start developing the methods of working with standard indicators, which will ultimately allow creating multi-symbol multi-period standard indicators based on library classes. Besides, I will add the "Skipped bars" event to the timeseries classes and eliminate excessive load from the main program code by moving the library preparation functions to CEngine class.
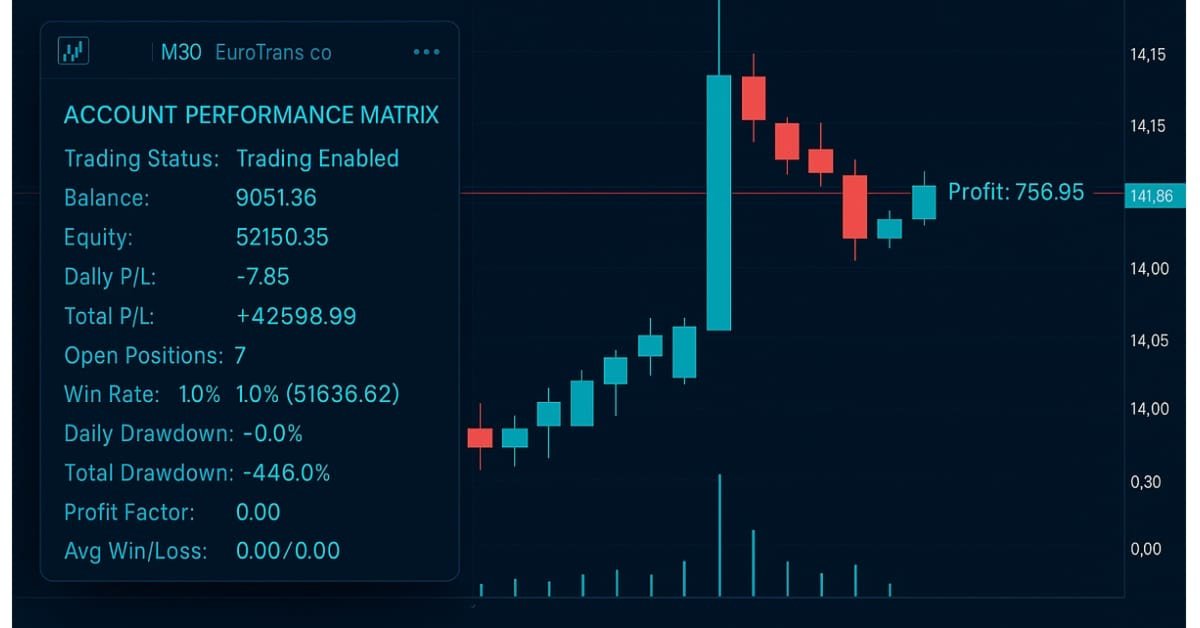
Developing A Custom Account Performance Matrix Indicator
This indicator acts as a discipline enforcer by tracking account equity, profit/loss, and drawdown in real-time while displaying a performance dashboard. It can help traders stay consistent, avoid overtrading, and comply with prop-firm challenge rules.

Improve Your Trading Charts With Interactive GUI's in MQL5 (Part II): Movable GUI (II)
Unlock the potential of dynamic data representation in your trading strategies and utilities with our in-depth guide to creating movable GUIs in MQL5. Delve into the fundamental principles of object-oriented programming and discover how to design and implement single or multiple movable GUIs on the same chart with ease and efficiency.

Developing a Custom Market Sentiment Indicator
In this article we are developing a custom market sentiment indicator to classify conditions into bullish, bearish, risk-on, risk-off, or neutral. Using multi-timeframe, the indicator can provide traders with a clearer perspective of overall market bias and short-term confirmations.

Developing a trading Expert Advisor from scratch (Part 14): Adding Volume At Price (II)
Today we will add some more resources to our EA. This interesting article can provide some new ideas and methods of presenting information. At the same time, it can assist in fixing minor flaws in your projects.

Creating a ticker tape panel: Improved version
How do you like the idea of reviving the basic version of our ticker tape panel? The first thing we will do is change the panel to be able to add an image, such as an asset logo or some other image, so that the user could quickly and easily identify the displayed symbol.

From Novice to Expert: Enhancing Liquidity Strategies with Multi-Timeframe Structural Confirmation in MQL5
The alignment of higher-timeframe liquidity structures with lower-timeframe reversal patterns can greatly influence both the likelihood and direction of the next price movement. By integrating structural liquidity zones from higher timeframes with precise reversal confirmations on lower timeframes, traders can improve entry timing and overall trade quality. This article demonstrates how to reinforce liquidity-based trading strategies through higher-timeframe structural confirmation—and how to implement this approach effectively using MQL5.

Price Action Analysis Toolkit Development (Part 23): Currency Strength Meter
Do you know what really drives a currency pair’s direction? It’s the strength of each individual currency. In this article, we’ll measure a currency’s strength by looping through every pair it appears in. That insight lets us predict how those pairs may move based on their relative strengths. Read on to learn more.
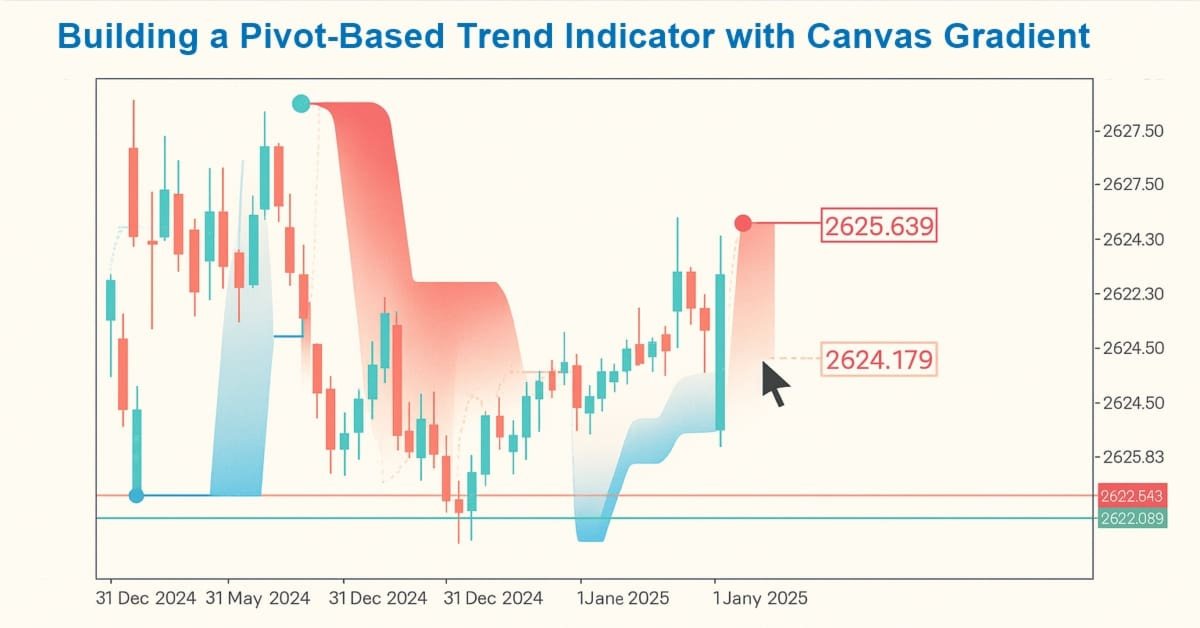
Creating Custom Indicators in MQL5 (Part 1): Building a Pivot-Based Trend Indicator with Canvas Gradient
In this article, we create a Pivot-Based Trend Indicator in MQL5 that calculates fast and slow pivot lines over user-defined periods, detects trend directions based on price relative to these lines, and signals trend starts with arrows while optionally extending lines beyond the current bar. The indicator supports dynamic visualization with separate up/down lines in customizable colors, dotted fast lines that change color on trend shifts, and optional gradient filling between lines, using a canvas object for enhanced trend-area highlighting.

Advanced Variables and Data Types in MQL5
Variables and data types are very important topics not only in MQL5 programming but also in any programming language. MQL5 variables and data types can be categorized as simple and advanced ones. In this article, we will identify and learn about advanced ones because we already mentioned simple ones in a previous article.

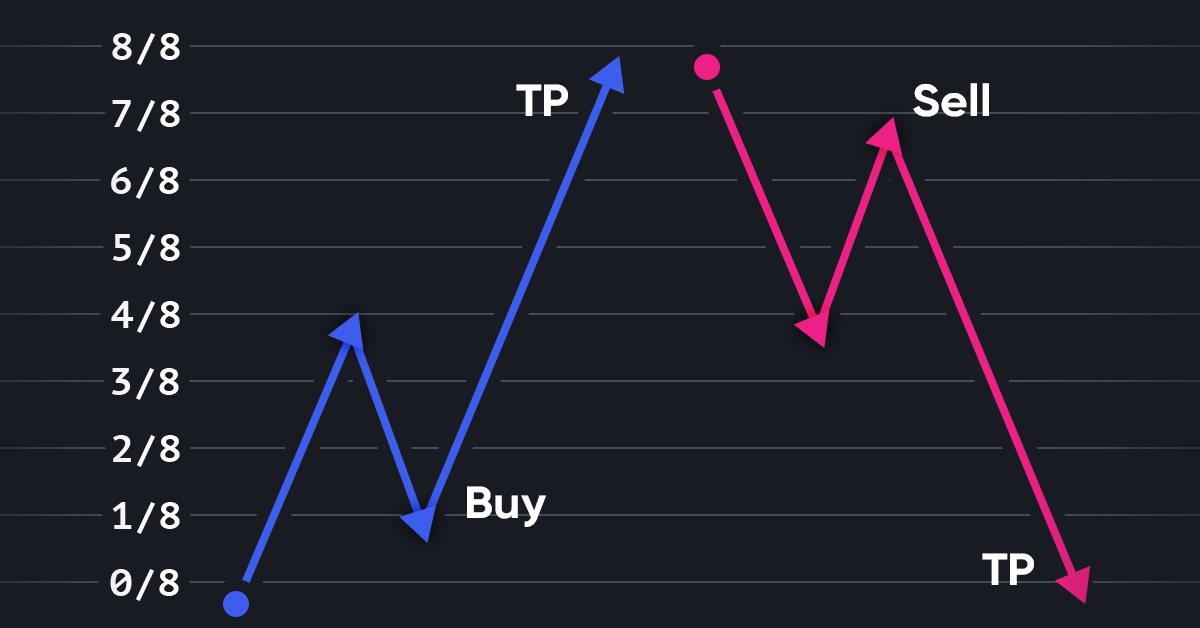
Price Action Analysis Toolkit Development (Part 16): Introducing Quarters Theory (II) — Intrusion Detector EA
In our previous article, we introduced a simple script called "The Quarters Drawer." Building on that foundation, we are now taking the next step by creating a monitor Expert Advisor (EA) to track these quarters and provide oversight regarding potential market reactions at these levels. Join us as we explore the process of developing a zone detection tool in this article.

Timeseries in DoEasy library (part 53): Abstract base indicator class
The article considers creation of an abstract indicator which further will be used as the base class to create objects of library’s standard and custom indicators.

MQL5 Wizard Techniques you should know (Part 44): Average True Range (ATR) technical indicator
The ATR oscillator is a very popular indicator for acting as a volatility proxy, especially in the forex markets where volume data is scarce. We examine this, on a pattern basis as we have with prior indicators, and share strategies & test reports thanks to the MQL5 wizard library classes and assembly.