
Time Series Forecasting Using Exponential Smoothing (continued)

Introduction
The article "Time Series Forecasting Using Exponential Smoothing" [1] gave a brief summary of exponential smoothing models, illustrated one of the possible approaches to optimizing the model parameters and ultimately proposed the forecast indicator developed on the basis of the linear growth model with damping. This article represents an attempt to somewhat increase the accuracy of this forecast indicator.
It is complicated to predict currency quotes or to get a fairly reliable forecast even for three or four steps ahead. Nevertheless, as in the previous article of this series, we will produce 12-step-ahead forecasts, clearly realizing that it will be impossible to get satisfactory results over such a long horizon. The first few steps of the forecast with the narrowest confidence intervals should therefore be given foremost attention to.
A 10- to 12-step-ahead forecast is intended mainly for demonstration of behavioral features of different models and forecasting methods. In any case, the accuracy of the obtained forecast for any horizon can be assessed using the confidence interval limits. This article is essentially aimed at demonstration of some methods that can help to upgrade the indicator as set forth in the article [1].
The algorithm for finding the minimum of a function of several variables that is applied in developing the indicators was dealt with in the previous article and will therefore not be repeatedly described here. Not to overload the article, theoretical inputs will be kept to the minimum.
1. Initial Indicator
The IndicatorES.mq5 indicator (see article [1]) will be used as a starting point.
For compilation of the indicator we will need IndicatorES.mq5, CIndicatorES.mqh and PowellsMethod.mqh, all located in the same directory. The files can be found in the files2.zip archive at the end of the article.
Let us refresh the equations that define the exponential smoothing model used in developing this indicator - the linear growth model with damping.
![]()
![]()
![]()
Where:
 - smoothing parameter for the level of the sequence [0,1];
 - smoothing parameter for the trend [0,1];
 - damping parameter [0,1];
 - smoothed level of the sequence calculated at the time t after
  has been observed;
 - smoothed additive trend calculated at the time t;
 - value of the sequence at the time t;
 - number of steps ahead for which the forecast is made;
 - m-step-ahead forecast made at the time t;
 - one-step-ahead forecast error at the time t,
 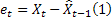 .
.
The only input parameter of the indicator is the value determining the length of the interval according to which the model parameters will be optimized and the initial values (study interval) selected. Following the determination of the optimal values of the model parameters at a given interval and the required calculations, the forecast, confidence interval and the line corresponding to the one-step-ahead forecast are produced. At every new bar, the parameters are optimized and the forecast is made.
Since the indicator in question is going to be upgraded, the effect of the changes we will make will be assessed using the test sequences from the Files2.zip archive located at the end of the article. The archive directory \Dataset2 contains files with the saved EURUSD, USDCHF, USDJPY quotes and U.S. Dollar Index DXY. Each of those is provided for three time frames, being M1, H1 and D1. The "open" values saved in the files are located so that the most recent value is at the end of the file. Each file contains 1200 elements.
Forecast errors will be estimated by calculating the "Mean Absolute Percentage Error" (MAPE) coefficient
![]()
Let us divide each of the twelve test sequences into 50 overlapping sections containing 80 elements each and calculate the MAPE value for each one of them. The mean of the estimates so obtained will be used as a forecast error index with regard to the indicators put into comparison. MAPE values for two- and three-step-ahead forecast errors will be calculated in the same manner. Such averaged estimates will be further denoted as follows:
- MAPE1 – averaged estimate of the one-step-ahead forecast error;
- MAPE2 – averaged estimate of the two-step-ahead forecast error;
- MAPE3 – averaged estimate of the three-step-ahead forecast error;
- MAPE1-3 – mean (MAPE1+MAPE2+MAPE3)/3.
When calculating the MAPE value, the absolute forecast error value is at every step divided by the current value of the sequence. In order to avoid division by zero or obtaining negative values in so doing, the input sequences are required to take only nonzero positive values, as in our case.
The estimate values for our initial indicator are shown in Table 1.
| MAPE1 |
MAPE2 |
MAPE3 |
MAPE1-3 |
|
|---|---|---|---|---|
| IndicatorES |
0.2099 |
0.2925 |
0.3564 |
0.2863 |
Table 1. Initial indicator forecast error estimates
The data displayed in Table 1 is obtained using the Errors_IndicatorES.mq5 script (from the files2.zip archive located at the end of the article). To compile and run the script, it is necessary that CIndicatorES.mqh and PowellsMethod.mqh are located in the same directory as Errors_IndicatorES.mq5, and the input sequences are in Files\Dataset2\ directory.
After obtaining the initial estimates of the forecast errors, we can now proceed to upgrading the indicator under consideration.
2. Optimization Criterion
The model parameters in the initial indicator as set forth in the article "Time Series Forecasting Using Exponential Smoothing" were determined by minimizing the sum of squares of the one-step-ahead forecast error. It appears logical that the model parameters optimal for a one-step-ahead forecast may not yield minimum errors for a more-step-ahead forecast. It would, of course, be desirable to minimize 10- to 12-step-ahead forecast errors, but getting a satisfactory forecast result over the given range for the sequences under consideration would be a mission impossible.
Being realistic, when optimizing the model parameters, we will use the sum of squares of the one-, two- and three-step-ahead forecast errors as the first upgrade of our indicator. The average number of errors may be expected to somewhat decrease over the range of the first three steps of the forecast.
Clearly, such upgrade of the initial indicator does not concern its main structural principles but only changes the parameter optimization criterion. Therefore we cannot expect the forecast accuracy to increase several-fold although the number of two- and three-step-ahead forecast errors should drop a little.
In order to compare the forecast results, we created the CMod1 class similar to the CIndicatorES class introduced in the previous article with the modified objective function func.
The func function of the initial CIndicatorES class:
double CIndicatorES::func(const double &p[])
  {
  int i;
  double s,t,alp,gam,phi,k1,k2,k3,e,sse,ae,pt;

  s=p[0]; t=p[1]; alp=p[2]; gam=p[3]; phi=p[4]; k1=1; k2=1; k3=1;
  if     (alp>0.95){k1+=(alp-0.95)*200; alp=0.95;}       // Alpha  > 0.95
  else if(alp<0.05){k1+=(0.05-alp)*200; alp=0.05;}       // Alpha  < 0.05
  if     (gam>0.95){k2+=(gam-0.95)*200; gam=0.95;}      // Gamma  > 0.95
  else if(gam<0.05){k2+=(0.05-gam)*200; gam=0.05;}       // Gamma  < 0.05
  if     (phi>1.0 ){k3+=(phi-1.0 )*200; phi=1.0; }      // Phi    > 1.0
  else if(phi<0.05){k3+=(0.05-phi)*200; phi=0.05;}       // Phi    < 0.05
  sse=0;
  for(i=0;i<Dlen;i++)
    {
    e=Dat[i]-(s+phi*t); sse+=e*e;
    ae=alp*e; pt=phi*t; s=s+pt+ae; t=pt+gam*ae;
    }
  return(Dlen*MathLog(k1*k2*k3*sse));
  }
Following some modifications, the func function now appears as follows
double CMod1::func(const double &p[])
  {
  int i;
  double s,t,alp,gam,phi,k1,k2,k3,e,err,ae,pt,phi2,phi3,a;

  s=p[0]; t=p[1]; alp=p[2]; gam=p[3]; phi=p[4]; k1=1; k2=1; k3=1;
  if     (alp>0.95){k1+=(alp-0.95)*200; alp=0.95;        // Alpha   > 0.95
  else if(alp<0.05){k1+=(0.05-alp)*200; alp=0.05;}       // Alpha   < 0.05
  if     (gam>0.95){k2+=(gam-0.95)*200; gam=0.95;}      // Gamma   > 0.95
  else if(gam<0.05){k2+=(0.05-gam)*200; gam=0.05;}       // Gamma   < 0.05
  if     (phi>1.0 ){k3+=(phi-1.0 )*200; phi=1.0; }      // Phi     > 1.0
  else if(phi<0.05){k3+=(0.05-phi)*200; phi=0.05;}       // Phi     < 0.05
  phi2=phi+phi*phi; phi3=phi2+phi*phi*phi;
  err=0;
  for(i=0;i<Dlen-2;i++)
    {
    e=Dat[i]-(s+phi*t); err+=e*e;
    a=Dat[i+1]-(s+phi2*t); err+=a*a;
    a=Dat[i+2]-(s+phi3*t); err+=a*a;
    ae=alp*e; pt=phi*t; s=s+pt+ae; t=pt+gam*ae;
    }
  e=Dat[Dlen-2]-(s+phi*t); err+=e*e;
  a=Dat[Dlen-1]-(s+phi2*t); err+=a*a;
  ae=alp*e; pt=phi*t; s=s+pt+ae; t=pt+gam*ae;
  a=Dat[Dlen-1]-(s+phi*t); err+=a*a;
  return(k1*k2*k3*err);
  }
Now, when calculating the objective function, the sum of squares of the one-, two- and three-step-ahead forecast errors is used.
Further, based on this class the Errors_Mod1.mq5 script was developed allowing to estimate the forecast errors, like the already mentioned Errors_IndicatorES.mq5 script does. CMod1.mqh and Errors_Mod1.mq5 are located in the files2.zip archive at the end of the article.
Table 2 displays the forecast error estimates for the initial and upgraded versions.
| MAPE1 |
MAPE2 |
MAPE3 |
MAPE1-3 |
|
|---|---|---|---|---|
| IndicatorES |
0.2099 |
0.2925 |
0.3564 |
0.2863 |
| Mod1 |
0.2144 |
0.2898 |
0.3486 |
0.2842 |
Table 2. Comparison of the forecast error estimates
As can be seen, the error coefficients MAPE2 and MAPE3 and the mean value MAPE1-3 actually did turn out to be slightly lower for the sequences under consideration. So let us save this version and proceed to further modification of our indicator.
3. Adjustment of Parameters in the Smoothing Process
The idea of changing the smoothing parameters depending on the current values of the input sequence is not new or original and comes from the wish to adjust the smoothing coefficients so that they remain optimal given any change in the nature of the input sequence. Some ways of adjusting the smoothing coefficients are described in the literature [2], [3].
To further upgrade the indicator, we will use the model with dynamically changing smoothing coefficient expecting that the use of the adaptive exponential smoothing model will allow us to increase the forecast accuracy of our indicator.
Unfortunately, when used in forecasting algorithms, the majority of adaptive methods do not always yield the desired results. Selection of the adequate adaptive method may appear to be too cumbersome and time-consuming; therefore in our case we will make use of the findings provided in the literature [4] and try to employ "Smooth Transition Exponential Smoothing" (STES) approach set forth in the article [5].
The essence of the approach is clearly outlined in the specified article, so we will leave it out here and proceed directly to the equations for our model (see the beginning of the specified article) taking into consideration the use of the adaptive smoothing coefficient.
![]()
![]()
![]()
![]()
As we can now see, the value of the smoothing coefficient alpha is calculated at every step of the algorithm and depends on the squared forecast error. Values of b and g coefficients determine the effect of the forecast error on the alpha value. In all other respects, the equations for the employed model remained unchanged. Additional information regarding the use of STES approach can be found in the article [6].
Whereas in the previous versions, we had to determine the optimal value of the alpha coefficient over the given input sequence, there are now two adaptive coefficients b and g that are subject to optimization and the alpha value will be dynamically determined in the process of smoothing the input sequence.
This upgrade is implemented in the form of the CMod2 class. The major changes (as the previous time) primarily concerned the func function which now appears as follows.
double CMod2::func(const double &p[])
  {
  int i;
  double s,t,alp,gam,phi,sb,sg,k1,k2,e,err,ae,pt,phi2,phi3,a;

  s=p[0]; t=p[1]; gam=p[2]; phi=p[3]; sb=p[4]; sg=p[5]; k1=1; k2=1;
  if     (gam>0.95){k1+=(gam-0.95)*200; gam=0.95;}        // Gamma   > 0.95
  else if(gam<0.05){k1+=(0.05-gam)*200; gam=0.05;}        // Gamma   < 0.05
  if     (phi>1.0 ){k2+=(phi-1.0 )*200; phi=1.0; }       // Phi     > 1.0
  else if(phi<0.05){k2+=(0.05-phi)*200; phi=0.05;}        // Phi     < 0.05
  phi2=phi+phi*phi; phi3=phi2+phi*phi*phi;
  err=0;
  for(i=0;i<Dlen-2;i++)
    {
    e=Dat[i]-(s+phi*t); err+=e*e;
    a=Dat[i+1]-(s+phi2*t); err+=a*a;
    a=Dat[i+2]-(s+phi3*t); err+=a*a;
    alp=0.05+0.9/(1+MathExp(sb+sg*e*e));                  // 0.05 < Alpha < 0.95
    ae=alp*e; pt=phi*t; s=s+pt+ae; t=pt+gam*ae;
    }
  e=Dat[Dlen-2]-(s+phi*t); err+=e*e;
  a=Dat[Dlen-1]-(s+phi2*t); err+=a*a;
  alp=0.05+0.9/(1+MathExp(sb+sg*e*e));                    // 0.05 < Alpha < 0.95
  ae=alp*e; pt=phi*t; s=s+pt+ae; t=pt+gam*ae;
  a=Dat[Dlen-1]-(s+phi*t); err+=a*a;
  return(k1*k2*err);
  }
When developing this function, the equation defining the alpha coefficient value was slightly modified. This was done to set the limit of the maximum and minimum permissible value of this coefficient at 0.05 and 0.95, respectively.
To estimate the forecast errors, as it was previously done, the Errors_Mod2.mq5 script was written based on the CMod2 class. CMod2.mqh and Errors_Mod2.mq5 are located in the files2.zip archive at the end of the article.
The script results are shown in Table 3.
| MAPE1 |
MAPE2 |
MAPE3 |
MAPE1-3 |
|
|---|---|---|---|---|
| IndicatorES |
0.2099 |
0.2925 |
0.3564 |
0.2863 |
| Mod1 |
0.2144 |
0.2898 |
0.3486 |
0.2842 |
| Mod2 |
0.2145 |
0.2832 |
0.3413 |
0.2797 |
Table 3. Comparison of the forecast error estimates
As Table 3 suggests, the use of the adaptive smoothing coefficient has on the average allowed to further slightly decrease the forecast errors for our test sequences. Thus, following two upgrades, we managed to decrease the error coefficient MAPE1-3 by approximately two percent.
Despite a rather modest upgrade result, we will stick with the resulting version and leave further upgrades out of the scope of the article. As a next step, it would be interesting to try using the Box-Cox transformation. This transformation is mostly used to approximate the initial sequence distribution to the normal distribution.
In our case, it could be utilized to transform the initial sequence, compute the forecast and to inverse-transform the forecast. The transformation coefficient applied in so doing should be selected so that the resulting forecast error is minimized. An example of using the Box-Cox transformation in forecasting sequences can be found in the article [7].
4. Forecast Confidence Interval
The forecast confidence interval in the initial IndicatorES.mq5 indicator (set forth in the previous article) was calculated according to the analytical expressions derived for the selected exponential smoothing model [8]. The changes made in our case have lead to changes in the model under consideration. The variable smoothing coefficient makes it inappropriate to use the above mentioned analytical expressions for estimation of the confidence interval.
The fact that the previously used analytical expressions were derived based on the assumption that the forecast error distribution is symmetric and normal may constitute an additional reason for changing the confidence interval estimation method. These requirements are not met for our class of sequences and the forecast error distribution may not be normal nor symmetric.
When estimating the confidence interval in the initial indicator, the one-step-ahead forecast error variance was calculated in the first place from the input sequence, followed by the calculation of the variance for a two-, three- and more-step-ahead forecast on the basis of the obtained one-step-ahead forecast error variance value using the analytical expressions.
In order to avoid the use of analytical expressions, there is a simple way out whereby the variance for a two-, three- and more-step-ahead forecast is calculated directly from the input sequence as well as the variance for a one-step-ahead forecast. However, this approach has a significant drawback: in short input sequences, the confidence interval estimates will be widely scattered and the calculation of variance and mean squared error will not allow to relieve constraints on the expected normality of errors.
A solution in this case can be found in the use of nonparametric bootstrap (resampling) [9]. The backbone of the idea expressed simply: when sampling in a random way (uniform distribution) with replacement from the initial sequence, the distribution of the so generated artificial sequence will be the same as that of the initial one.
Assume, we have an input sequence of N members; by generating a uniformly distributed pseudo-random sequence over the range of [0,N-1] and using these values as indices when sampling from the initial array, we can generate an artificial sequence of a substantially greater length than the initial one. That said, the distribution of the generated sequence will be the same (almost the same) as that of the initial one.
The bootstrap procedure for estimation of the confidence intervals can be as follows:
- Determine the optimal initial values of the model parameters, its coefficients and adaptive coefficients from the input sequence for the exponential smoothing model obtained as a result of modification. The optimal parameters are, as before, determined using the algorithm that employs Powell's search method;
- Using the determined optimal model parameters, "go" through the initial sequence and form an array of one-step-ahead forecast errors. The number of the array elements will be equal to the input sequence length N;
- Align the errors by subtracting from each element of the error array the mean value thereof;
- Using the pseudo-random sequence generator, generate indices within the range of [0,N-1] and use them to form an artificial sequence of errors being 9999 elements long (resampling);
- Form an array containing 9999 values of the pseudo-input sequence by inserting the values from the artificially generated error array into the equations that define the model currently used. In other words, whereas we previously had to insert the input sequence values into the model equations thus calculating the forecast error, now the inverse calculations are made. For each element of the array, the error value is inserted to calculate the input value. As a result, we get the array of 9999 elements containing the sequence with the same distribution as the input sequence while being of sufficient length to directly estimate the forecast confidence intervals.
Then estimate the confidence intervals using the generated sequence of adequate length. For this purpose, we will exploit the fact that if the generated forecast error array is sorted in ascending order, the array cells with indices 249 and 9749 for the array containing 9999 values will have the values corresponding to the limits of the 95% confidence interval [10].
In order to get a more accurate estimation of the prediction intervals, the array length shall be odd. In our case, the limits of the forecast confidence intervals are estimated as follows:
- Using the optimal model parameters as determined earlier, "go" through the generated sequence and form an array of 9999 one-step-ahead forecast errors;
- Sort the resulting array;
- From the sorted error array, select values with indices 249 and 9749 which represent the limits of the 95% confidence interval;
- Repeat steps 1, 2 and 3 for two-, three- and more-step-ahead forecast errors.
This approach to estimating the confidence intervals has its advantages and disadvantages.
Among its advantages is the absence of assumptions regarding the nature of the distribution of the forecast errors. They do not have to be normally or symmetrically distributed. Besides, this approach may be useful where it is impossible to derive analytical expressions for the model in use.
A dramatic increase in the required scope of calculations and dependence of the estimates on the quality of the pseudo-random sequence generator used can be considered its disadvantages.
The proposed approach to estimating the confidence intervals using resampling and quantiles is rather primitive and there must be ways to improve it. But since the confidence intervals in our case are only intended for visual assessment, the accuracy provided by the above approach may appear to be quite sufficient.
5. Modified Version of the Indicator
Taking into account the upgrades introduced in the article, the ForecastES.mq5 indicator was developed. For resampling, we used the pseudo-random sequence generator proposed earlier in the article [11]. The standard MathRand() generator yielded slightly poorer results, probably due to the fact that the range of values it generated [0,32767] was not wide enough.
When compiling the ForecastES.mq5 indicator, PowellsMethod.mqh, CForeES.mqh and RNDXor128.mqh shall be located in the same directory with it. All these files can be found in the fore.zip archive.
Below is the source code of the ForecastES.mq5 indicator.
//+------------------------------------------------------------------+
//|                                                   ForecastES.mq5 |
//|                                          Copyright 2012, victorg |
//|                                              https://www.mql5.com |
//+------------------------------------------------------------------+
#property copyright   "2012, victorg."
#property link        "https://www.mql5.com"
#property version     "1.02"
#property description "Forecasting based on the exponential smoothing."

#property indicator_chart_window
#property indicator_buffers 4
#property indicator_plots   4

#property indicator_label1  "History"
#property indicator_type1   DRAW_LINE
#property indicator_color1  clrDodgerBlue
#property indicator_style1  STYLE_SOLID
#property indicator_width1  1
#property indicator_label2  "Forecast"           // Forecast
#property indicator_type2   DRAW_LINE
#property indicator_color2  clrDarkOrange
#property indicator_style2  STYLE_SOLID
#property indicator_width2  1
#property indicator_label3  "ConfUp"             // Confidence interval
#property indicator_type3   DRAW_LINE
#property indicator_color3  clrCrimson
#property indicator_style3  STYLE_DOT
#property indicator_width3  1
#property indicator_label4  "ConfDn"             // Confidence interval
#property indicator_type4   DRAW_LINE
#property indicator_color4  clrCrimson
#property indicator_style4  STYLE_DOT
#property indicator_width4  1

input int nHist=80; // History bars, nHist>=24

#include  "CForeES.mqh"
#include  "RNDXor128.mqh"

#define   NFORE 12
#define   NBOOT 9999

double    Hist[],Fore[],Conf1[],Conf2[];
double    Data[],Err[],BSDat[],Damp[NFORE],BSErr[NBOOT];
int       NDat;

CForeES   Es;
RNDXor128 Rnd;
//+------------------------------------------------------------------+
//| Custom indicator initialization function                         |
//+------------------------------------------------------------------+
int OnInit()
  {
   NDat=nHist; if(NDat<24)NDat=24;
   MqlRates rates[];
   CopyRates(NULL,0,0,NDat,rates);                 // Load missing data
   ArrayResize(Data,NDat);
   ArrayResize(Err,NDat);
   ArrayResize(BSDat,NBOOT+NFORE);

   SetIndexBuffer(0,Hist,INDICATOR_DATA);
   PlotIndexSetString(0,PLOT_LABEL,"History");
   SetIndexBuffer(1,Fore,INDICATOR_DATA);
   PlotIndexSetString(1,PLOT_LABEL,"Forecast");
   PlotIndexSetInteger(1,PLOT_SHIFT,NFORE);
   SetIndexBuffer(2,Conf1,INDICATOR_DATA);         // Confidence interval
   PlotIndexSetString(2,PLOT_LABEL,"ConfUp");
   PlotIndexSetInteger(2,PLOT_SHIFT,NFORE);
   SetIndexBuffer(3,Conf2,INDICATOR_DATA);         // Confidence interval
   PlotIndexSetString(3,PLOT_LABEL,"ConfDN");
   PlotIndexSetInteger(3,PLOT_SHIFT,NFORE);
   IndicatorSetInteger(INDICATOR_DIGITS,_Digits);
   return(0);
  }
//+------------------------------------------------------------------+
//| Custom indicator iteration function                              |
//+------------------------------------------------------------------+
int OnCalculate(const int rates_total,
                const int prev_calculated,
                const datetime &time[],
                const double &open[],
                const double &high[],
                const double &low[],
                const double &close[],
                const long &tick_volume[],
                const long &volume[],
                const int  &spread[])
  {
   int i,j,k,start;
   double s,t,alp,gam,phi,sb,sg,e,f,a,a1,a2;

   if(rates_total<NDat){Print("Error: Not enough bars for calculation!"); return(0);}
   if(prev_calculated==rates_total)return(rates_total); // New tick but not new bar
   start=rates_total-NDat;
//-----------------------
   PlotIndexSetInteger(0,PLOT_DRAW_BEGIN,rates_total-NDat);
   PlotIndexSetInteger(1,PLOT_DRAW_BEGIN,rates_total-NFORE);
   PlotIndexSetInteger(2,PLOT_DRAW_BEGIN,rates_total-NFORE);
   PlotIndexSetInteger(3,PLOT_DRAW_BEGIN,rates_total-NFORE);

   for(i=0;i<NDat;i++)Data[i]=open[rates_total-NDat+i]; // Input data
   Es.CalcPar(Data);                                    // Optimization of parameters
   s=Es.GetPar(0); t=Es.GetPar(1); gam=Es.GetPar(2);
   phi=Es.GetPar(3); sb=Es.GetPar(4); sg=Es.GetPar(5);
//----
   a=phi; Damp[0]=phi;
   for(j=1;j<NFORE;j++){a=a*phi; Damp[j]=Damp[j-1]+a;}  // Phi table
//----
   f=s+phi*t;
   for(i=0;i<NDat;i++) // History
     {
      e=Data[i]-f; Err[i]=e;
      alp=0.05+0.9/(1+MathExp(sb+sg*e*e));               // 0.05 < Alpha < 0.95
      a1=alp*e; a2=phi*t; s=s+a2+a1; t=a2+gam*a1;
      f=(s+phi*t); Hist[start+i]=f;                      // History
     }
   for(j=0;j<NFORE;j++)Fore[rates_total-NFORE+j]=s+Damp[j]*t;  // Forecast
//----
   a=0;
   for(i=0;i<NDat;i++)a+=Err[i];
   a/=NDat;
   for(i=0;i<NDat;i++)Err[i]-=a;                       // alignment of the array of errors
//----
   f=Es.GetPar(0)+phi*Es.GetPar(1);
   for(i=0;i<NBOOT+NFORE;i++) // Resampling
     {
      j=(int)(NDat*Rnd.Rand_01());
      if(j>NDat-1)j=NDat-1;
      e=Err[j];
      BSDat[i]=f+e;
      alp=0.05+0.9/(1+MathExp(sb+sg*e*e));               // 0.05 < Alpha < 0.95
      a1=alp*e; a2=phi*t; s=s+a2+a1; t=a2+gam*a1;
      f=s+phi*t;
     }
//----
   for(j=0;j<NFORE;j++) // Prediction intervals
     {
      s=Es.GetPar(0); t=Es.GetPar(1);
      f=s+phi*t;
      for(i=0,k=0;i<NBOOT;i++,k++)
        {
         BSErr[i]=BSDat[i+j]-(s+Damp[j]*t);
         e=BSDat[i]-f;
         a1=alp*e; a2=phi*t; s=s+a2+a1; t=a2+gam*a1;
         f=(s+phi*t);
        }
      ArraySort(BSErr);
      Conf1[rates_total-NFORE+j]=Fore[rates_total-NFORE+j]+BSErr[249];
      Conf2[rates_total-NFORE+j]=Fore[rates_total-NFORE+j]+BSErr[9749];
     }
   return(rates_total);
  }
//-----------------------------------------------------------------------------------
For better demonstration purposes, the indicator was executed, to the extent possible, as a straight-line code. No optimization was intended while coding it.
Figures 1 and 2 demonstrate the operation results of the indicator for two different cases.

Figure 1. First operation example of the ForecastES.mq5 indicator

Figure 2. Second operation example of the ForecastES.mq5 indicator
Figure 2 clearly shows that the 95% forecast confidence interval is asymmetric. This is due to the fact that the input sequence contains considerable outliers that resulted in asymmetric distribution of the forecast errors.
Websites www.mql4.com and www.mql5.com earlier provided extrapolator indicators . Let us take one of those - ar_extrapolator_of_price.mq5 and set its parameter values as shown in Figure 3 to compare its results with the results obtained using the indicator we developed.

Figure 3. Settings of the ar_extrapolator_of_price.mq5 indicator
The operation of these two indicators was compared visually on different time frames for EURUSD and USDCHF. On the surface, it seems that the direction of the forecast by both indicators coincides in the majority of cases. However, in longer observations, one may come across serious divergences. That being said, ar_extrapolator_of_price.mq5 will always produce a more broken forecast line.
An example of simultaneous operation of ForecastES.mq5 and ar_extrapolator_of_price.mq5 indicators is shown in Figure 4.

Figure 4. Comparison of the forecast results
The forecast produced by the ar_extrapolator_of_price.mq5 indicator is displayed in Figure 4 as a solid orange-red line.
Conclusion
Summary of the results pertaining to this and the previous article:
- Exponential smoothing models used in time series forecasting were introduced;
- Programming solutions for implementation of the models were proposed;
- A quick insight into the issues related to selection of the optimal initial values and model parameters was given;
- A programming implementation of the algorithm for finding the minimum of a function of several variables using Powell's method was provided;
- Programming solutions for parameter optimization of the forecasting model using the input sequence were proposed;
- Some simple examples of upgrading the forecasting algorithm were demonstrated;
- A method for estimating forecast confidence intervals using bootstrapping and quantiles was briefly outlined;
- The forecast indicator ForecastES.mq5 was developed containing all the methods and algorithms described in the articles;
- A few links to the articles, magazines and books were given pertaining to this subject.
Concerning the resulting indicator ForecastES.mq5, it should be noted that the optimization algorithm employing Powell's method may in certain cases fail to determine the minimum of the objective function with a given accuracy. This being the case, the maximum permissible number of iterations will be reached and a relevant message will appear in the log. This situation is however not processed in any way in the code of the indicator which is quite acceptable for demonstration of the algorithms set forth in the article. However, when it comes to serious applications, such instances shall be monitored and processed in one way or another.
To further develop and enhance the forecast indicator, we could suggest using several different forecasting models simultaneously at each step with a view to further selecting of one of them using e.g. the Akaike's Information Criterion. Or in case of using several models similar in nature, to calculate the weighted average value of their forecast results. The weighting coefficients in this case can be selected depending on the forecast error coefficient of each model.
The subject of forecasting time series is so broad that unfortunately these articles have barely scratched the surface of some of the pertaining issues. It is hoped that these publications will help to draw the reader's attention to the issues of forecasting and future works in this area.
References
- "Time Series Forecasting Using Exponential Smoothing".
- Yu. P. Lukashin. Adaptive Methods for Short-Term Forecasting of Time Series: Textbook. - М.: Finansy i Statistika, 2003.-416 pp.
- S.V. Bulashev. Statistics for Traders. - М.: Kompania Sputnik +, 2003. - 245 pp.
- Everette S. Gardner Jr., Exponential Smoothing: The State of the Art – Part II. June 3, 2005.
- James W. Taylor, Smooth Transition Exponential Smoothing. Journal of Forecasting, 2004, Vol. 23, pp. 385-394.
- James W. Taylor, Volatility Forecasting with Smooth Transition Exponential Smoothing. International Journal of Forecasting, 2004, Vol. 20, pp. 273-286.
- Alysha M De Livera. Automatic Forecasting with a Modified Exponential Smoothing State Space Framework. 28 April 2010, Department of Econometrics and Business Statistics, Monash University, VIC 3800 Australia.
- Rob J Hyndman et al. Prediction Intervals for Exponential Smoothing Using Two New Classes of State Space Models. 30 January 2003.
- The Quantile Journal. issue No. 3, September 2007.
- http://ru.wikipedia.org/wiki/Квантиль
- "Analysis of the Main Characteristics of Time Series".
Translated from Russian by MetaQuotes Ltd.
Original article: https://www.mql5.com/ru/articles/346
Warning: All rights to these materials are reserved by MetaQuotes Ltd. Copying or reprinting of these materials in whole or in part is prohibited.
This article was written by a user of the site and reflects their personal views. MetaQuotes Ltd is not responsible for the accuracy of the information presented, nor for any consequences resulting from the use of the solutions, strategies or recommendations described.

 Multiple Regression Analysis. Strategy Generator and Tester in One
 Trademinator 3: Rise of the Trading Machines
 Simple Trading Systems Using Semaphore Indicators
 Promote Your Development Projects Using EX5 Libraries
- Free trading apps
- Over 8,000 signals for copying
- Economic news for exploring financial markets
You agree to website policy and terms of use
Victor, don't you have any modification of indicators with history shift? Not only for the last bar. I would like to roughly estimate the efficiency of the methods you have implemented.
No, I have not made shifted indicators.
In the ForecastES.mq5 file the detected errors have been corrected. The updated ForecastES.mq5 file is located in the Fore.zip archive as before.
New article Time Series Forecasting Using Exponential Smoothing (continued) is published:
Author: Victor
I have tried many times to search for this modified new indicator in the Code base section of the MT5 but I couldn't found it.
Can you please add it into the code base of MT5 so I can download it easy and test it? Or please provide me the modified indicator and how to download it into my MT5?
Do you have the same for MT4?
Any on can help please/
Thank you
Forum on trading, automated trading systems and testing trading strategies
Discussion of article "Time Series Forecasting Using Exponential Smoothing"
newdigital, 2014.06.06 21:48
Becoming a Fearless Forex Trader
- Must You Know What Will Happen Next?
- Is There a Better Way?
- Strategies When You Know That You Don’t Know
“Good investing is a peculiar balance between the conviction to follow your ideas and the flexibility to recognize when you have made a mistake.”-Michael Steinhardt
"95% of the trading errors you are likely to make will stem from your attitudes about being wrong, losing money, missing out, and leaving money on the table – the four trading fears"
-Mark Douglas, Trading In the Zone
Many traders become enamored with the idea of forecasting. The need for forecasting seems to be inherent to successful trading. After all, you reason, I must know what will happen next in order to make money, right? Thankfully, that’s not right and this article will break down how you can trade well without knowing what will happen next.
Must You Know What Will Happen Next?
While knowing what would happen next would be helpful, no one can know for sure. The reason that insider trading is a crime that is often tested in equity markets can help you see that some traders are so desperate to know the future that their willing to cheat and pay a stiff fine when caught. In short, it’s dangerous to think in terms of a certain future when your money is on the line and best to think of edges over certainties when taking a trade.
The problem with thinking that you must know what the future holds for your trade, is that when something adverse happens to your trade from your expectations, fear sets in. Fear in and of itself isn’t bad. However, most traders with their money on the line, will often freeze and fail to close out the trade.
If you don’t need to know what will happen next, what do you need? The list is surprisingly short and simple but what’s more important is that you don’t think you know what will happen because if you do, you’ll likely overleverage and downplay the risks which are ever-present in the world of trading.
- A Clean Edge That You’re Comfortable Entering A Trade On
- A Well Defined Invalidation Point Where Your Trade Set-Up No Longer
- A Potential Reversal Entry Point
- An Appropriate Trade Size / Money Management
Is There a Better Way?Yesterday, the European Central Bank decided to cut their refi rate and deposit rate. Many traders went into this meeting short, yet EURUSD covered ~250% of its daily ATR range and closed near the highs, indicating EURUSD strength. Simply put, the outcome was outside of most trader’s realm of possibility and if you went short and were struck by fear, you likely did not close out that short and were another “victim of the market”, which is another way of saying a victim of your own fears of losing.
So what is the better way? Believe it or not, it’s to approach the market, understanding how emotional markets can be and that it is best not to get tied up in the direction the market “has to go”. Many traders will hold on to a losing trade, not to the benefit of their account, but rather to protect their ego. Of course, the better path to trading is to focus on protecting your account equity and leaving your ego at the door of your trading room so that it does not affect your trading negatively.
Strategies When You Know That You Don’t Know
There is one commonality with traders who can trade without fear. They build losing trades into their approach. It’s similar to a gambit in chess and it takes away the edge and strong-hold that fear has on many traders. For those non-chess players, a gambit is a play in which you sacrifice a low-value piece, like a pawn, for the sake of gaining an advantage. In trading, the gambit could be your first trade that allows you to get a better taste of the edge you’re sensing at the moment the trade is entered.
James Stanley’s USD Hedge is a great example of a strategy that works under the assumption that one trade will be a loser. What’s the significance of this? It pre-assumes the loss and will allow you to trade without the fear that plagues so many traders. Another tool that you can use to help you define if the trend is staying in your favor or going against you is a fractal.
If you look outside of the world of trading and chess, there are other businesses that presume a loss and therefore are able to act with a clear head when a loss comes. Those businesses are casinos and insurance companies. Both of these businesses presume a loss and work only in line with a calculated risk, they operate free of fear and you can as well if you presume small losses as part of your strategy.
Another great Mark Douglas quote:
“The less I cared about whether or not I was wrong, the clearer things became, making it much easier to move in and out of positions, cutting my losses short to make myself mentally available to take the next opportunity.” -Mark Douglas
Happy Trading!
The source