
Learn how to design a trading system by Volumes
Introduction
Welcome to this new article in our series about learning how to design a trading system based on the most popular technical indicator. Here is a new important technical indicator that gives us insights about a different perspective in the market - the Volumes indicator. We will cover this indicator through the following topics:
Here we will learn what the volume is and what it measures. We will find out how we can use it in our trading and how it can be useful for us by sharing some simple strategies based on the main concept behind it. After that, we will learn how to design a step-by-step blueprint for each mentioned strategy to help us to move forward to design a trading system based on mentioned strategies. This step is a very important to design any trading system. Then, we will come to the most interesting part which is the Volumes trading system as we will learn how to turn all that we mentioned or even any related insightful idea into a trading system by MQL5 to generate what we need based on these strategies automatically to help us ease, improve, or enhance our trading journey.
So, we will use MQL5 (MetaQuotes Language) which is built into the MetaTrader 5 trading terminal. If you want to know more about how to download and use it, read the Writing MQL5 code in the MetaEditor topic from the previous article for more information. Also, it is very useful for your learning to apply what you learn as it will enhance and deepen your understanding of the topic. Practice is a very important factor in any learning process.
Disclaimer: All information is provided 'as is' only for educational purposes and is not prepared for trading purposes or advice. The information does not guarantee any kind of result. If you choose to use these materials on any of your trading accounts, you will do that at your own risk and you will be the only responsible.
Let us jump into topics to learn a new tool that can be useful for our trading.
Volumes definition
The volumes indicator in the Forex market indicates the number of price changes during a specific time, i.e. actually traded volumes by identifying contracts, money, units, etc. The volume indicator can give us an indication of the supply and demand or it is an indication of the liquidity in the market. So, if there is a high volume, this will be an indication of the height of demand in case of going up or supply in case of going down. We can say that the volume can be very useful as it will be a confirmation of the trend. If you want to know more about the trend, you can read the trend definition topic from the previous article.
The volume goes with the trend. This is a very useful tool to be used to confirm if the current movement will be strong or if there is a weakness. It is better to see that during the uptrend, the volume will increase with up moves and decrease with the downward correction. During the downtrend, the volume will increase with down moves and it will be a significant signal but sometimes we can find these down moves without high volume as prices can fall without volume. In other words, it is not necessary to see a high volume with down movements in the downtrend. In case of a bullish correction during the downtrend, the volume will decrease.
The volume can give us an indication that there is a weakness in the current trend in case of divergences. Divergences mean that we find that the volume moves in the opposite direction of the price not confirming this price direction.
The same as we mentioned about its calculation before:
In the Forex market:
Volumes = number of price changes within a specific period of time
In the stock market:
Volume = trading volume * price
Example: if we have 1000 shares trading volume of a stock at a price of $10. So, the volume will be the same as the following:
Volume = 1000 * $10 = $10,000
There is a difference here because of the decentralization in the Forex market, unlike the stock market.
We do not need to calculate it manually as we can find it in the MetaTrader 5. All you need to do is choose it among the available indicators:
Insert --> Indicators --> Volumes --> Volumes
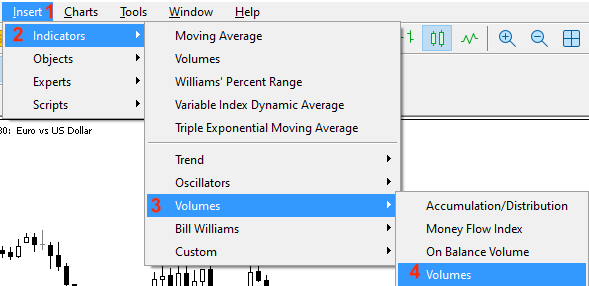
After choosing the Volumes indicator the same as step four in the previous figure, the window of the volumes indicator is opened:
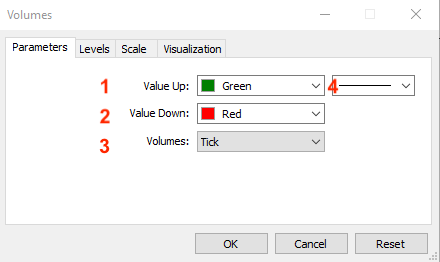
1. Up volume bar color.
2. Down volume bar color.
3. Applied volume (Tick or Real).
4. Bar thickness.
After determining the previous parameters, it is attached to the chart:
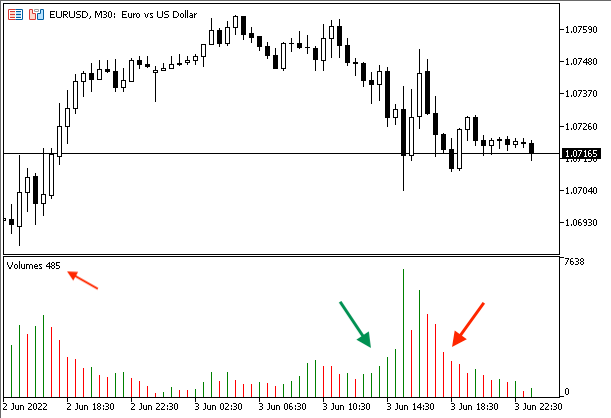
Green means that the current bar is greater than the previous bar but red means that the current bar is less than the previous one.
Volumes strategy
In this part, we will mention simple volume strategies to understand how the volumes indicator can be used. For sure, you can find that these strategies need optimization and this is normal as the main objective of them is to understand how the volumes indicator can be used based on its concept and how to design a trading system based on its basics. So, you have to test any of these strategies before using them on your real account.
- Strategy one: Vol - Movement:
Based on this strategy, we need to compare between the current volume value and the previous one to decide the suitable signal based on that. If the current is greater than the previous, this will be a signal of volumes increasing. If the current is less than the previous, this will be a signal volumes decreased.
Simply,
Current volume > Previous volume --> Volumes increased.
Current volume < Previous volume --> Volumes decreased.
- Strategy two: Vol - Strength:
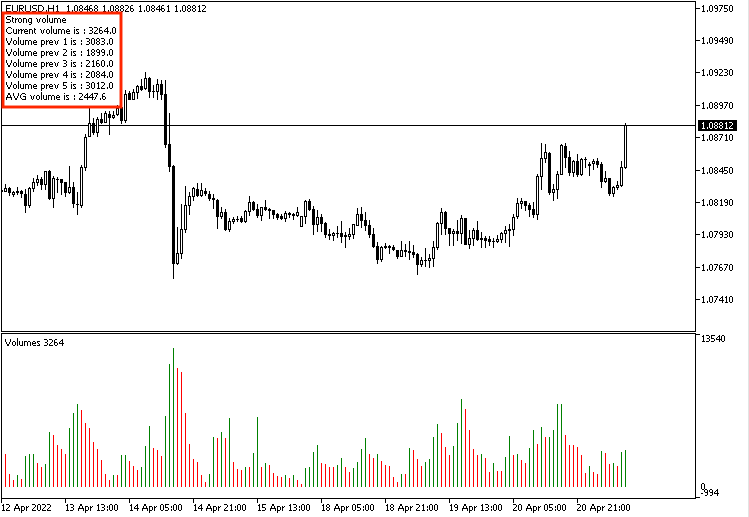
Based on this strategy, we need to compare between the current volume value and the average of the previous five values to decide the strength of this volumes indicator. If the current value is above the average, it will be a signal of a strong volume. If the current is below the average, it will be a signal of a weak volume.
So,
Current > AVG --> strong volume
Current < AVG --> weak volume
- Strategy three: Price & Vol - Uptrend:
According to this strategy, during the uptrend, we will compare the current and previous highs to the current and previous volume values to decide if there is a buy signal or there is no signal. If the current high is above the previous one and the current volume is above the previous, it will be a buy signal but if the current high is above the previous and the current volume is below the previous volume, it will be no signal.
Current high > previous high && current volume > previous volume --> Buy signal during uptrend
- Strategy four: Price & Vol - Downtrend:
This strategy will be the opposite of the previous one, during the downtrend, we will compare the current and previous lows to the current and previous volume values to decide if there is a short signal or if there is no signal. If the current low is below the previous one and the current volume is above the previous one, it will be a short signal but if the current low is below the previous one and the current volume is below the previous volume, it will be no signal.
Current low < previous low && current volume > previous volume --> Short signal during downtrend
- Strategy five: MA & Vol strategy:
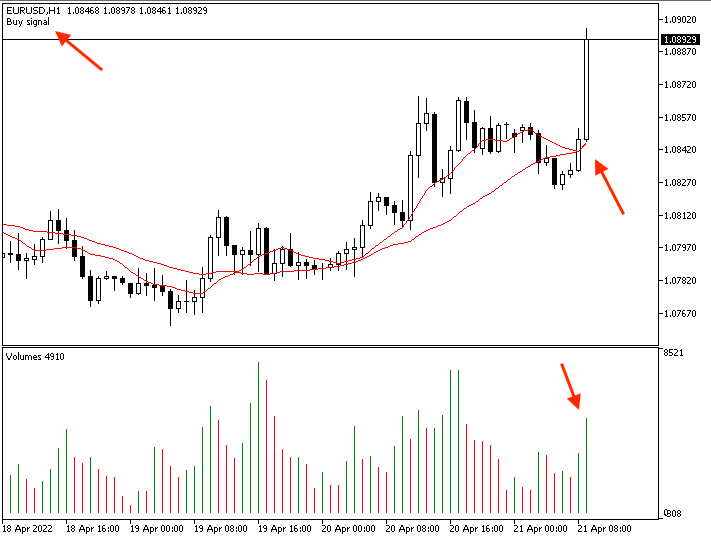
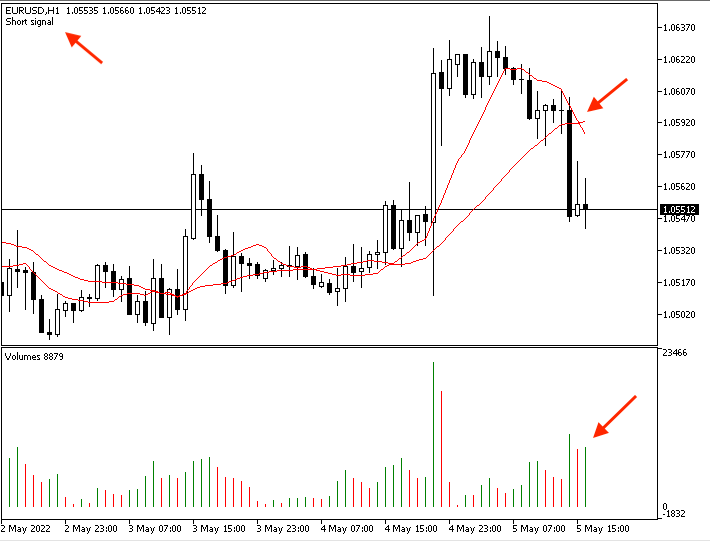
According to this strategy, we will compare two lengths of Moving Averages one is short and the other is long and the values of the current and previous volume to decide if there is a buy or short signal. If the shorter MA is less than the longer MA, then the shorter becomes above the longer and at the same time the current volume is above the previous volume, it will be a buy signal. If the shorter MA is above the longer, then the shorter becomes below the longer and at the same time the current volume is above the previous volume, it will be a short signal.
Short MA < Long MA, then Short MA > Long MA && Current volume > previous volume --> Buy signal
Short MA > Long MA, then Short MA < Long MA && Current volume > previous volume --> Short signal
Volumes strategy blueprint
In this part, we will design a blueprint for each strategy, the reason for the blueprint design is to help us organize what we want to do to create a trading system. This step is very important and essential to arrange our ideas in addition to identifying what we want to do step by step.
First, we will create a blueprint for a simple trading system that will generate the Volumes indicator current value only as a comment on the chart. We need the system to check the volumes indicator values in every tick and then return the current value on the chart as a comment. The following is a step-by-step blueprint to create this trading system.
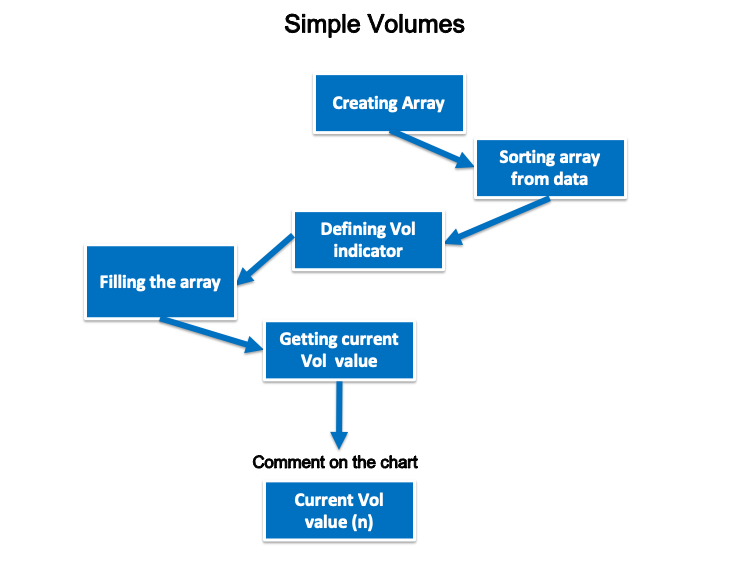
- Strategy one: Vol - Movement:
According to this strategy, we need to create a simple trading system that will generate signals to inform us about the movement of the volume (if it is increasing or decreasing) by comparing two values of the current and previous volume indicator. So, we need the system to check these two values at every tick, then inform that the volume is increasing if the current volume is greater than the previous volume or inform that the volume is decreasing if the current volume is lower than the previous one. The following is a step-by-step blueprint to create this trading system.
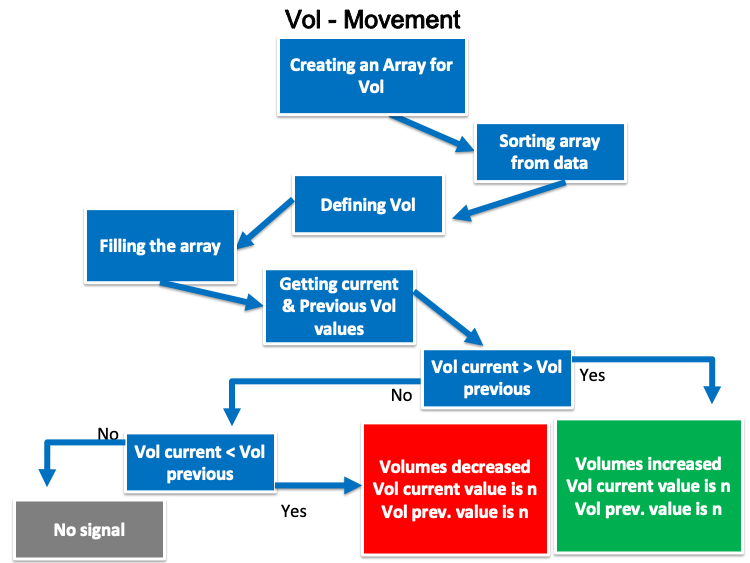
- Strategy two: Vol - Strength:
According to this strategy, we need to create a simple trading system to generate signals to inform us about the strength of Volume based on a comparison between current Volumes indicator value and the average of previous five values of it. So, we need to let the system check all these values, then calculate the average of the previous five Vol values at every tick. After that a suitable signal is generated, if the current Vol value is greater than the average volume value, the generated signal will be strong volume, current volume, previous five values of volume values, and the average value as comment on the chart and value will be in a separate line. If the current value is less the average value, the generated value will be weak volume, current volume value, the previous five values of volume, and the average value as comment on the chart each value in a separate line. The following is a step-by-step blueprint to create this trading system:
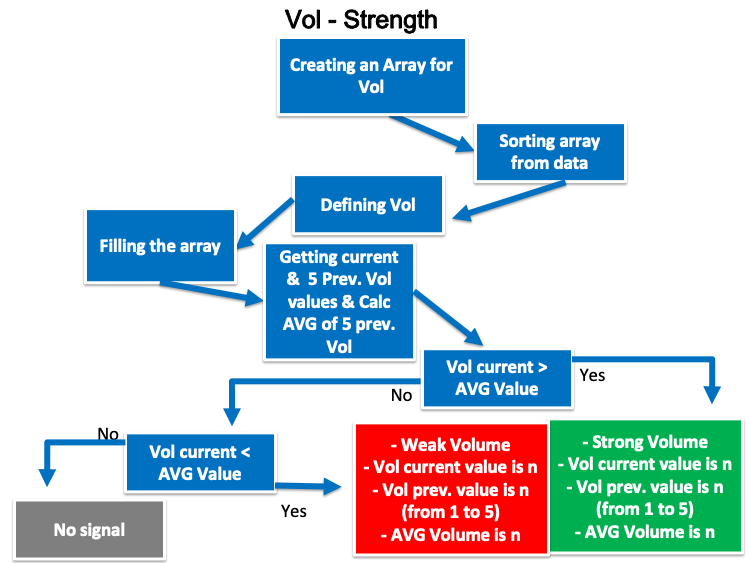
- Strategy three: Price & Vol - Uptrend:
According to this strategy, we need to create a simple trading system that works during the uptrend to generate a buy signal after checking tick by tick current and previous highs, in addition to current and previous volumes indicator values. Based on this strategy, we need it to generate a buy signal, Current high, previous high, current volume, and previous volume comment on the chart and each value in a separate line, if the current high value is greater than the previous one and the current volume value is greater than the previous one or to generate only all the previous kinds of values without any signal for buying, if the current high is greater than the previous one and the current volume value is less than the previous one. The following is a step-by-step blueprint to create this trading system:
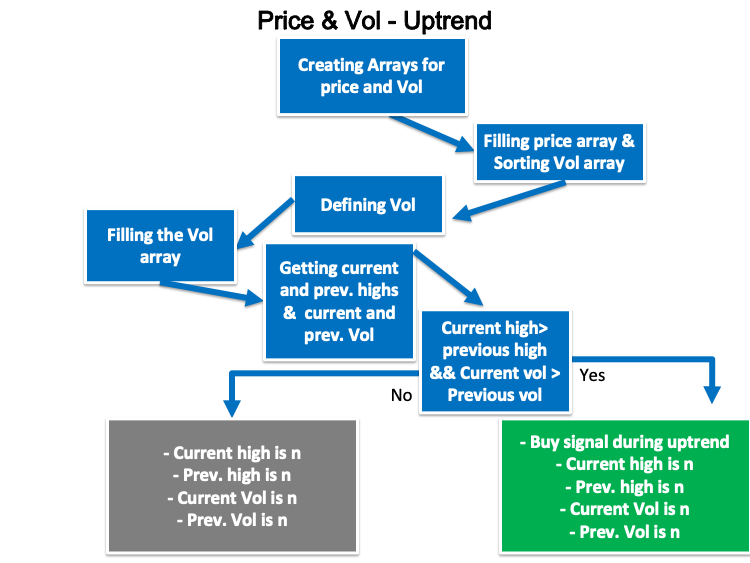
- Strategy four: Price & Vol - Downtrend:
This strategy will be the opposite of the previous one. We need to create a simple trading system that works during the downtrend to generate a short signal after checking tick by tick current and previous lows, in addition to current and previous volumes indicator values. Then, we need the system to generate a short signal, Current low, previous low, current volume, and previous volume as a comment on the chart and each value in a separate line, if the current low value is less than the previous one and the current volume value is greater than the previous one or to generate only all the previous kind of values without any signal for shorting, if the current low is less than the previous one and at the same time the current volume value is less than the previous one. We can see a step-by-step blueprint to create this trading system the same as the following:
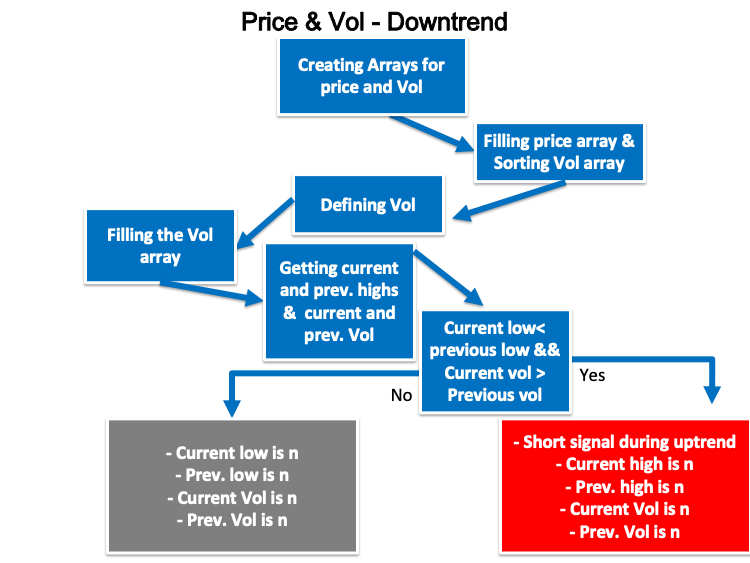
- Strategy five: MA & Vol strategy:
According to this strategy, we need to create a trading system that can check two indicators the volume and the moving average tick by tick to decide if there is a buy or short signal based on a comparison between two moving averages, one of them is short and the other is long to be the shorter one is greater than the longer one after being the shorter below the longer and at the same time the current volume value is greater than the previous one, in this case, we need the system to generate a buy signal. the second scenario is the shorter one is less than the longer MA after being the shorter is greater than the longer MA and at the same time the current volume value is greater than the previous, in this case, we need the system to generate a short signal. The following is a step by step blueprint for creating this kind of strategy:
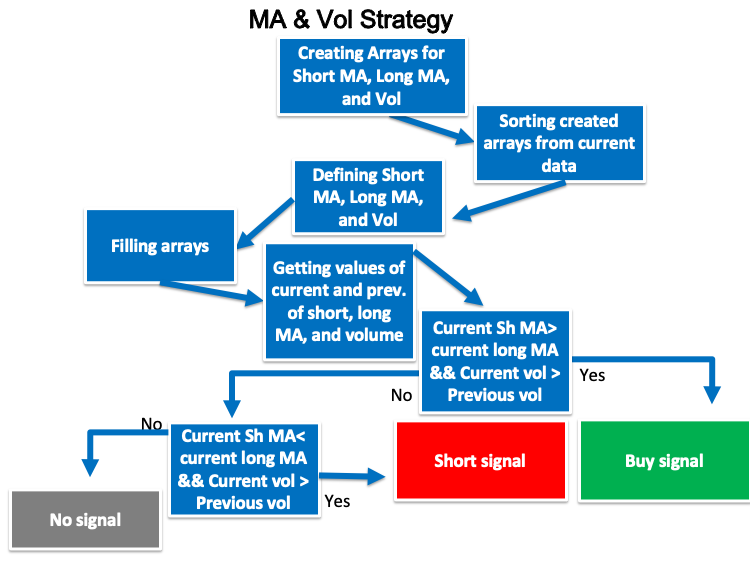
Volumes trading system
We came to the most interesting part in this article about how to translate all the previous ones to a trading system to give us signals automatically and accurately. We will design a trading system for each strategy but first we will design a trading system to generate the volume current value to be the base of each strategy.
- Creating an array for volume by using the "double" function.
double VolArray[]; - Sorting the array by using the ArraySetAsSeries function which returns a Boolean (true or false).
ArraySetAsSeries(VolArray,true);
- Defining the volume by using the iVolumes after creating a variable for VolDef. The iVolumes function returns the handle of the Volumes indicator and its parameters are (symbol, period, applied volume). We used (_Symbol) to be applicable for the current symbol, and (_period) to be applicable for the current time frame.
int VolDef=iVolumes(_Symbol,_Period,VOLUME_TICK);
- Filling the array by using the CopyBuffer function to get the data from the volumes indicator.
CopyBuffer(VolDef,0,0,3,VolArray);
- Calculate the volume value by using the NormalizeDouble function after creating a variable for VolValue. The NormalizeDouble function returns the double type value.
int VolValue=NormalizeDouble(VolArray[0],5);
- Creating the function of the comment of the Volumes indicator value by using the Comment function.
Comment("Volumes Value is: ",VolValue);
The following is the full code of the previous trading system:
//+------------------------------------------------------------------+
//|                                               Simple Volumes.mq5 |
//|                                  Copyright 2022, MetaQuotes Ltd. |
//|                                             https://www.mql5.com |
//+------------------------------------------------------------------+
#property copyright "Copyright 2022, MetaQuotes Ltd."
#property link      "https://www.mql5.com"
#property version   "1.00"
//+------------------------------------------------------------------+
void OnTick()
  {
//Create an array for Volume
   double VolArray[];

//sorting the array from the current data
   ArraySetAsSeries(VolArray,true);

//defining Volume
   int VolDef=iVolumes(_Symbol,_Period,VOLUME_TICK);

//filling the array
   CopyBuffer(VolDef,0,0,3,VolArray);

//calculating current vol value
   int VolValue=NormalizeDouble(VolArray[0],5);

//creating a comment with current vol value
   Comment("Volumes Value is: ",VolValue);
  }
//+------------------------------------------------------------------+
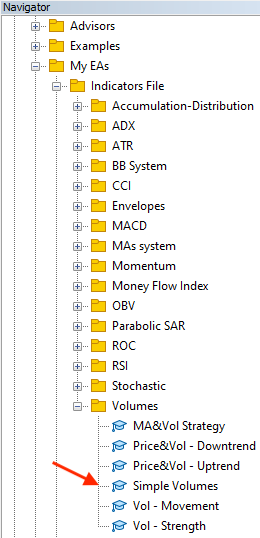
After compiling this code to be able to execute it in the MetaTrader 5, we will find it in the Navigator window:
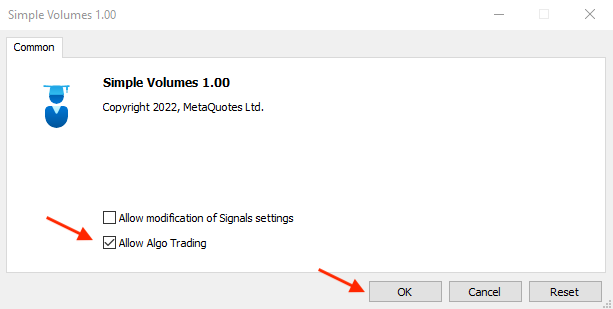
By double-clicking the file or dragging and dropping it on the chart, the EA window will appear:
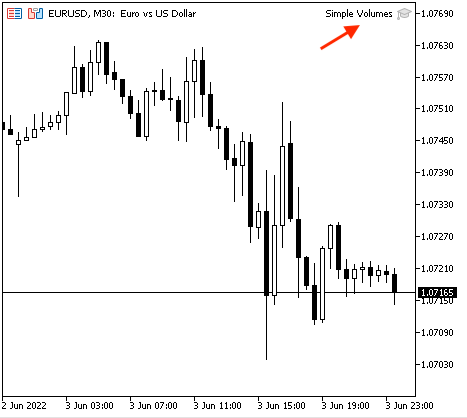
Then, we will find the EA attached to the chart:
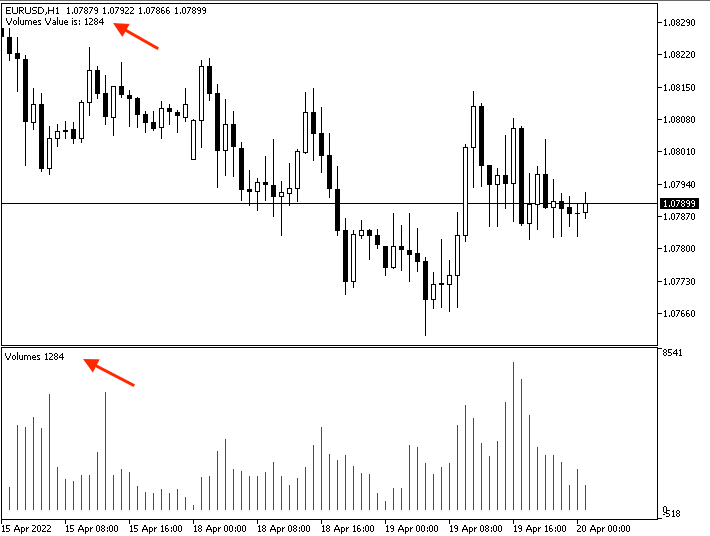
The following is an example of generated signals from testing:
- Strategy one: Vol movement:
To create a trading system that will alert us by a comment on the chart with the movement of the volumes indicator based on the comparison between the value of the current volume and the previous one, we will write our code as follows:
//+------------------------------------------------------------------+
//|                                               Vol - Movement.mq5 |
//|                                  Copyright 2022, MetaQuotes Ltd. |
//|                                             https://www.mql5.com |
//+------------------------------------------------------------------+
#property copyright "Copyright 2022, MetaQuotes Ltd."
#property link      "https://www.mql5.com"
#property version   "1.00"
//+------------------------------------------------------------------+
void OnTick()
  {
//Create an array for Volume
   double VolArray[];

//sorting the array from the current data
   ArraySetAsSeries(VolArray,true);

//defining Volume
   int VolDef=iVolumes(_Symbol,_Period,VOLUME_TICK);

//filling the array
   CopyBuffer(VolDef,0,0,3,VolArray);

//calculating current vol value
   double VolCurrentValue=NormalizeDouble(VolArray[0],5);
   double VolPrevValue=NormalizeDouble(VolArray[1],5);

//Conditions of vol movements
//Volume increasing
   if(VolCurrentValue>VolPrevValue)
     {
      Comment("Volumes increased","\n","Volumes current value is: ",VolCurrentValue,
              "\n","Volumes previous value is: ",VolPrevValue);
     }

//Volume decreasing
   if(VolCurrentValue<VolPrevValue)
     {
      Comment("Volumes decreased","\n","Volumes current value is: ",VolCurrentValue,
              "\n","Volumes previous value is: ",VolPrevValue);
     }
  }
//+------------------------------------------------------------------+
Differences in the code:
Calculating the current and previous values of Volumes:
   double VolCurrentValue=NormalizeDouble(VolArray[0],5);
   double VolPrevValue=NormalizeDouble(VolArray[1],5);
Conditions of the strategy:
Volumes indicator is increasing:
   if(VolCurrentValue>VolPrevValue)
     {
      Comment("Volumes increased","\n","Volumes current value is: ",VolCurrentValue,
              "\n","Volumes previous value is: ",VolPrevValue);
     }
Volumes indicator is declining:
   if(VolCurrentValue<VolPrevValue)
     {
      Comment("Volumes decreased","\n","Volumes current value is: ",VolCurrentValue,
              "\n","Volumes previous value is: ",VolPrevValue);
     }
After compiling this code, we will find the EA in the Navigator window:
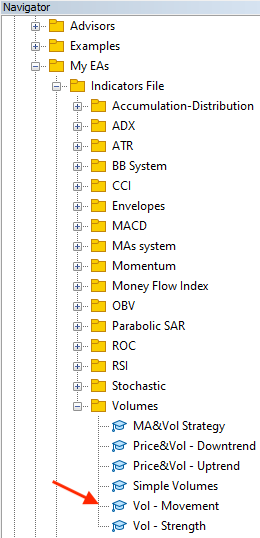
By double-clicking, the window will appear:
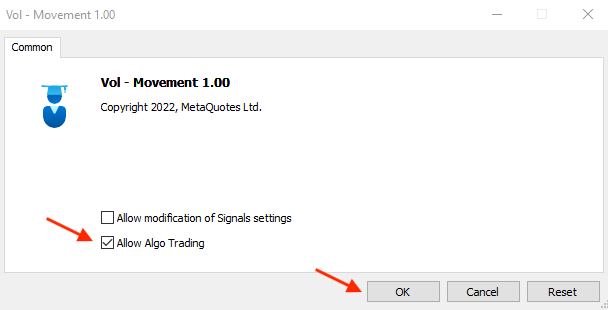
After ticking next to Allow Algo Trading and pressing OK, it will be attached to the chart:
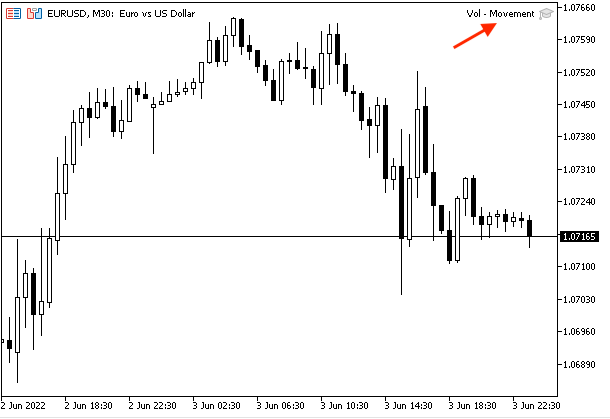
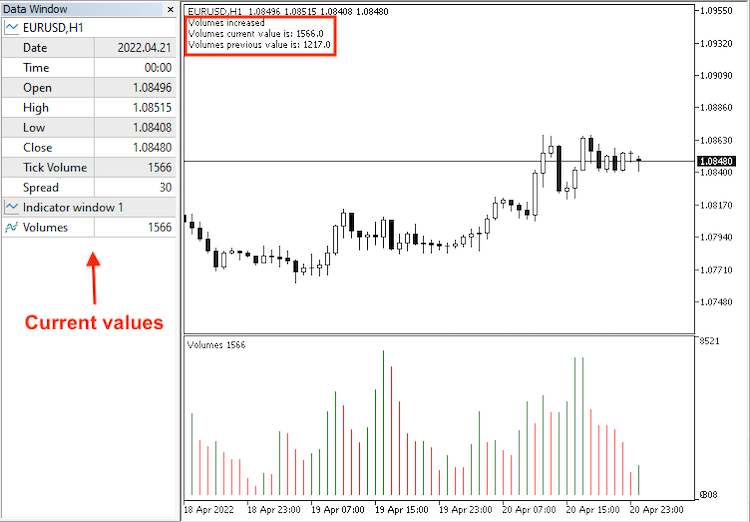
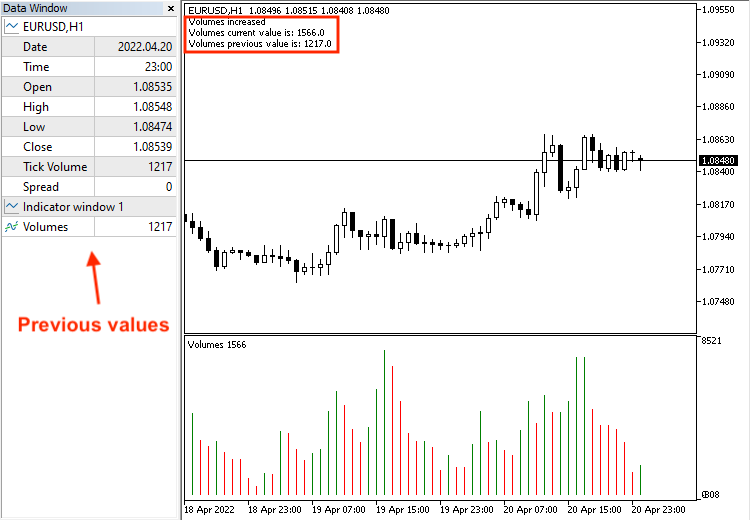
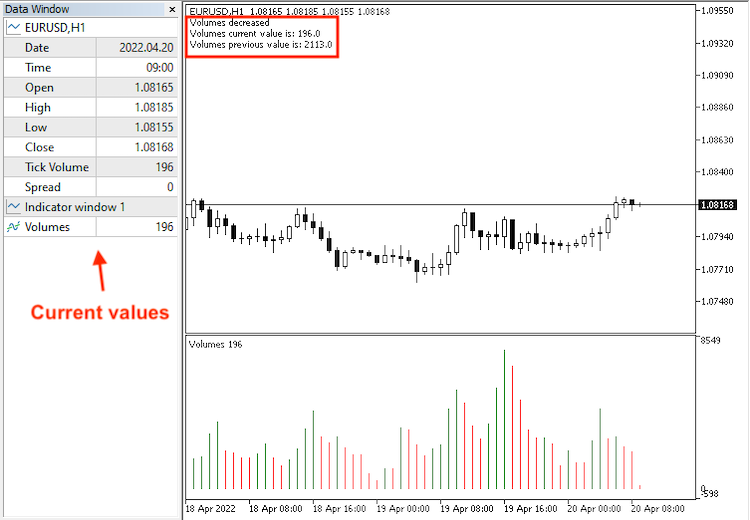
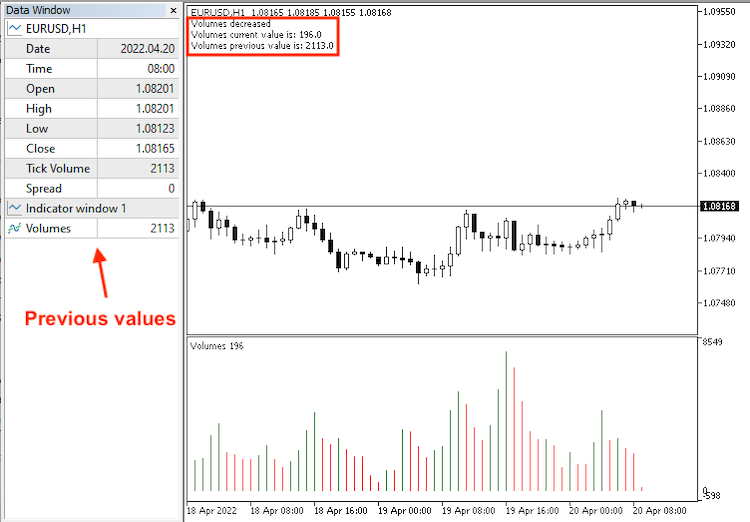
The following is an example of generated signals of the Vol - Movement strategy with the data window of the current and previous data:
The increasing of the volumes:
Current data window:
Previous data window:
The decreasing of the volumes:
Current data window:
Previous data window:
- Strategy two: Vol - Strength:
The following is the full code to create a trading system for this strategy to auto generate signals of the strength of the Volumes indicator based on a comparison between the current volumes indicator value and the previous one:
//+------------------------------------------------------------------+
//|                                               Vol - Strength.mq5 |
//|                                  Copyright 2022, MetaQuotes Ltd. |
//|                                             https://www.mql5.com |
//+------------------------------------------------------------------+
#property copyright "Copyright 2022, MetaQuotes Ltd."
#property link      "https://www.mql5.com"
#property version   "1.00"
//+------------------------------------------------------------------+
void OnTick()
  {
//Create an array for Volume
   double VolArray[];

//sorting the array from the current data
   ArraySetAsSeries(VolArray,true);

//defining Volume
   int VolDef=iVolumes(_Symbol,_Period,VOLUME_TICK);

//filling the array
   CopyBuffer(VolDef,0,0,11,VolArray);

//calculating current vol && 5 previous volume values
   double VolCurrentValue=NormalizeDouble(VolArray[0],5);
   double VolPrevValue1=NormalizeDouble(VolArray[1],5);
   double VolPrevValue2=NormalizeDouble(VolArray[2],5);
   double VolPrevValue3=NormalizeDouble(VolArray[3],5);
   double VolPrevValue4=NormalizeDouble(VolArray[4],5);
   double VolPrevValue5=NormalizeDouble(VolArray[5],5);


//calculating AVG of 5 previous volume values
   double VolAVGVal=((VolPrevValue1+VolPrevValue2+VolPrevValue3+VolPrevValue4+VolPrevValue5)/5);

//conditions of Volume strength based on comparing current to AVG
//strong volume
   if(VolCurrentValue>VolAVGVal)
     {
      Comment("Strong volume","\n","Current volume is : ",VolCurrentValue,"\n",
              "Volume prev 1 is : ",VolPrevValue1,"\n",
              "Volume prev 2 is : ",VolPrevValue2,"\n",
              "Volume prev 3 is : ",VolPrevValue3,"\n",
              "Volume prev 4 is : ",VolPrevValue4,"\n",
              "Volume prev 5 is : ",VolPrevValue5,"\n",
              "AVG volume is : ",VolAVGVal);
     }

//weak volume
   if(VolCurrentValue<VolAVGVal)
     {
      Comment("Weak volume","\n","Current volume is : ",VolCurrentValue,"\n",
              "Volume prev 1 is : ",VolPrevValue1,"\n",
              "Volume prev 2 is : ",VolPrevValue2,"\n",
              "Volume prev 3 is : ",VolPrevValue3,"\n",
              "Volume prev 4 is : ",VolPrevValue4,"\n",
              "Volume prev 5 is : ",VolPrevValue5,"\n",
              "AVG volume is : ",VolAVGVal);
     }
  }
//+------------------------------------------------------------------+
Differences in the code:
Calculating the current and previous five values of the Volumes indicator:
   double VolCurrentValue=NormalizeDouble(VolArray[0],5);
   double VolPrevValue1=NormalizeDouble(VolArray[1],5);
   double VolPrevValue2=NormalizeDouble(VolArray[2],5);
   double VolPrevValue3=NormalizeDouble(VolArray[3],5);
   double VolPrevValue4=NormalizeDouble(VolArray[4],5);
   double VolPrevValue5=NormalizeDouble(VolArray[5],5);
Calculating the average of the previous five Volumes indicator:
double VolAVGVal=((VolPrevValue1+VolPrevValue2+VolPrevValue3+VolPrevValue4+VolPrevValue5)/5);
Conditions of the strategy:
Strong volume:
   if(VolCurrentValue>VolAVGVal)
     {
      Comment("Strong volume","\n","Current volume is : ",VolCurrentValue,"\n",
              "Volume prev 1 is : ",VolPrevValue1,"\n",
              "Volume prev 2 is : ",VolPrevValue2,"\n",
              "Volume prev 3 is : ",VolPrevValue3,"\n",
              "Volume prev 4 is : ",VolPrevValue4,"\n",
              "Volume prev 5 is : ",VolPrevValue5,"\n",
              "AVG volume is : ",VolAVGVal);
     }
Weak volume:
   if(VolCurrentValue<VolAVGVal)
     {
      Comment("Weak volume","\n","Current volume is : ",VolCurrentValue,"\n",
              "Volume prev 1 is : ",VolPrevValue1,"\n",
              "Volume prev 2 is : ",VolPrevValue2,"\n",
              "Volume prev 3 is : ",VolPrevValue3,"\n",
              "Volume prev 4 is : ",VolPrevValue4,"\n",
              "Volume prev 5 is : ",VolPrevValue5,"\n",
              "AVG volume is : ",VolAVGVal);
     }
After compiling this strategy, we will find the EA in the Navigator window:
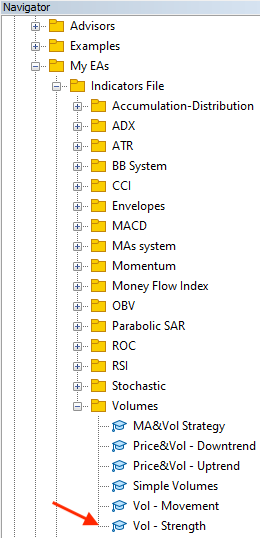
By dragging and dropping the file on the chart, the EA window will be opened:
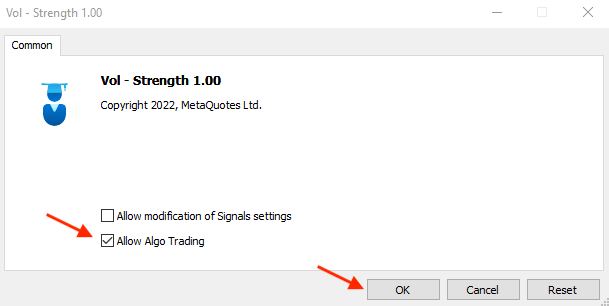
After clicking OK, it will be attached to the chart:
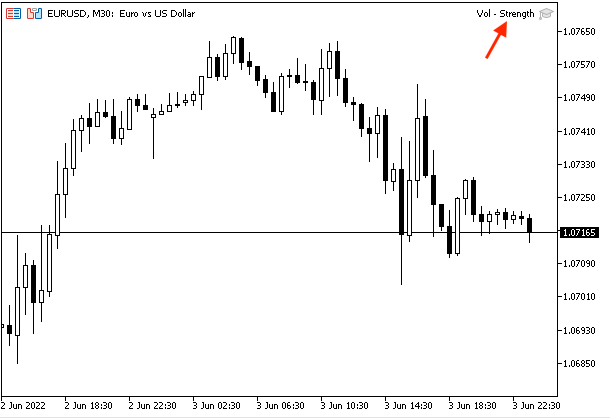
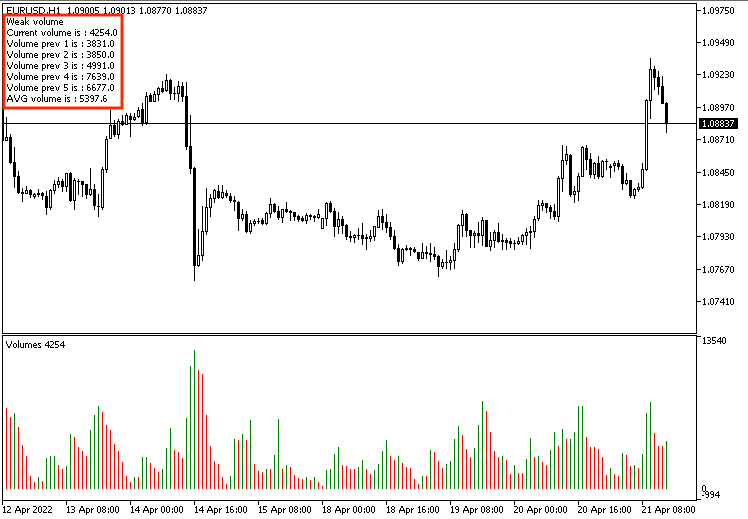
The following is an example of generated signals based on the strength of the volume:
Strong volume:
Weak volume:
- Strategy three: Price & Vol - uptrend:
The following is the full code of creating a trading system for this strategy:
//+------------------------------------------------------------------+
//|                                          Price&Vol - Uptrend.mq5 |
//|                                  Copyright 2022, MetaQuotes Ltd. |
//|                                             https://www.mql5.com |
//+------------------------------------------------------------------+
#property copyright "Copyright 2022, MetaQuotes Ltd."
#property link      "https://www.mql5.com"
#property version   "1.00"
//+------------------------------------------------------------------+
void OnTick()
  {
//Create arrays for price & Volume
   MqlRates PriceArray[];
   double VolArray[];

//filling price array with data
   int Data=CopyRates(_Symbol,_Period,0,3,PriceArray);

//sorting arrays from the current data
   ArraySetAsSeries(VolArray,true);

//defining Volume
   int VolDef=iVolumes(_Symbol,_Period,VOLUME_TICK);

//filling the array
   CopyBuffer(VolDef,0,0,3,VolArray);

//calculating the current and previous values of highs and volume
   double CurrentHighValue=NormalizeDouble(PriceArray[2].high,5);
   double PrevHighValue=NormalizeDouble(PriceArray[1].high,5);
   double VolCurrentValue=NormalizeDouble(VolArray[0],5);
   double VolPrevValue=NormalizeDouble(VolArray[1],5);

//Conditions of buy signal
//Buy signal
   if(CurrentHighValue>PrevHighValue&&VolCurrentValue>VolPrevValue)
     {
      Comment("Buy Signal during uptrend",
              "\n","Current high is: ",CurrentHighValue,"\n","Previous high is: ",PrevHighValue,
              "\n","Volume current value is: ",VolCurrentValue,"\n","Volumes previous value is: ",VolPrevValue);
     }

//no signal
   if(CurrentHighValue>PrevHighValue&&VolCurrentValue<VolPrevValue)
     {
      Comment("Current high is: ",CurrentHighValue,"\n","Previous high is: ",PrevHighValue,
              "\n","Volume current value is: ",VolCurrentValue,"\n","Volumes previous value is: ",VolPrevValue);
     }
  }
//+------------------------------------------------------------------+
Differences in the code:
In order to create arrays for volume and prices, we will use the "double" function for the volume array the same as what we did before, and the MqlRates for the prices array that stores price, volume and spread.
   MqlRates PriceArray[];
   double VolArray[];
Filling the price array by using the CopyRates function after creating an integer variable for Data:
int Data=CopyRates(_Symbol,_Period,0,3,PriceArray);
Calculating the current and previous values of highs and volume:
   double CurrentHighValue=NormalizeDouble(PriceArray[2].high,5);
   double PrevHighValue=NormalizeDouble(PriceArray[1].high,5);
   double VolCurrentValue=NormalizeDouble(VolArray[0],5);
   double VolPrevValue=NormalizeDouble(VolArray[1],5);
Conditions of the strategy based on highs and volume values:
Buy signal:
   if(CurrentHighValue>PrevHighValue&&VolCurrentValue>VolPrevValue)
     {
      Comment("Buy Signal during uptrend",
              "\n","Current high is: ",CurrentHighValue,"\n","Previous high is: ",PrevHighValue,
              "\n","Volume current value is: ",VolCurrentValue,"\n","Volumes previous value is: ",VolPrevValue);
     }
No signal:
   if(CurrentHighValue>PrevHighValue&&VolCurrentValue<VolPrevValue)
     {
      Comment("Current high is: ",CurrentHighValue,"\n","Previous high is: ",PrevHighValue,
              "\n","Volume current value is: ",VolCurrentValue,"\n","Volumes previous value is: ",VolPrevValue);
     }
After we compile this code, we will find the EA in the Navigator window:
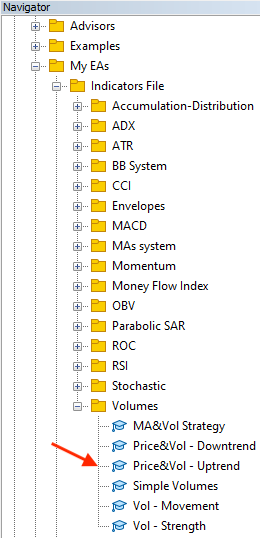
If we want to execute this EA to generate signals according to the above strategy, we will double-click the file to open its window:
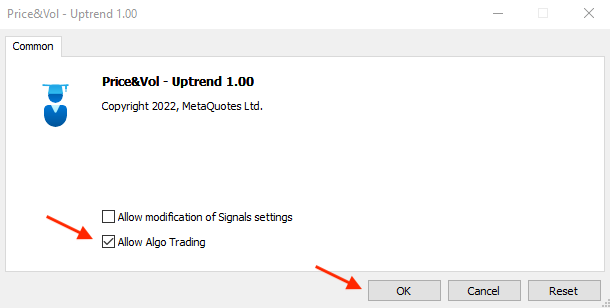
After clicking OK, the EA will be attached to the chart:
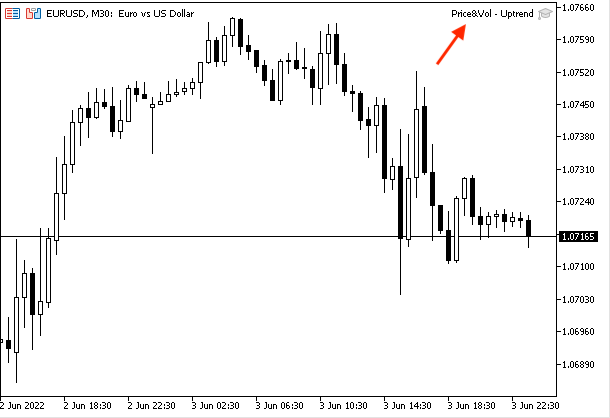
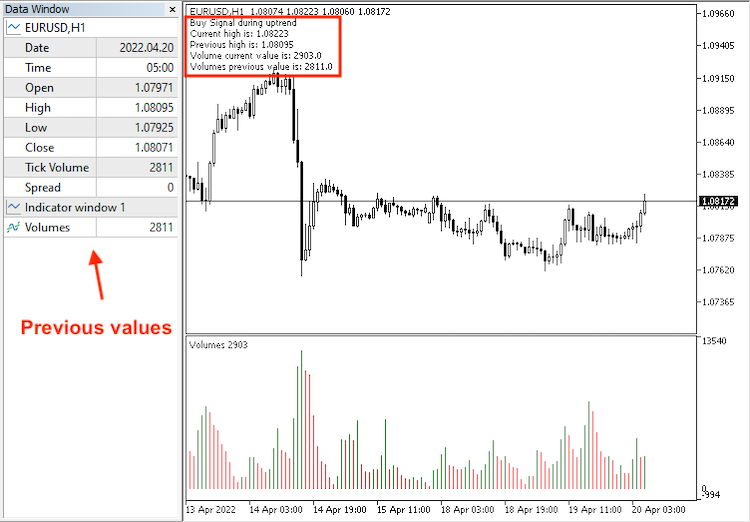
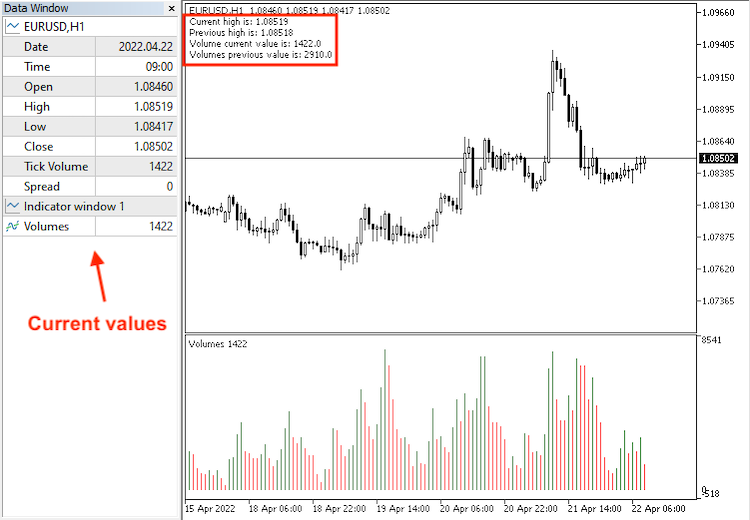
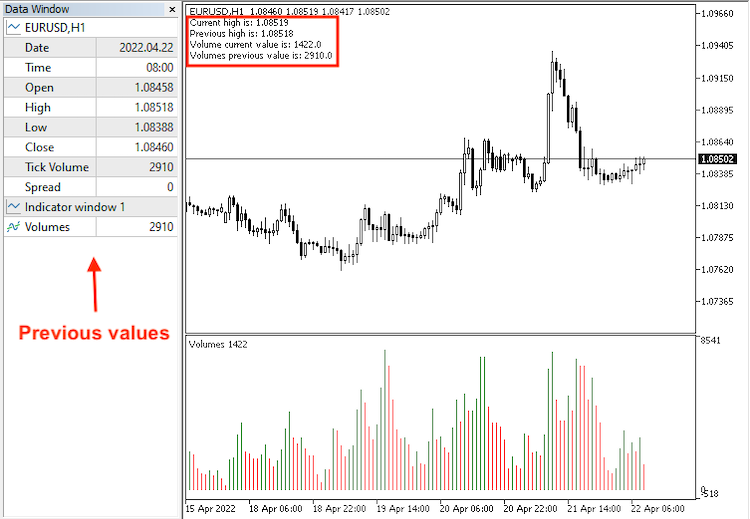
The following is an example of generated signals based on the Price and Vol - uptrend strategy with the data window:
Buy signal:
Current data:
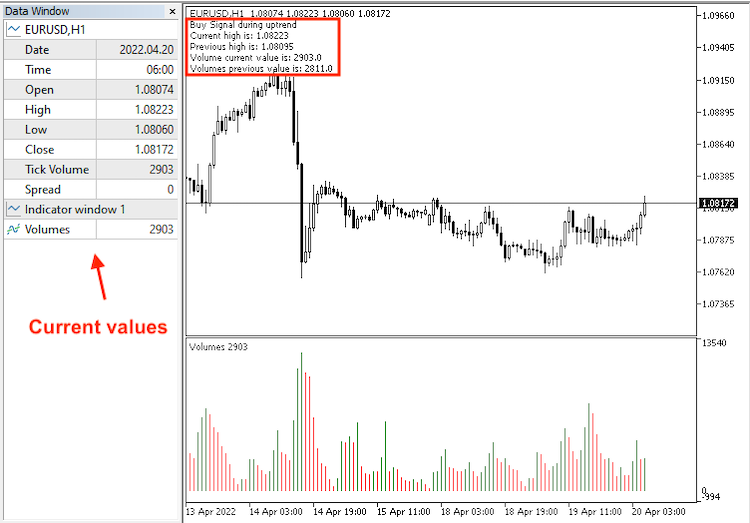
Previous data:
No signal:
Current data:
Previous data:
- Strategy four: Price & Vol - downtrend:
The full code to create a trading system based on this strategy will be the same as the following:
//+------------------------------------------------------------------+
//|                                        Price&Vol - Downtrend.mq5 |
//|                                  Copyright 2022, MetaQuotes Ltd. |
//|                                             https://www.mql5.com |
//+------------------------------------------------------------------+
#property copyright "Copyright 2022, MetaQuotes Ltd."
#property link      "https://www.mql5.com"
#property version   "1.00"
//+------------------------------------------------------------------+
void OnTick()
  {
//Create arrays for price & Volume
   MqlRates PriceArray[];
   double VolArray[];

//filling price array with data
   int Data=CopyRates(_Symbol,_Period,0,3,PriceArray);

//sorting arrays from the current data
   ArraySetAsSeries(VolArray,true);

//defining Volume
   int VolDef=iVolumes(_Symbol,_Period,VOLUME_TICK);

//filling the array
   CopyBuffer(VolDef,0,0,3,VolArray);

//calculating current and previous of lows and volume
   double CurrentLowValue=NormalizeDouble(PriceArray[2].low,5);
   double PrevLowValue=NormalizeDouble(PriceArray[1].low,5);
   double VolCurrentValue=NormalizeDouble(VolArray[0],5);
   double VolPrevValue=NormalizeDouble(VolArray[1],5);

//Conditions of short signal
//short signal
   if(CurrentLowValue<PrevLowValue&&VolCurrentValue>VolPrevValue)
     {
      Comment("Short Signal during downtrend",
              "\n","Current low is: ",CurrentLowValue,"\n","Previous low is: ",PrevLowValue,
              "\n","Volume current value is: ",VolCurrentValue,"\n","Volumes previous value is: ",VolPrevValue);
     }

//no signal
   if(CurrentLowValue<PrevLowValue&&VolCurrentValue<VolPrevValue)
     {
      Comment("Current low is: ",CurrentLowValue,"\n","Previous low is: ",PrevLowValue,
              "\n","Volume current value is: ",VolCurrentValue,"\n","Volumes previous value is: ",VolPrevValue);
     }
  }
//+------------------------------------------------------------------+
Difference in the code:
Conditions of generated signals based on the Price & Vol - downtrend strategy:
Short signal:
   if(CurrentLowValue<PrevLowValue&&VolCurrentValue>VolPrevValue)
     {
      Comment("Short Signal during downtrend",
              "\n","Current low is: ",CurrentLowValue,"\n","Previous low is: ",PrevLowValue,
              "\n","Volume current value is: ",VolCurrentValue,"\n","Volumes previous value is: ",VolPrevValue);
     }
No signal:
   if(CurrentLowValue<PrevLowValue&&VolCurrentValue<VolPrevValue)
     {
      Comment("Current low is: ",CurrentLowValue,"\n","Previous low is: ",PrevLowValue,
              "\n","Volume current value is: ",VolCurrentValue,"\n","Volumes previous value is: ",VolPrevValue);
     }
After compiling this code, the EA will be in the Navigator:
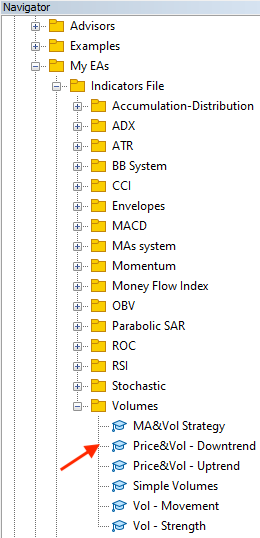
After double-clicking the file, the EA's window will appear:
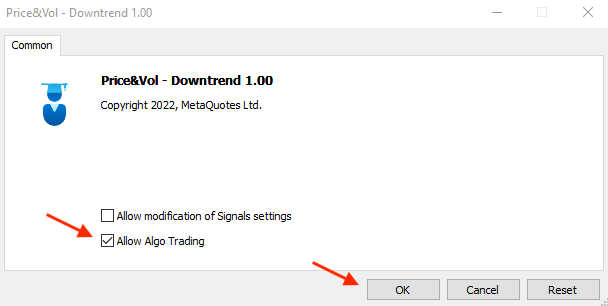
After clicking OK, the EA will be attached to the chart:
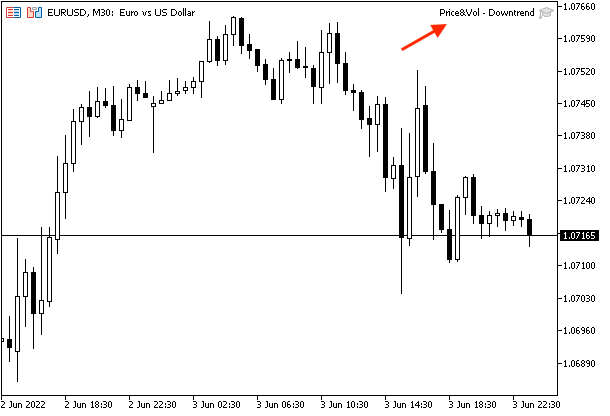
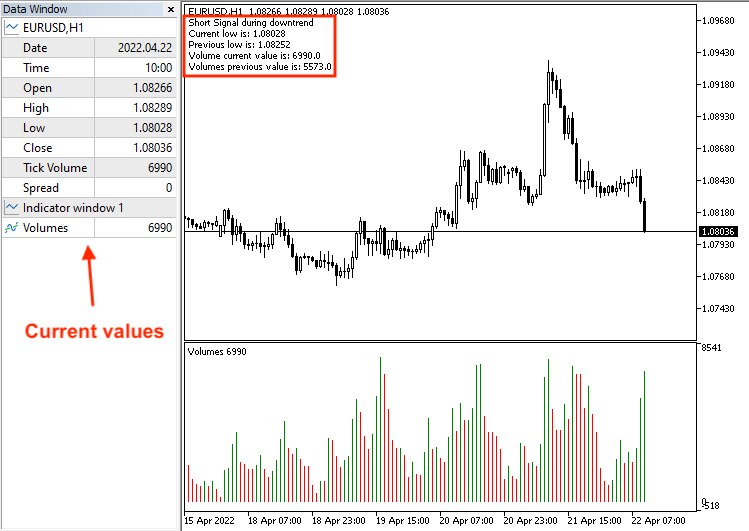
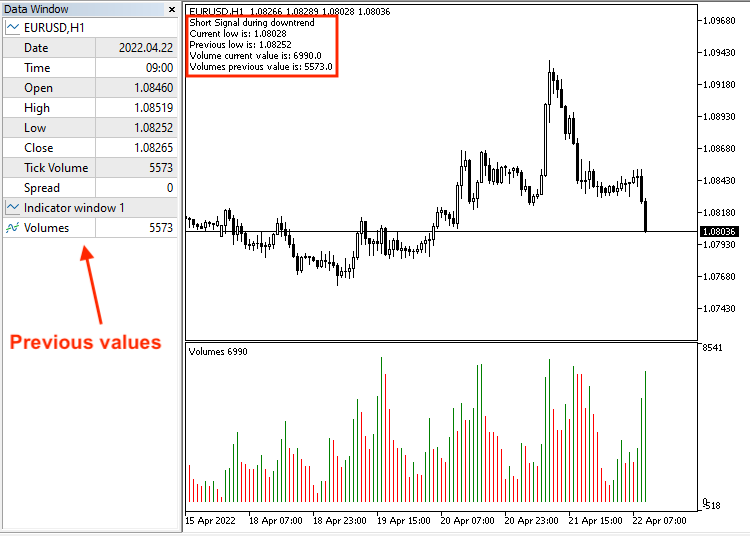
The following is an example of generated signals with the current and previous data window:
Short signal:
Current data:
Previous data:
No signal:
Current data:
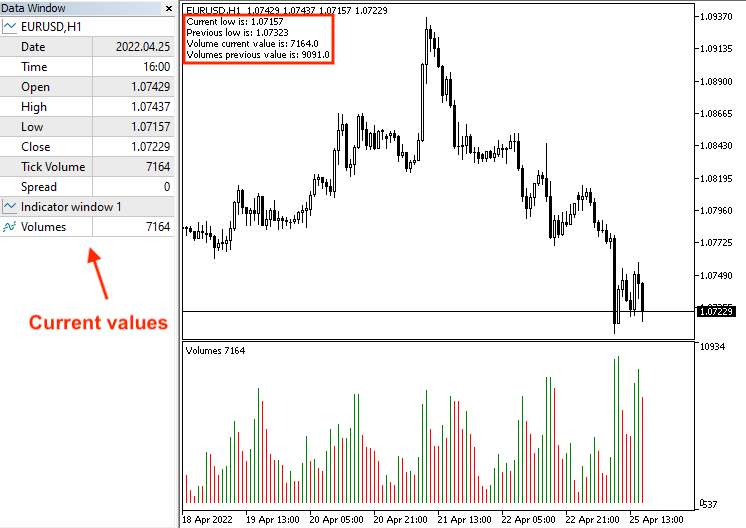
Previous data:
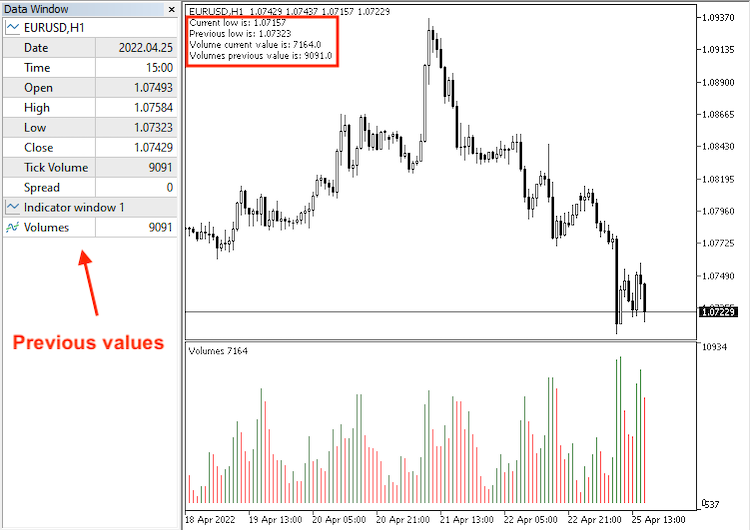
- Strategy five: MA & Vol strategy:
Based on this strategy, we can create a trading system with the following code:
//+------------------------------------------------------------------+
//|                                              MA&Vol Strategy.mq5 |
//|                                  Copyright 2022, MetaQuotes Ltd. |
//|                                             https://www.mql5.com |
//+------------------------------------------------------------------+
#property copyright "Copyright 2022, MetaQuotes Ltd."
#property link      "https://www.mql5.com"
#property version   "1.00"
//+------------------------------------------------------------------+
void OnTick()
  {
//Create arrays for MA & Volume
   double MAShortArray[],MALongArray[];
   double VolArray[];

//sorting arrays from the current data
   ArraySetAsSeries(MAShortArray,true);
   ArraySetAsSeries(MALongArray,true);
   ArraySetAsSeries(VolArray,true);

//defining MA & Volume
   int MAShortDef = iMA(_Symbol, _Period, 10, 0, MODE_SMA, PRICE_CLOSE);
   int MALongDef = iMA(_Symbol, _Period, 24, 0, MODE_SMA, PRICE_CLOSE);
   int VolDef=iVolumes(_Symbol,_Period,VOLUME_TICK);

//filling arrays
   CopyBuffer(MAShortDef,0,0,3,MAShortArray);
   CopyBuffer(MALongDef,0,0,3,MALongArray);
   CopyBuffer(VolDef,0,0,3,VolArray);

//calculating MA && current volume values
   double MAShortCurrentValue=NormalizeDouble(MAShortArray[0],6);
   double MAShortPrevValue=NormalizeDouble(MAShortArray[1],6);
   double MALongCurrentValue=NormalizeDouble(MALongArray[0],6);
   double MALongPrevValue=NormalizeDouble(MALongArray[1],6);
   double VolCurrentValue=NormalizeDouble(VolArray[0],5);
   double VolPrevValue=NormalizeDouble(VolArray[1],5);

//conditions of buy and short signals
//buy signal
   if(MAShortCurrentValue>MALongCurrentValue&&MAShortPrevValue<MALongPrevValue
      &&VolCurrentValue>VolPrevValue)
     {
      Comment("Buy signal");
     }

//short signal
   if(MAShortCurrentValue<MALongCurrentValue&&MAShortPrevValue>MALongPrevValue
      &&VolCurrentValue>VolPrevValue)
     {
      Comment("Short signal");
     }
  }
//+------------------------------------------------------------------+
Difference in the code:
Creating arrays for the short moving average, long moving average and volume:
   double MAShortArray[],MALongArray[];
   double VolArray[];
Sorting these arrays:
   ArraySetAsSeries(MAShortArray,true);
   ArraySetAsSeries(MALongArray,true);
   ArraySetAsSeries(VolArray,true);
Defining the short MA and long MA by using the iMA function that returns the handle of the moving average indicator, its parameters are (symbol, period, average period, horizontal shift, smoothing type which is the type of the MA, applied price), and defining the volume by the iVolumes function the same as we mentioned before:
   int MAShortDef = iMA(_Symbol, _Period, 10, 0, MODE_SMA, PRICE_CLOSE);
   int MALongDef = iMA(_Symbol, _Period, 24, 0, MODE_SMA, PRICE_CLOSE);
   int VolDef=iVolumes(_Symbol,_Period,VOLUME_TICK);
Filling arrays:
   CopyBuffer(MAShortDef,0,0,3,MAShortArray);
   CopyBuffer(MALongDef,0,0,3,MALongArray);
   CopyBuffer(VolDef,0,0,3,VolArray);
Calculating the current values of short MA, long MA and volumes in addition to the previous values of short MA, long MA and volumes:
   double MAShortCurrentValue=NormalizeDouble(MAShortArray[0],6);
   double MAShortPrevValue=NormalizeDouble(MAShortArray[1],6);
   double MALongCurrentValue=NormalizeDouble(MALongArray[0],6);
   double MALongPrevValue=NormalizeDouble(MALongArray[1],6);
   double VolCurrentValue=NormalizeDouble(VolArray[0],5);
   double VolPrevValue=NormalizeDouble(VolArray[1],5);
Conditions of generated signals of the strategy:
Buy signal:
   if(MAShortCurrentValue>MALongCurrentValue&&MAShortPrevValue<MALongPrevValue
      &&VolCurrentValue>VolPrevValue)
     {
      Comment("Buy signal");
     }
Short signal:
   if(MAShortCurrentValue<MALongCurrentValue&&MAShortPrevValue>MALongPrevValue
      &&VolCurrentValue>VolPrevValue)
     {
      Comment("Short signal");
     }
By compiling this code, we will find the EA in the Navigator:
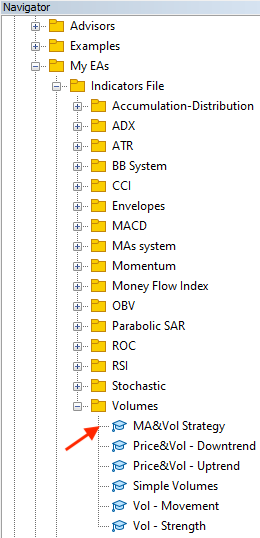
By dragging and dropping it on the chart, the EA will be attached:
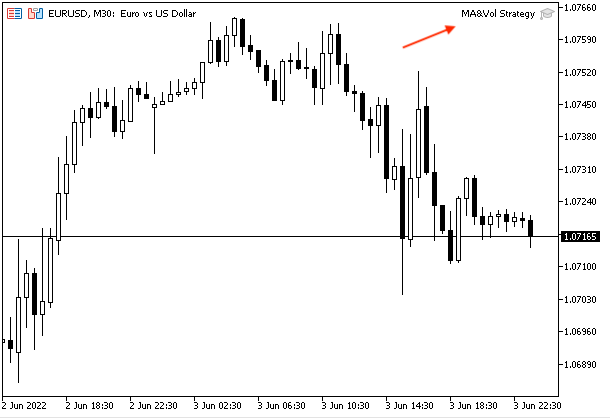
The following is an example of generated signals based on this strategy:
Buy signal:
Short signal:
Conclusion
I hope, I have covered the topic of this useful technical indicator well and you have learned how you can use the volume indicator appropriately to enhance your trading. We have learned what is the volume indicator, what it measures, how we can read it and how we can use it plus we identified the difference between the volume in the forex and stock markets through the topic of Volume definition. We learned also some simple volume strategies:
- Vol - movement: to inform us of the volume movement if it is increased or decreased.
- Vol - strength: to inform us of the strength of the current volume movement compared to the volume average.
- Price and Vol - uptrend: to get a buy signal during the uptrend based on the movement of prices and accompanying volume.
- Price and Vol - downtrend: to get a short signal during the downtrend based on the movement of prices and accompanying volume.
- MA and Vol strategy: to get a buy and short signals based on the crossover between moving averages and accompanying volume.
These mentioned strategies can be used even after testing and optimization if needed based on the basic concept of the indicator. We learned all of that through the topic of Volumes strategy. We learned how to create a step-by-step blueprint for each strategy to help us organize our ideas to create a trading system for each mentioned strategy through the topic of Volumes strategy blueprint. Then, we learned the most interesting part of this article, namely how to create a trading system by MQL5 for each strategy to generate signals automatically and accurately to be able to use them in the MetaTrader 5 trading terminal.
It is important to confirm again that you must test any strategy before using it on your real account as it might be not useful for you as there is nothing that is suitable for all people. I hope that you find this article useful and find new ideas related to the topic of the article or any other related topics. You can also try to think how to combine this indicator with other technical tools to be more meaningful the same as we did through the article by combining the volume with the moving averages as this is a very insightful approach. If you want to read more similar articles, you can read my other articles in the series about how to design a trading system based on the most popular technical indicators. I hope, you will find them useful.
Warning: All rights to these materials are reserved by MetaQuotes Ltd. Copying or reprinting of these materials in whole or in part is prohibited.
This article was written by a user of the site and reflects their personal views. MetaQuotes Ltd is not responsible for the accuracy of the information presented, nor for any consequences resulting from the use of the solutions, strategies or recommendations described.
 Developing a trading Expert Advisor from scratch (Part 8): A conceptual leap
 Learn how to design a trading system by MFI
- Free trading apps
- Over 8,000 signals for copying
- Economic news for exploring financial markets
You agree to website policy and terms of use
can we have iMA function of volume like below
I agree. That's a better way.
BTW, Mohamed, why don't you use iTickVolume() function instead of the indicator? And I think you have typos in the names: Price5Vol_-_Uptrend.mq5, PricetVol_-_Downtrend.mq5, MAaVol_Strategy.mq5
Thanks a lot for your kind comment.
Mohamed is truly a lifesaver, I have read and applied a good number of the ideas in some Expert Advisors.Keep up the brilliant work.
Thanks, Kelvin for your kind comment.