
Learn how to design a trading system by Momentum
Introduction
In my previous article, I mentioned the importance of identifying the trend which is the direction of prices. It is important as according to this direction or trend, we can take a suitable decision. So, we can say that the identification of the market direction will help us to enhance our trading decisions and results. That is why it is so important to identify and to analyze the trend.
Another factor that can also enhance our decisions is the ability to determine if this defined trend is strong or weak or, in other words, if this current trend will continue or not. There are many different tools which can do that. In this article, we will focus on Momentum which is one of the most important tools that can help us understand more about the trend, because as we will find out in more detail from this article, Momentum measures the velocity of prices or trend.
In this article, we will identify in depth the momentum and how to use it in our favor and will design a simple trading system in MQL5 to benefit from the magic of programming which can hep us trade smoothly, easily, and effectively. We will discuss the following topics in this article:
- Momentum definition
- Momentum strategy
- Momentum trading system blueprint
- Momentum trading system
- Conclusion
We will find out more about the Momentum indicator in our first topic "Momentum definition" — we will see what the momentum indicator is and how it is calculated. Then, we will learn a simple strategy which can enhance our understanding of the Momentum indicator and of how it may be useful for us. Then, we will design a trading system blueprint to the mentioned Momentum trading strategy to help us code it in MQL5. Then, we will learn how to code and execute it to get signals of this strategy.
We will use in this article MetaTrader 5 to execute our trading system programs and we will write codes using MetaQuotes Language Editor which is built-in with MetaTrader 5. You can download MetaTrader 5 from the following link: https://www.metatrader5.com/en/download
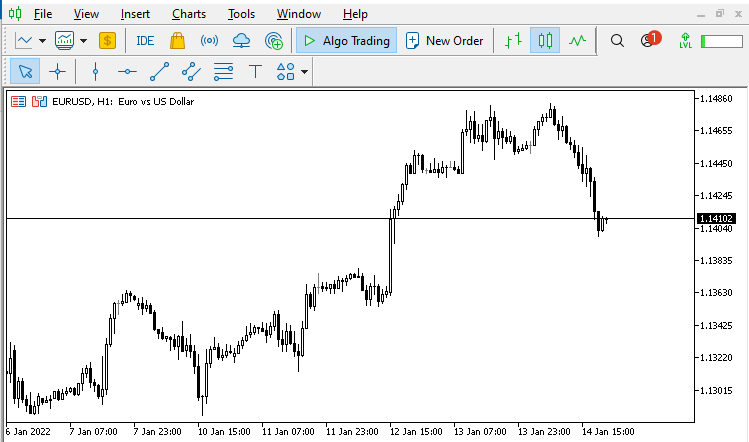
You will see the following window after downloading, installing, and opening MetaTrader 5:
Now open the MetaQuotes Language Editor to write codes. This can be done in different ways:
- Pressing F4 while MetaTrader 5 terminal is open.
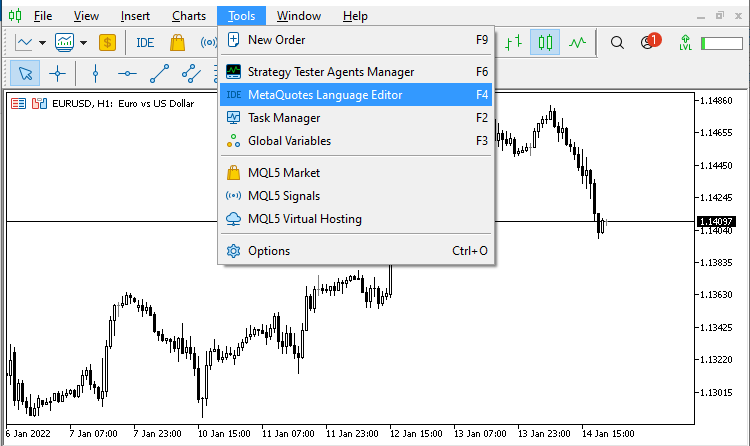
- Clicking Tools tab in the MetaTrader 5 terminal to choose it.
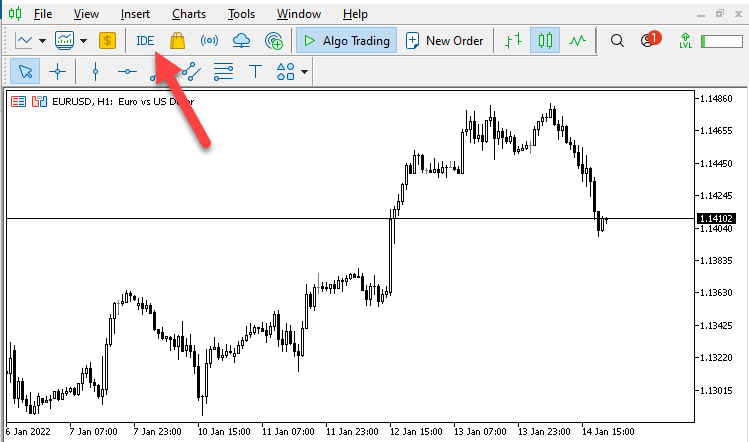
- Clicking on the IDE button in the MetaTrader 5 terminal.
The easiest way is to open the MetaTrader 5 then press F4 button from your keyboard and then the MetaQuotes Language Editor will be opened.
The second way to open MetaQuotes Language Editor is to to use the Tools menu:
The third way to do that is to click the IDE button in MetaTrader 5:
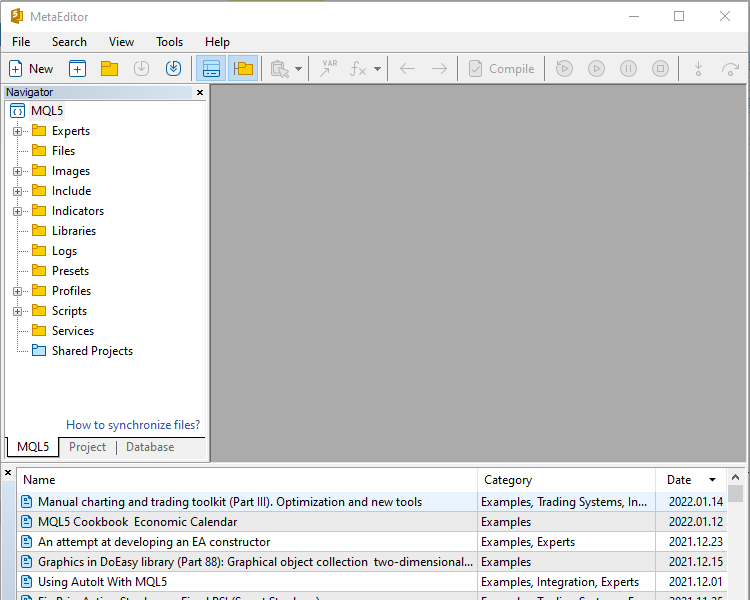
The following window will open:
If you want to learn more about it, you can read my previous articles: Learn Why and How to Design Your Algorithmic Trading System
I also recommend trying to apply what you read and learn, as it will deepen your understanding and it will give you more insights and new ideas about related or non related topics. The main objective of this article is to share what I learn about how this great tool MQL5 can help us in trading.
Please note that you must test everything you learn first before using it as it may be suitable for me but it may not be suitable for you as per your trading style. So, it is very important to use a demo account to test everything you can learn to examine if it will be useful for you or not.
Disclaimer: All content of this article is made for the purpose of education only, not for anything else. So, you will be responsible for any action you take based on the content of this article, as the content of this article does not guarantee any kind of results.
Now, let's start learning this topic to build a new block in our knowledge and improvement.
Momentum definition
In this part, we will learn what Momentum is, what it means, how it can be useful for our trading, what Momentum indicator is, and how we can calculate it. This should also help us understand how it can be useful and how we can use it as when we understand the core of thing then we can deal with it effectively.
The Momentum concept is about measuring the velocity of something. Here it measures the velocity of price changes. So, it will compare current price to a previous value to measure the velocity of change between these two values. And this is what the Momentum indicator does — it measures the velocity of price changes or the acceleration of the trend.
We already know that it is very important to determine first the trend type or the market direction as we will take our decisions according to it. So, we need to determine the trend: whether it is an uptrend, downtrend, or sideways.
- Uptrend: prices create higher lows and higher highs. The prices move upwards. Usually it is said that the major force in the market is that of the buyers.
- Downtrend: prices create lower highs and lower lows. The prices move downward. The major force is that of the sellers.
- Sideways: prices move in any formation except uptrend and downtrend. There is no clear advance in any direction up or down, it refers to the balance between buyers and sellers.
The Momentum concept is very important as it is another dimension that shows the strength of trend movement. So, now we will not only look at or determine the trend direction but also measure the strength of that trend by analyzing the Momentum.
The Momentum indicator is a leading indicator as it may lead prices or in other word, it changes before the change appear on prices.
It is unbounded oscillator according to its calculation, which is considered one of its drawbacks. Another drawback is that according to its calculation the Momentum indicator misses data in between days which will calculate it.
There are two different ways to calculate the Momentum:
- Using subtracting
- Using division
- Getting the Momentum value by subtracting
Its calculation is very simple — it finds the difference between closing prices of current period compared by a previous period.
Momentum = Current Closing Price - Closing Price of (n)
n = 14, which is the period, and this is the default
After calculating the Momentum indicator, the calculation will result in a line which oscillates above and below zero.
Let's see the indicator calculation example. Suppose, we have the following data:
| Day | Closing price |
|---|---|
| 1 | 10 |
| 2 | 12 |
| 3 | 15 |
| 4 | 17 |
| 5 | 19 |
| 6 | 20 |
| 7 | 18 |
| 8 | 16 |
| 9 | 20 |
| 10 | 22 |
| 11 | 24 |
| 12 | 20 |
| 13 | 18 |
| 14 | 17 |
| 15 | 15 |
Now, if we want to calculate Momentum on the 15th day, it will be as follows:
Momentum = Current Closing Price - Closing Price of (n)
n = 14 which is day 1
Momentum = 15 - 10 = 5
Then we plot the difference above zero and next to 5 as Momentum indicator is oscillating above and below zero. From this calculation we can see the drawbacks, like we mentioned earlier: there is missing data between calculated data as we subtract 14 period from the current. Another drawback is that the indicator is unbounded i.e. it has no limit for rising or declining.
- Getting the Momentum value by division
The other way to calculate Momentum indicator is by using ratio. Exactly this calculation is used in MetaTrader 5. It consists of the following steps:
Momentum = (Current Closing Price / Closing Price of (n))*100
n = 14 which is day 1
Applying this calculation to the previous example, we get the Momentum as follows:
Momentum = (15 / 10)*100 = 150
Then, the value will be plotted above 100 and next to 150 as here, the Momentum indicator will oscillate above and below 100. In this article, we will use this way of calculation and the strategy will be applied on it.
The indicator is already built into MetaTrader 5, so we simply need to choose it and it will be inserted to the chart and the following is for how to do that.
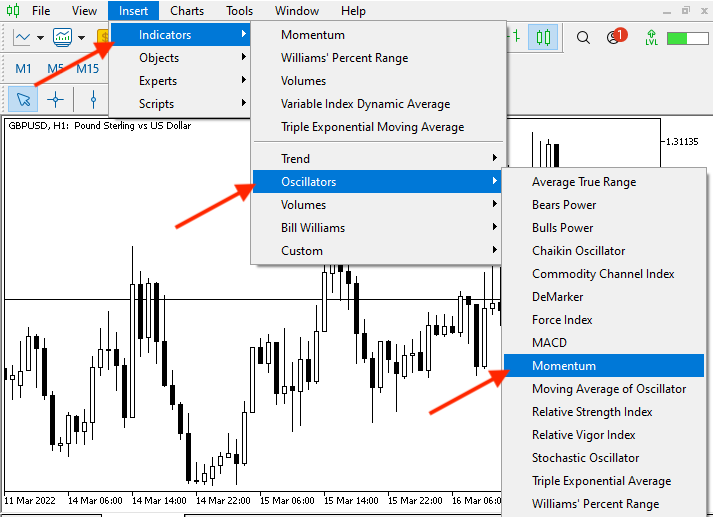
From MetaTrader 5, click on insert tap, then choose Indicators, then Oscillators, then Momentum and the following picture is for that:
After choosing Momentum, appear the following picture for parameters of Momentum indicator:
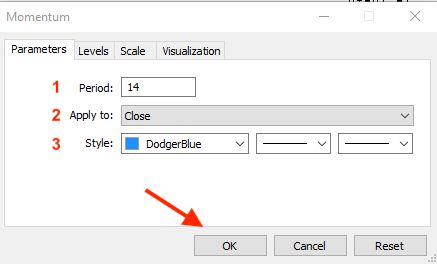
The previous window, includes parameters of the Momentum indicator and here you can set what you find that it will be suitable for your trading according to your trading style or your trading plan as it may be different from trader to trader as per his preferences and you will find that parameters the same as follows:
- To choose the period to compare it to the current price and here the default is 14.
- To choose price type that you want to use in the Momentum calculation (Close, Open, High, Low,.....etc).
- To choose your preferred style that you want the indicator to be appeared with like color, line type, and line thickness.
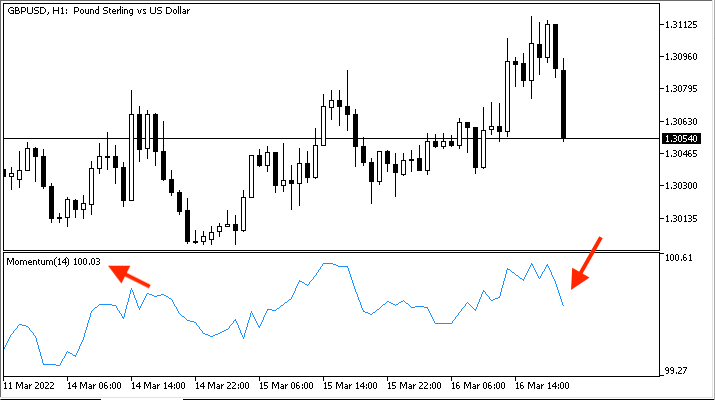
After choosing your suitable parameters and press ok, the indicator appears the same like the following picture:
Momentum strategy
In this part, we will learn a simple strategy using the Momentum indicator. There are many useful strategies and ways to use Momentum, but for the sake of education we will work with a simple strategy, as our purpose is to learn how to use it and to open the door for new ideas that can be appear after learning the core of the topic. The ultimate purpose is to learn to design these ideas as trading systems using MQL5.
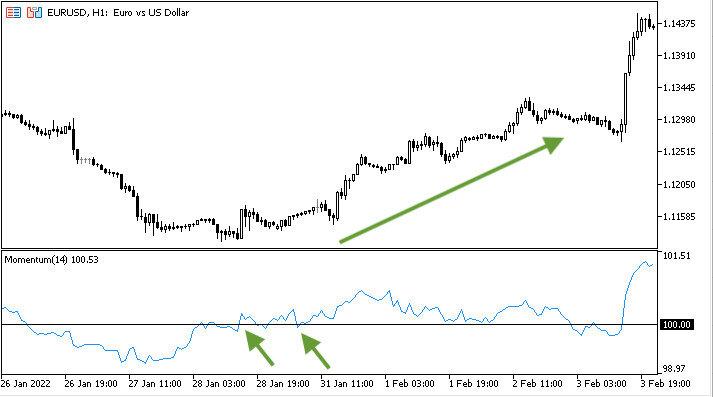
Our strategy will search for a crossover between the Momentum line and the level of 100. When Momentum line breaks 100 upwards, it will be a buy signal. When Momentum line breaks 100 downwards, it will be a short signal.
- Momentum > 100 = Buy
- Momentum < 100 = Short
This signal will be generated based on the trend direction, which will create a filtration for generated signal. Momentum indicator gives an early signals and whipsaws, which can be used to filter generated signals.
So, it will be the same like below:
- Momentum > 100 = Buy
- You can take profit by another tool for more efficiency.
The following picture shows an example of a signal generated during the uptrend by the Momentum crossover:
- Momentum < 100 = Short
- You can take profit by another tool for more efficiency.
The following picture will represents an example for the signal that can be generated during the downtrend when the Momentum indicator crosses the level of 100:
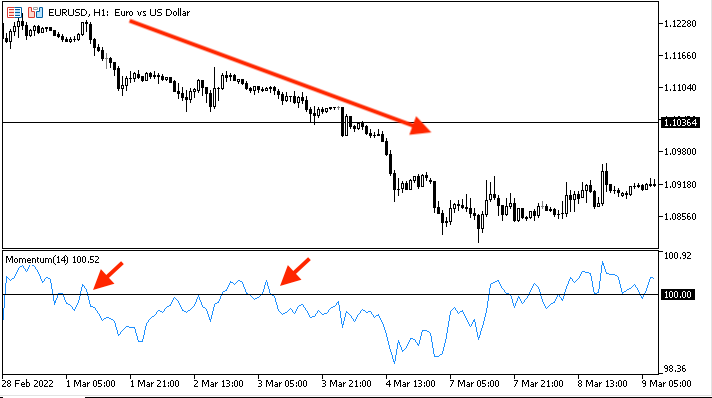
- During sideways: till now while I am writing this article, my point of view is as follows: there are other tools which can give better signals than the Momentum indicator during sideways because it gives early signals and whipsaws which may lead to false signals. So, I prefer to use other tools to benefit from sideways movements.
- About taking profit signals by another tool as I mentioned. For example, we can use price action to take profits as you can exit once the reversal is done by creating lower low during the uptrend or by creating higher high during the downtrend and this is one of many other techniques which can be used with price action. Optionally, you can use any other tool to exit the market with maximum profits, such as price action or indicators.
Momentum trading system blueprint
In this part, I will present a blueprint for designing Momentum strategies as a trading system and you can. So this step is about planning of future coding, aimed at receiving a program that can be run by the computer.
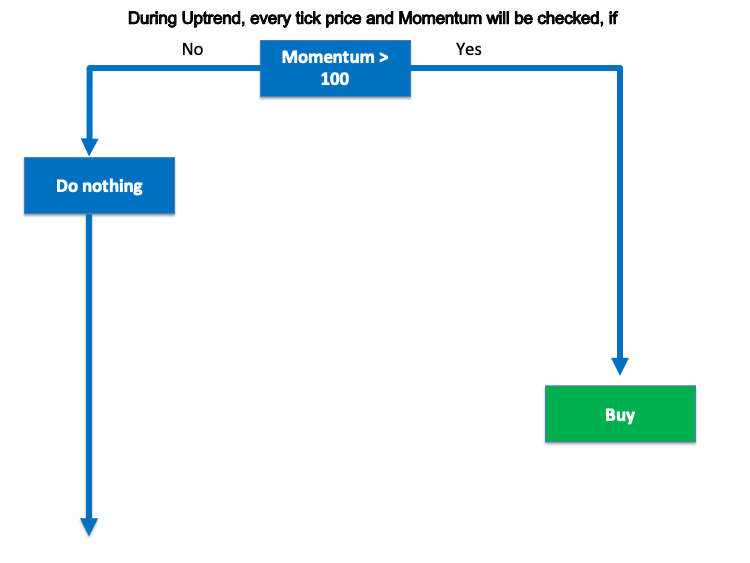
- During Uptrend, the program should check every tick and see if the strategy conditions are met or not. So, If Momentum breaks 100 upwards or the value of Momentum is above 100, we need the program to give a buy signal. If it did not break 100 upwards or the value of Momentum is below 100, the program should give no signal, should do nothing. This is clearly shown in the following diagram:
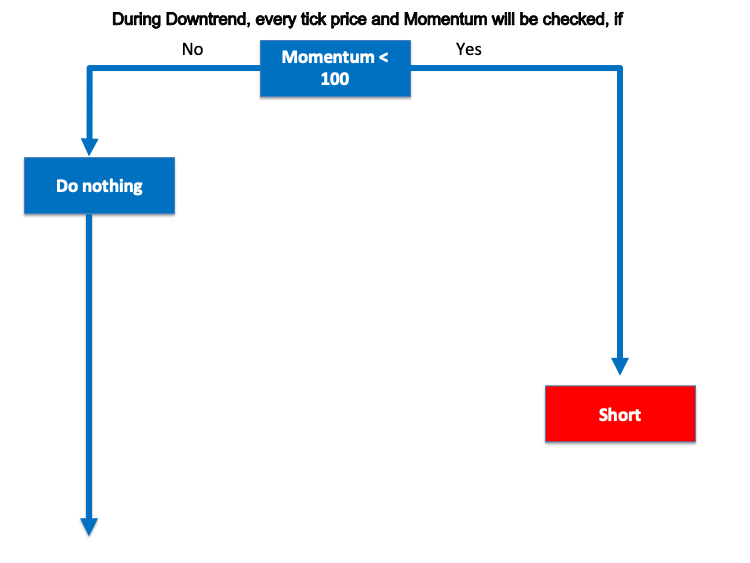
- During Downtrend, the program should check strategy conditions at every tick. If Momentum breaks 100 downwards or the value of Momentum is below 100, the program should give a short signal. Otherwise, if it did not break 100 downwards or the value of Momentum is above 100, the program should give no signal, do nothing. Here is the diagram:
Using the above blueprints, we will program thee strategies using MQL5 to obtain a program that will give signals automatically so that we don't need to check the Momentum signals manually. This is what we are going to implement in the next part of the article.
Momentum trading system
First, for deeper understanding of how the Momentum indicator can be coded, we will learn how to design a simple Momentum System which will generate a comment on the chart with the Momentum value. This is implemented in the following code:
//+------------------------------------------------------------------+
//|                                       Simple Momentum System.mq5 |
//|                                  Copyright 2022, MetaQuotes Ltd. |
//|                                             https://www.mql5.com |
//+------------------------------------------------------------------+
#property copyright "Copyright 2022, MetaQuotes Ltd."
#property link      "https://www.mql5.com"
#property version   "1.00"
//+------------------------------------------------------------------+
void OnTick()
  {
   //Creating array for prices
   double PriceArray [];

   //Identifying Momentum properties
   int MomentumDef = iMomentum(_Symbol,_Period,14,PRICE_CLOSE);

   //Sorting price array
   ArraySetAsSeries(PriceArray,true);

   //Copying results
   CopyBuffer(MomentumDef,0,0,3,PriceArray);

   //Getting Momentum value of current price
   double MomentumValue = NormalizeDouble(PriceArray[0],2);

   //Commenting Momentum output on the chart
   if(MomentumValue>100) Comment("MOMENTUM VALUE IS: ",MomentumValue);

  }
//+------------------------------------------------------------------+
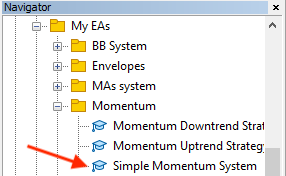
After writing this program, we need to execute it in the MetaTrader 5 trading platform. To do this, go to the MetaTrader 5 trading terminal then from Navigator choose the desired file. The Navigator window is usually open in the terminal. If it is not, go to the View menu and select Navigator or you press Ctrl + N while when MetaTrader 5 is open.
The following picture is for how to find you file in the Navigator:
Then, open this file by double click or drag and drop it on the chart. After that, the following program window will be opened:
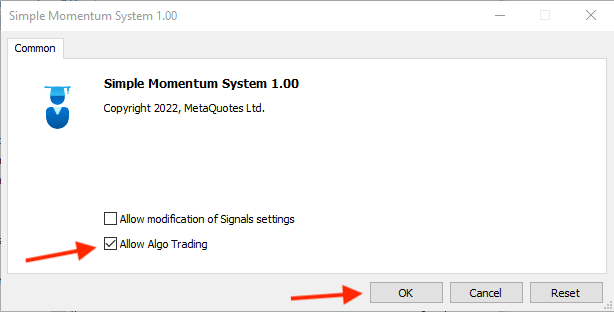
Enable the "Allow Algo Trading" option and press Ok. The program will be attached to the chart and the appropriate comments will appear on the chart. Below is an example of a running program:
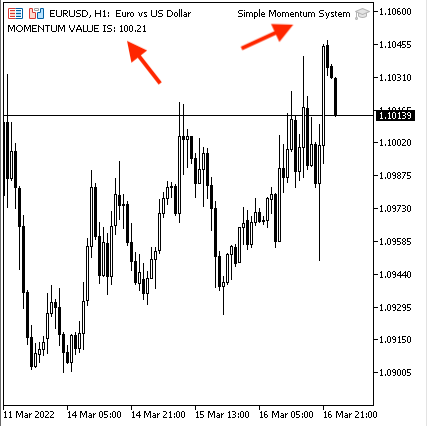
Now, we need to design our strategy with the two types of trend - uptrend and downtrend. So, as we defined:
During Uptrend:
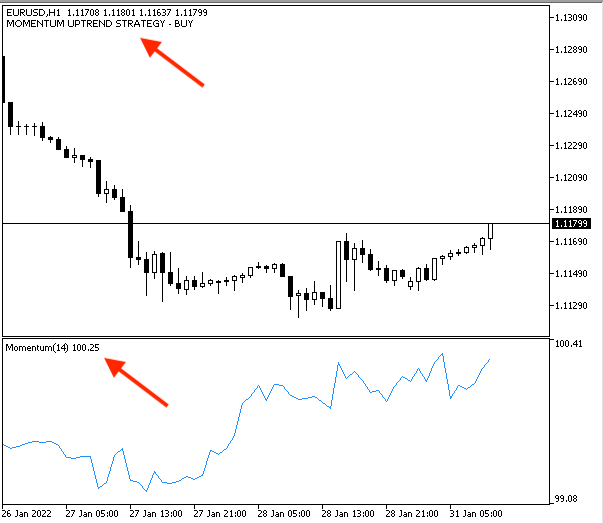
- We need to use a strategy which can alert us with a buy signal on the chart by comment "Momentum Uptrend Strategy - Buy" during the uptrend. This signal should appear when the Momentum value becomes above the level of 100.
- Momentum > 100 = Buy
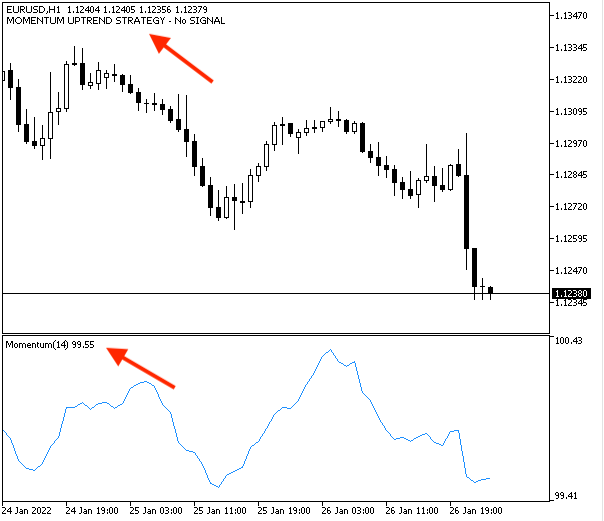
- If the Momentum value is below 100, the program should print on the chart the comment " Momentum Uptrend Strategy - No signal"
- Momentum < 100 = No signal
This is implemented in the following code:
//+------------------------------------------------------------------+
//|                                    Momentum Uptrend Strategy.mq5 |
//|                                  Copyright 2022, MetaQuotes Ltd. |
//|                                             https://www.mql5.com |
//+------------------------------------------------------------------+
#property copyright "Copyright 2022, MetaQuotes Ltd."
#property link      "https://www.mql5.com"
#property version   "1.00"
//+------------------------------------------------------------------+
void OnTick()
  {
   //Creating array for prices
   double PriceArray [];

   //Identifying Momentum properties
   int MomentumDef = iMomentum(_Symbol,_Period,14,PRICE_CLOSE);

   //Sorting price array
   ArraySetAsSeries(PriceArray,true);

   //Copying results
   CopyBuffer(MomentumDef,0,0,3,PriceArray);

   //Getting Momentum value of current price
   double MomentumValue = NormalizeDouble(PriceArray[0],2);

   //Commenting Momentum output on the chart
   if(MomentumValue>100) Comment("MOMENTUM UPTREND STRATEGY - BUY");
   if(MomentumValue<100) Comment("MOMENTUM UPTREND STRATEGY - No SIGNAL");
  }
//+------------------------------------------------------------------+
After writing this code, execute it in the trading terminal — there it will generate the desired signals on the chart, just like we have seen in the previous program. Go to the Navigator window and find the program, as shown in the following picture:
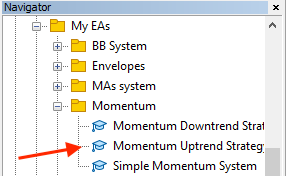
Then open the file by double click or drag and drop it on the chart. This will open the following parameters window:
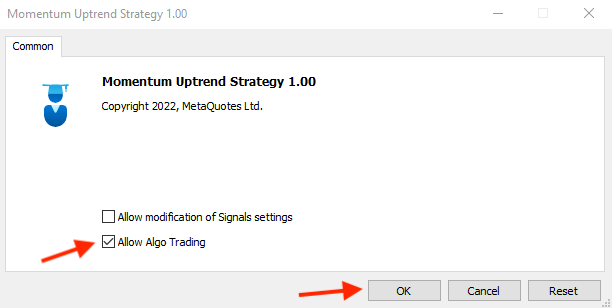
Enable the Allow Algo Trading option and click OK. The file will be attached to the chart as follows:
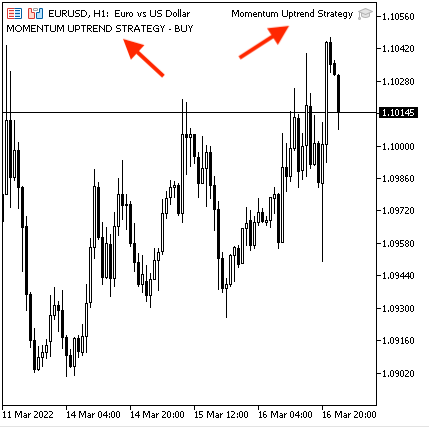
The program will start generating comments on the chart, showing signals according to this strategy.
- Buy signal:
- No signal
During Downtrend:
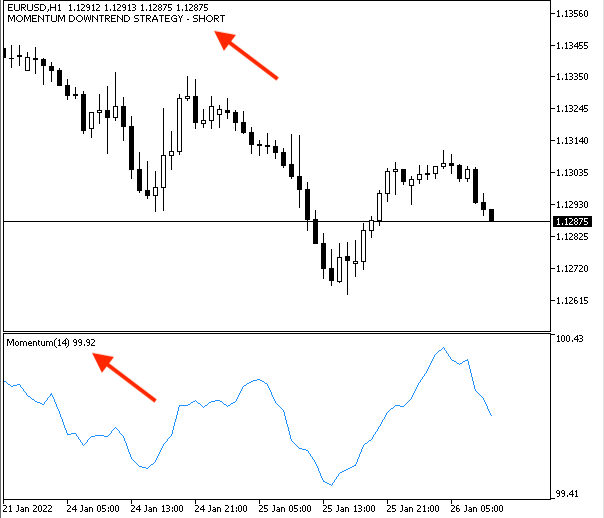
- The strategy should alert us with a short signal on the chart by comment "Momentum Downtrend Strategy - Short" during the downtrend, when the Momentum value becomes below the level of 100.
- Momentum < 100 = Short
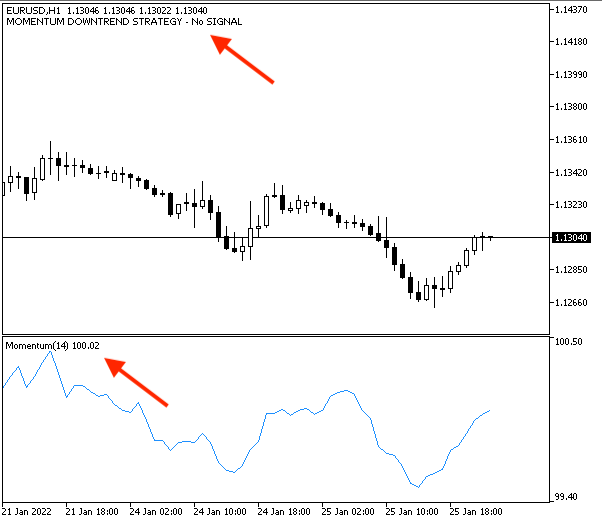
- If the Momentum value is above the level of 100, comment with "Momentum Downtrend Strategy - No signal"
- Momentum > 100 = No signal
The following code shows how to design a program to do that:
//+------------------------------------------------------------------+
//|                                  Momentum Downtrend Strategy.mq5 |
//|                                  Copyright 2022, MetaQuotes Ltd. |
//|                                             https://www.mql5.com |
//+------------------------------------------------------------------+
#property copyright "Copyright 2022, MetaQuotes Ltd."
#property link      "https://www.mql5.com"
#property version   "1.00"
//+------------------------------------------------------------------+
//+------------------------------------------------------------------+
void OnTick()
  {
   //Creating array for prices
   double PriceArray [];

   //Identifying Momentum properties
   int MomentumDef = iMomentum(_Symbol,_Period,14,PRICE_CLOSE);

   //Sorting price array
   ArraySetAsSeries(PriceArray,true);

   //Copying results
   CopyBuffer(MomentumDef,0,0,3,PriceArray);

   //Getting Momentum value of current price
   double MomentumValue = NormalizeDouble(PriceArray[0],2);

   //Commenting Momentum output on the chart
   if(MomentumValue<100) Comment("MOMENTUM DOWNTREND STRATEGY - SHORT");
   if(MomentumValue>100) Comment("MOMENTUM DOWNTREND STRATEGY - No SIGNAL");
  }
//+------------------------------------------------------------------+
After writing the code in our MetaQuotes Language Editor and compiling it, again execute the file of that program on the chart. Find it in the Navigator window, under the Expert Advisors Folder, just like in the following picture:
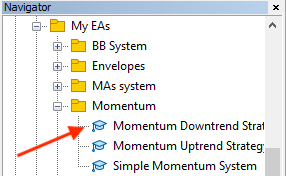
Then double click or drag and drop the file onto the chart. This will open the following window with program parameters:
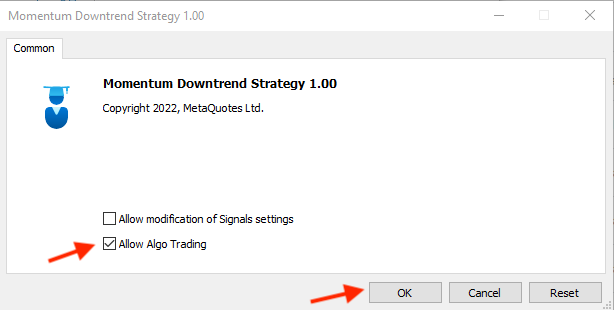
Again, enable "Allow Algo Trading", then press OK. The program will be attached to a chart and will work as is shown in the following picture:
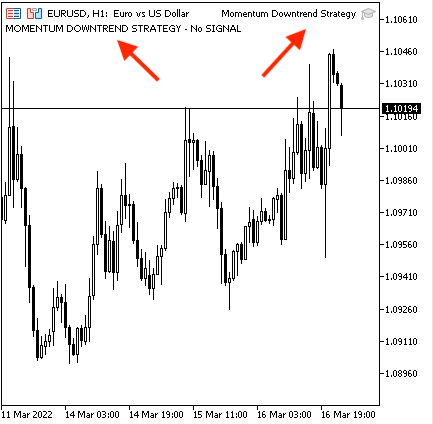
Generated signals according to this strategy will be as follows.
- Short signal:
- No signal:
Now, we have designed a trading system using the Momentum indicator by utilizing a simple trading strategy. I mentioned in the article, there are many strategies that we can use by the Momentum indicator but we tried to use and share a simple trading strategy, It should assist in understanding the concept of the indicator and help beginners program it. I hope that this topic will encourage you to find new insights and new ideas of how to improve trading using MQL5.
Conclusion
Now, we have finished our topic. In this article, we have learnt about the concept of Momentum, have seen why this concept is important to our trading and how it can add one more useful dimension to our trading. We also have seen the Momentum indicator, what it measures and how it can be calculated. Then we learnt a simple strategy that can be used by the Momentum indicator during different market direction or trend. We have also then we learn how to design a trading system in MQL5, how to write the code of this strategy and then how to execute it in our trading terminal - MetaTrader 5 - in which the program can automatically generate signals. This can ultimately help us trade smoothly, easily, and effectively.
I cannot find enough words to describe how it is important to test anything you learnt before using it to make sure that it is suitable for your trading style and your plan and I advise you to improve everything you learnt as this step will let you not only absorb what you learn but it will open your mind to new ideas and give more insights about related or non-related topics.
Another thing I would like to mention here also that there are a lot of profitable strategies which can be used but we can find someone use a strategy and make profits while we can find another person use the same strategy and make losses. So, it is not only about the strategy, yes the strategy is important for sure but there are more elements that can lead to desired results and the most important one is the discipline and we have a tool which can be useful and effective to achieve this discipline and this tool is programming as once we created a trading system by a profitable strategy, this will be a game changing as the computer will understand your strategy then it will do what you want to do without emotions interfering as we all experience as humans.
And I hope that you find this article useful for your trading and I wish you all profitable trading!
Warning: All rights to these materials are reserved by MetaQuotes Ltd. Copying or reprinting of these materials in whole or in part is prohibited.
This article was written by a user of the site and reflects their personal views. MetaQuotes Ltd is not responsible for the accuracy of the information presented, nor for any consequences resulting from the use of the solutions, strategies or recommendations described.
 MVC design pattern and its application (Part 2): Diagram of interaction between the three components
 Data Science and Machine Learning (Part 01): Linear Regression
- Free trading apps
- Over 8,000 signals for copying
- Economic news for exploring financial markets
You agree to website policy and terms of use
Salaam Maleikum. Dear Mohammed A. The article is interesting. But in my opinion, RSI indicator and 50.0 level. Shows a better result than Momentum and Ur. 100. Maybe I'm wrong, not the point. Anyway, thanks for the topic. It was creative))))).
Thanks for this useful article. Very informative.
Thanks for your comment.
how do we put in an alert to show the change from a 'No Signal' to a 'Buy or sell signal' comment
i don;t think its as simple as just puting a
Alert ()
as we need to find the switch from no signal to a signal
thanks