
Rope Indicator by Erik Nayman
Contents
- Introduction
- Chapter 1. Principles of creating and calculating the "Rope" indicator with code examples
- Chapter 2. Practical use of the "Rope" indicator and building an Expert Advisor based on the indicator
- Chapter 3. Optimization of the Expert Advisor's input parameters
- Conclusion
Introduction
This article and the indicator are based on the book of Erik L. Nayman - The Small Encyclopedia of Trader — K . VIRA-R Alfa Capital, 1999. —236 p.). It covers the basics of technical and fundamental analysis of financial markets from which a method, called "Rope" indicator, is chosen. To describe it briefly, it is worth noting that the indicator is based on the ratio of price change speed over the selected period to the amount of these changes.
In his book the author gives an overview of analysis, providing tables and charts used for writing this article. He performs the market analysis based on the interaction between bulls and bears using price change speed, number of transactions and mass of changes as the objects of analysis. Speed is measured by a number of trades, and mass is calculated as a difference between two adjacent quotes (current and previous). The last known price is considered a quote in the book (more information is provided in the first chapter using the example of calculation).
The purpose of market analysis is to calculate force and to determine the direction of the trend, where bulls and bears simultaneously affect the market. Finding value of this force can be used to evaluate whose position is currently stronger. The author identifies this action as a tug-of-war between two opposing forces, as expressed in the book through the "rope" value calculated using a total force of bulls and bears:

He also describes two approaches to analyzing the market and making calculations based on static and dynamic methods. The calculation of the "rope" value in his book involves the following steps:
1. Evaluating and calculating bullish and bearish forces, finding the direction.
Formulas for bullish force (as in the book):
BuF = SPCi, where:
- BuF — bullish force;
- SPCi -—sum of positive changes over the analyzed period of time.
Formulas for bearish force (as in the book):
BeF = SNCi, where:
- BeF — bearish force;
- SNCi — sum of negative changes over the analyzed period of time.
The BuF and BeF values are further compared with each other, and the higher value indicates who has a dominant position on the market.
By comparing the force values on two adjacent bars of the analyzed chart period, we obtain the dynamic evaluation. See below the analysis in the source:
BuF > BeF and (BuF1 - BuFО) > (BeF1 - BeFО) = overall growing bullish force (current force value is marked with index 1, previous value - with index 0).
BuF > BeF and (BuF1 - BuFО) < (BeF1 - BeFО) = overall declining bullish force.
BuF < BeF and (BuF1 - BuFО) > (BeF1 - BeFО) = overall declining bearish force.
BuF < BeF and (BuF1 - BuFО) < (BeF1 - BeFО) = overall growing bearish force.
In addition to the static force value, the changes of dynamics of this value on the adjacent calculated points are viewed separately.
2. Evaluating, calculating and comparing "vigor" (number of changes) for bulls and bears. Vigor calculation for bulls and bears in the source:
BuV = NPCi, where:
- BuV — bull vigor;
- NPCi — number of positive changes over the analyzed period of time.
BeV = NNCi, where:
- BeV — bear vigor;
- NNCi — number of negative changes over the analyzed period of time.
By comparing the calculated value of vigor with a previous adjacent value, we get the dynamic evaluation. The dynamics are evaluated through the comparison of a static value with a dynamic value, the same way as in the example of comparison from the previous step of analysis.
3. Evaluating, calculating and comparing the evaluation of "skills" for bulls and bears. Shown in the source as:
Skills of bulls and bears in their market policy are revealed in the following formulas:
BuS = SPC1/NPC1;
BeS = SNC1 / NNC1.
This shows how static value is calculated, the dynamic calculation is based on the example from the first step.
4. Final evaluation of bulls and bears. After calculating all values from the previous three steps and comparing their data, we can make a conclusion about the direction and character of the trend. The final evaluation is made based on the comparison of all three parameters and is presented accordingly in the book:
If BuF > BeF, BuV > BeV and BuS > BeS (subject to dynamic relations mentioned above), then bulls are far more preferable in their vigor than bears, so only buy orders should be considered. A dynamic value of two "adjacent calculated points on the rope line" should be added to static data for a dynamic market assessment.
In terms of these steps of analysis, three main calculated values of creating an indicator can be distinguished:
- force — sum of changes over the analyzed period of time;
- vigor — quantity of changes over the analyzed period of time;
- skill = force / vigor.
The author marked the dynamic part as the most sensitive and vigorous of all. Only a static method of calculations was chosen for this article. Thus, comparing three calculated parts "force", "vigor" and "skill", the author makes a conclusion about the force and direction of the trend, calculates static and dynamic data and introduces various methods for their use. Now we are going to take a more detailed look at the creation of the "Rope" indicator using the method of Erik L. Nayman.
Chapter 1. Principles of creating and calculating the "Rope" indicator with code examples
A linear and histogram method was chosen for the creation of indicator. The linear method is a sum of calculated values of bulls and bears. A histogram method displays calculations for bulls and bears seperately.
We will see the indicator's code with comments provided for each step. Let's begin with a declaration of variables and characteristics of displaying the indicator using #property. The description of color characteristics of the indicator is provided for the convenience of analyzing data in the code below.
//+------------------------------------------------------------------+
//|                                             RopebyEricNaiman.mq5 |
//|                        Copyright 2015, MetaQuotes Software Corp. |
//|                                             https://www.mql5.com |
//+------------------------------------------------------------------+
#property copyright "Copyright 2015, MetaQuotes Software Corp."
#property link      "https://www.mql5.com"
#property description "RopebyEricNaiman by Im_hungry (https://login.mql5.com/en/users/Im_hungry)"
#property description "RopebyEricNaiman - shows the direction of the desire of the market action and the power of this desire."
#property version   "1.00"
#property strict
//--- including МА calculation function from the MovingAverages.mqh file
#include <MovingAverages.mqh>
//---
#property indicator_separate_window // sets drawing in a separate window
#property indicator_buffers 12 // sets 12 indicator buffers
#property indicator_plots   5 // sets 5 indicator buffers to be drawn by the indicator
//--- bull histogram
#property indicator_label1  "BULL"
#property indicator_type1   DRAW_COLOR_HISTOGRAM
// 0 - clrDarkGreen - color index "only buy", buy order with high category of confirmation
// 1 - clrMediumSeaGreen - color index "buy order allowed", buy order with average category of confirmation
// 2 - clrLightGreen - color index "buy order allowed", buy order with low category of confirmation
// 3 - clrGray - color index "buy order prohibited"
#property indicator_color1  clrDarkGreen,clrMediumSeaGreen,clrLightGreen,clrGray
#property indicator_style1  STYLE_SOLID
#property indicator_width1  2
//--- bear histogram
#property indicator_label2  "BEAR"
#property indicator_type2   DRAW_COLOR_HISTOGRAM
// 0 - clrDarkRed - color index "only sell", sell order with high category of confirmation
// 1 - clrIndianRed - color index "sell order allowed", sell order with average category of confirmation
// 2 - clrLightPink - color index "sell order allowed", sell order with low category of confirmation
// 3 - clrGray - color index "sell order prohibited"
#property indicator_color2  clrDarkRed,clrIndianRed,clrLightPink,clrGray
#property indicator_style2  STYLE_SOLID
#property indicator_width2  2
//--- MAIN line of indicator
#property indicator_label3  "main line"
#property indicator_type3   DRAW_COLOR_LINE
// 0 - clrDarkGreen - color index "only buy", buy order with high category of confirmation
// 1 - clrDarkRed - color index "only sell", sell order with high category of confirmation
// 2 - clrGray - color index "no strict confirmation"
#property indicator_color3  clrDarkGreen,clrDarkRed,clrGray
#property indicator_style3  STYLE_SOLID
#property indicator_width3  2
//--- drawing indicator of fast МА on data of the main line of indicator
#property indicator_label4  "ma fast"
#property indicator_type4   DRAW_LINE
#property indicator_color4  clrAqua
#property indicator_style4  STYLE_SOLID
#property indicator_width4  1
//--- drawing indicator of slow МА on data of the main line of indicator
#property indicator_label5  "ma slow"
#property indicator_type5   DRAW_LINE
#property indicator_color5  clrYellow
#property indicator_style5  STYLE_SOLID
#property indicator_width5  1
The author doesn't provide any description of color characteristics himself, but analyzes the trend when all three indicators completely/partially match:
- Bull force > bear force — bullish trend, the inverse sign indicates the dominance of bears.
- Bull vigor > bear vigor — bullish trend.
- Bull skill > bear skill — bullish trend.
By comparing these indicators, we can evaluate the force of the trend. The more indicators there are confirming the trend, the stronger it becomes. A description of the color display of the histogram, based on three calculated values during the initialization of variables, is shown above. These calculated values can be compared in any combination.
0 — clrDarkGreen, color index "only buy", buy order with high category of confirmation.
1 — clrMediumSeaGreen, color index "buy order allowed", buy order with average category of confirmation.
2 — clrLightGreen, color index "buy order allowed", buy order with low category of confirmation.
3 — clrGray, color index "buy order prohibited".
There is a color display for the main line of the indicator only when all three calculated values match, as per the original description from the book:
"If BuF > BeF, BuV > BeV and BuS > BeS (subject to dynamic relations mentioned above), then bulls are far more preferable in their vigor than bears, and only buy orders should be considered. If BuF < BeF, BuV < BeV and BuS < BeS (subject to dynamic relations), then bears are far more preferable than bulls. Only sell orders are preferred." |
We are going to declare the external variables of the indicator. Must be noted, that there is an option to display a line and/or a histogram with input variables draw_line and draw_histogram to make operation with the indicator easier. To achieve universal calculations you can now select prices for indicator calculation using the _price parameter. Settings of the МА indicator are also executed with an option that can be disabled.
//--- input parameters
input string section_1="___ main settings";
//--- enable drawing a histogram of bulls and bears
input bool draw_histogram=true;
//--- enable drawing a main line of the indicator
input bool draw_line=true;
//--- period of the indicator
input int _period=76;
//--- price used for calculations
input ENUM_APPLIED_PRICE _price=PRICE_CLOSE;
//--- restrictions in the bar calculations deeper in the history from the current bar
input int max_bars=0;
//--- brief shift of the line and МА from the histogram for better clarity of the indicator. All values of the main line and МА are multiplied by line_deviation
input double line_deviation=3.0;
//---
input string section_2="___ MA fast";
//--- enable drawing the fast МА
input bool draw_MA_fast=false;
//--- period of the quick МА calculation based on the indicator
input int period_MA_fast=25;
//--- calculation method of the fast moving average
input ENUM_MA_METHOD method_MA_fast=MODE_SMA;
//---
input string section_3="___ MA slow";
//--- enable drawing the fast МА
input bool draw_MA_slow=false;
//--- calculation period of the slow МА based on the indicator
input int period_MA_slow=143;
//--- calculation method of the fast moving average
input ENUM_MA_METHOD method_MA_slow=MODE_SMA;
//---- buffers
...
The book contains a number of options for working with the "rope" value. The following were selected from the variety:
- Indicator intersection with a zero line.
- Trading only when all three calculated values, such as force, vigor and skill, match. Implemented as colors of the main line.
- Indicator intersection with МА.
- Intersection of two МАs.
МА indicator (loaded from the MovingAverages.mqh library) is created based on the indicator's main line values present in the buffer array Buffer_calcLINE. It was added to achieve easy data access before transferring it to the function library for calculating МА.
The main data for calculating and creating the indicator is initialized in the OnInit function. Nulling prev_rates_total and _tm_prev variables is an important aspect of making calculations when the chart period changes and other reasons for resetting the indicator occur. The _tm_prev value is responsible for the time of the last calculated bar from which the calculation commences when the next bar appears. The prev_rates_total parameter keeps the previous value - rates_total (at the previous tick). By comparing it with the current rates_total (number of bars or the size of the price[] array), we can see that data was recalculated, not all bars were uploaded, recalculation was made to prevent cases of loading gaps in the history, and, as a result, data was not displayed correctly on the chart.
//+------------------------------------------------------------------+
//| Custom indicator initialization function                         |
//+------------------------------------------------------------------+
int OnInit()
  {
//--- log message for running the indicator for the first time
   Print(__FUNCTION__+"\\ Initialization | _period: ",_period);
//--- number of digits after the decimal point for the current symbol
   _digits=(int)SymbolInfoInteger(Symbol(),SYMBOL_DIGITS);
//---accurate display of indicator values
   IndicatorSetInteger(INDICATOR_DIGITS,_digits);
//--- setting the indicator name, displayed in the indicator window
   IndicatorSetString(INDICATOR_SHORTNAME,"RopebyEricNaiman");
//--- INDICATOR_DATA - stores data for drawing
//--- INDICATOR_COLOR_INDEX - stores color indexes
//--- INDICATOR_CALCULATIONS - stores data for intermediate calculations not intended for drawing
   SetIndexBuffer(0,Buffer_main_bull,INDICATOR_DATA); // data buffer of bull histogram
   SetIndexBuffer(1,Buffer_color_bull,INDICATOR_COLOR_INDEX);  // data buffer of bull colors
   SetIndexBuffer(2,Buffer_main_bear,INDICATOR_DATA); // data buffer of bear histogram
   SetIndexBuffer(3,Buffer_color_bear,INDICATOR_COLOR_INDEX);  // data buffer of bear color
   SetIndexBuffer(4,Buffer_mainline,INDICATOR_DATA); // data buffer of indicator main line
   SetIndexBuffer(5,Buffer_mainline_color,INDICATOR_COLOR_INDEX); // data buffer of colors of the indicator main line
   SetIndexBuffer(6,Buffer_MAfast,INDICATOR_DATA); // data buffer of fast МА
   SetIndexBuffer(7,Buffer_MAslow,INDICATOR_DATA); // data buffer of slow МА
   SetIndexBuffer(8,Buffer_calc,INDICATOR_CALCULATIONS); // data buffer of price calculations
   SetIndexBuffer(9,Buffer_calc_bull,INDICATOR_CALCULATIONS); // calculated bull data buffer
   SetIndexBuffer(10,Buffer_calc_bear,INDICATOR_CALCULATIONS); // calculated bear data buffer
   SetIndexBuffer(11,Buffer_calcLINE,INDICATOR_CALCULATIONS); // calculated data buffer for МА
//--- nulling time of the last calculated bar and prev_rates_total (rates_total at the previous call // rates_total = size of array price[])
   _tm_prev=0;
   prev_rates_total=0;
//---
   return(INIT_SUCCEEDED);
  }
Further calculations in the OnCalculate function are made for displaying data on the chart. Taking into account the calculated part of the table from the book on page 147, a positive change is a positive result of the difference between two prices, and the price is a bar closing price (when using price=PRICE_CLOSE). This difference can indicate both bullishness (positive change) or bearishness (negative change) on the market. It will further be considered as a "bar" that consists of the opening price equal to the previous bar closing price from the calculated bar and the calculated bar (i) closing price set by the function:
for(int i=1; i<bars_calc && !IsStopped(); i++)
        {
         ...
In order to calculate three main indicators we must take the price array according to the _price settings, and calculate the value of the _period variable using the for operator. It is required to calculate positive price changes for bulls and negative price changes for bears and the amount of changes over this period, plus find their ratio in course of dividing the sum by the amount:
- if(total_bull>0) Buffer_calc_bull[i]=sum_bull/total_bull; — for bulls.
- if(total_bear>0) Buffer_calc_bear[i]=sum_bear/total_bear; — for bears.
Find below a calculation (live on the chart) based on the example with bull, bear and main line histogram with the period _period=5:
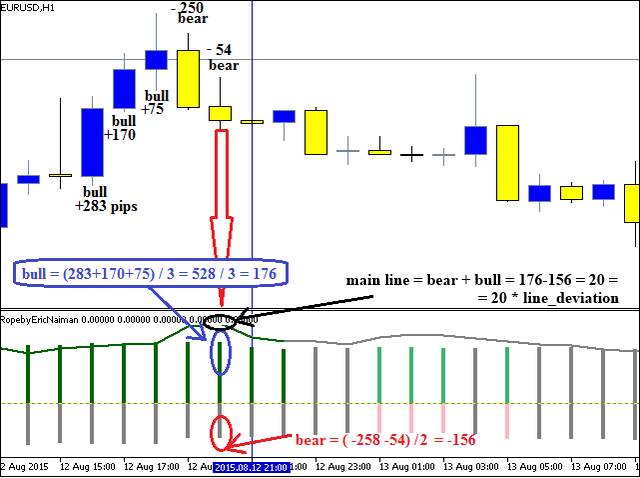
Thus, as a result of summing up the values of bulls and bears, a "rope" appears on every bar and is further used for calculations. This is implemented and presented in the indicator as a line with three colors displayed through the indicator color buffer - Buffer_mainline_color[]. See below the calculations in the OnCalculate() function.
//+------------------------------------------------------------------+
//| Custom indicator iteration function                              |
//+------------------------------------------------------------------+
int OnCalculate(const int rates_total,    // size of price[] array
                const int prev_calculated,// processed bars at the previous call
                const datetime &time[],
                const double &open[],
                const double &high[],
                const double &low[],
                const double &close[],
                const long &tick_volume[],
                const long &volume[],
                const int &spread[])
  {
   ArraySetAsSeries(time,true);
//--- setting array indexing as in timeseries, the lowest index 0 has the last known calculated value in history
   ArraySetAsSeries(open,true);
   ArraySetAsSeries(high,true);
   ArraySetAsSeries(low,true);
   ArraySetAsSeries(close,true);
   ArraySetAsSeries(Buffer_main_bull,true);
   ArraySetAsSeries(Buffer_color_bull,true);
   ArraySetAsSeries(Buffer_main_bear,true);
   ArraySetAsSeries(Buffer_color_bear,true);
   ArraySetAsSeries(Buffer_mainline,true);
   ArraySetAsSeries(Buffer_mainline_color,true);
   ArraySetAsSeries(Buffer_MAfast,true);
   ArraySetAsSeries(Buffer_MAslow,true);
   ArraySetAsSeries(Buffer_calc,true);
   ArraySetAsSeries(Buffer_calc_bull,true);
   ArraySetAsSeries(Buffer_calc_bear,true);
   ArraySetAsSeries(Buffer_calcLINE,true);
//---
   int copy=0;
   bars_calc=0;
//--- calculation of indicator data
//--- when prev_calculated = 0 all data is calculated on all bars once again , =0 may equal zero after the gap in history, for example, when disconnected from Internet for a long time
   if(prev_calculated==0) _tm_prev=0;
//---if the previous size is bigger than the current size, it indicates failure and all data must be recalculated
   if(prev_rates_total>rates_total) _tm_prev=0;
   if(_tm_prev<time[0]) // calculation when a new bar appears
     {
      if(_tm_prev>0) // if the indicator already has previously calculated data
        {
         copy=TakeShift_byTime(Symbol(),PERIOD_CURRENT,_tm_prev); // the current symbol bar shifting along the last calculated bar time
         if(copy<=0) // if the shift is not found, then calculations are deviated and repeated at the next tick
           {
            return 0;
           }
         bars_calc=copy+1; // setting the bar shift to start calculations from the current unclosed indicator bar
         //--- nulling the first current unclosed bar, i.e. its data is not calculated
         Buffer_main_bull[0]=0.0;
         Buffer_color_bull[0]=5; // setting color index in number 5 corresponds to empty color, therefore color is not drawn
         Buffer_main_bear[0]=0.0;
         Buffer_color_bear[0]=5; // setting color index in number 5 corresponds to empty color, therefore color is not drawn
         Buffer_mainline[0]=0.0;
         Buffer_mainline_color[0]=5; // setting color index in number 5 corresponds to empty color, therefore color is not drawn
         Buffer_MAfast[0]=0.0;
         Buffer_MAslow[0]=0.0;
         Buffer_calc[0]=0.0;
         Buffer_calc_bull[0]=0.0;
         Buffer_calc_bear[0]=0.0;
         Buffer_calcLINE[0]=0.0;
        }
      else // if indicator is set up for the first time and values are not calculated
        {
         bars_calc=Bars(Symbol(),PERIOD_CURRENT)-1; // bar shift to start calculations is set as the total amount of bars -1
         //--- nulling all data on all bars to avoid drawing errors
         for(int i=0; i<Bars(Symbol(),PERIOD_CURRENT) && !IsStopped(); i++)
           {
            Buffer_main_bull[i]=0.0;
            Buffer_main_bear[i]=0.0;
            Buffer_mainline[i]=0.0;
            Buffer_MAfast[i]=0.0;
            Buffer_MAslow[i]=0.0;
            Buffer_calc[i]=0.0;
            Buffer_calc_bull[i]=0.0;
            Buffer_calc_bear[i]=0.0;
            Buffer_calcLINE[i]=0.0;
           }
        }
      //--- if the amount of bars for indicator calculations falls below zero, then calculation should be aborted
      if(bars_calc<0) return 0;
      //--- restriction of the amount of bars to calculate the max_bars value
      if(bars_calc>max_bars && max_bars!=0) bars_calc=max_bars;
      for(int i=1; i<bars_calc && !IsStopped(); i++)
        {
         //--- calculation of difference between two bars' quotes according to the _price setting
         switch(_price)
           {
            case PRICE_CLOSE:
               Buffer_calc[i]=close[i]-close[i+1];
               break;
            case PRICE_OPEN:
               Buffer_calc[i]=open[i]-open[i+1];
               break;
            case PRICE_HIGH:
               Buffer_calc[i]=high[i]-high[i+1];
               break;
            case PRICE_LOW:
               Buffer_calc[i]=low[i]-low[i+1];
               break;
            case PRICE_MEDIAN:
               Buffer_calc[i]=((high[i]+low[i])/2)-((high[i+1]+low[i+1])/2);
               break;
            case PRICE_TYPICAL:
               Buffer_calc[i]=((high[i]+low[i]+close[i])/3)-((high[i+1]+low[i+1]+close[i+1])/3);
               break;
            case PRICE_WEIGHTED:
               Buffer_calc[i]=((high[i]+low[i]+close[i]+close[i])/4)-((high[i+1]+low[i+1]+close[i+1]+close[i+1])/4);
               break;
            default: return 0;
           }
        }
      //--- running iteration of uncalculated bars until the loop ends and the IsStopped=true command for ending the program doesn't appear (as in the case when deleting the indicator from the chart)
      for(int i=1; i<=bars_calc && !IsStopped(); i++)
        {
         //--- nulling data
         sum_bull=0.0; // sum variable of positive changes (for bulls) over the analyzed period of time
         total_bull=0; // sum variable of quantity of positive changes over the analyzed period of time
         sum_bear=0.0; // sum variable of negative changes (for bears) over the analyzed period of time
         total_bear=0; // sum variable of negative changes over the analyzed period of time

         Buffer_main_bull[i]=0.0;
         Buffer_color_bull[i]=5;
         Buffer_main_bear[i]=0.0;
         Buffer_color_bear[i]=5;
         Buffer_mainline[i]=0.0;
         Buffer_mainline_color[0]=5;

         Buffer_calc_bull[i]=0.0;
         Buffer_calc_bear[i]=0.0;
         Buffer_calcLINE[i]=0.0;
         //--- stop calculation for the bar, if it falls beyond the available data according to the analyzed period
         if(i>=(rates_total-_period)) continue;
         //--- data iteration over the analyzed period (_period) from the current bar deeper in the history
         for(int i2=i; i2<i+_period; i2++)
           {
            //--- calculation for bulls
            if(Buffer_calc[i2]>0)
              {
               sum_bull+=Buffer_calc[i2]; // summing up the prices of positive bars ("sum of positive changes over the analyzed period of time")
               total_bull++; // calculation of the amount of positive bars ("amount of positive changes over the analyzed period of time")
              }
            //--- calculation for bears
            if(Buffer_calc[i2]<0)
              {
               sum_bear+=Buffer_calc[i2]; // summing up the prices of negative bars ("sum of negative changes over the analyzed period of time")
               total_bear++; // calculation of the amount of negative bars ("amount of negative changes over the analyzed period of time")
              }
           }
         //--- calculation of "bulls' skill", dividing the bar value in points by the amount of such bars
         if(total_bull>0) Buffer_calc_bull[i]=sum_bull/total_bull;
         //--- calculation of "bears' skills"
         if(total_bear>0) Buffer_calc_bear[i]=sum_bear/total_bear;
         //--- drawing histogram with filling colors by categories of signal confirmation
         if(draw_histogram)
           {
            //--- drawing bulls' histogram, dividing the bar value in points by the amount of such bars
            if(total_bull>0) Buffer_main_bull[i]=sum_bull/total_bull;
            //--- drawing histogram of bears, dividing the size of bar in points by the amount of such bars
            if(total_bear>0) Buffer_main_bear[i]=sum_bear/total_bear;
            //--- 0 color of clrDarkGreen histogram- color index "only buy", buy order with high category of confirmation
            //--- category of confirmation - all three indicators reveal bullish tendency
            //--- bull vigor > bear vigor and bull force > bear force and bull skill > bear skill
            //--- vigor - amount of bars
            //--- force - summing up the bar size in points
            //--- skill - average calculated value of all bar sums over the indicated period force/vigor
            if(total_bull>total_bear && MathAbs(sum_bull)>MathAbs(sum_bear) && MathAbs(Buffer_main_bull[i])>MathAbs(Buffer_main_bear[i])) Buffer_color_bull[i]=0;
            else
              {
               //--- 1 color of clrMediumSeaGreen histogram - color index "buy order allowed", buy order with average category of confirmation
               //--- category of confirmation - with two bullish indicators and one bearish indicator, in any combination
               if((total_bull>total_bear && MathAbs(sum_bull)>MathAbs(sum_bear) && MathAbs(Buffer_main_bull[i])<MathAbs(Buffer_main_bear[i])) ||
                  (total_bull>total_bear && MathAbs(sum_bull)<MathAbs(sum_bear) && MathAbs(Buffer_main_bull[i])>MathAbs(Buffer_main_bear[i])) ||
                  (total_bull<total_bear && MathAbs(sum_bull)>MathAbs(sum_bear) && MathAbs(Buffer_main_bull[i])>MathAbs(Buffer_main_bear[i]))) Buffer_color_bull[i]=1;
               else
                 {
                  //--- 2 color of clrLightGreen histogram - color index "buy order allowed", buy order with low category of confirmation
                  //--- category of confirmation - with one bullish indicator and two bearish indicators, in any combination
                  if((total_bull>total_bear && MathAbs(sum_bull)<MathAbs(sum_bear) && MathAbs(Buffer_main_bull[i])<MathAbs(Buffer_main_bear[i])) ||
                     (total_bull<total_bear && MathAbs(sum_bull)>MathAbs(sum_bear) && MathAbs(Buffer_main_bull[i])<MathAbs(Buffer_main_bear[i])) ||
                     (total_bull<total_bear && MathAbs(sum_bull)<MathAbs(sum_bear) && MathAbs(Buffer_main_bull[i])>MathAbs(Buffer_main_bear[i]))) Buffer_color_bull[i]=2;
                  else
                    {
                     //--- 3 color of clrGray histogram - color index "buy order prohibited"
                     //--- category of confirmation - when bullish indicator is missing
                     Buffer_color_bull[i]=3;
                    }
                 }
              }
            //--- 0 color of clrDarkRed histogram - color index "only sell", sell order with high category of confirmation
            //--- category of confirmation - all three indicators reveal bullish tendency
            if(total_bull<total_bear && MathAbs(sum_bull)<MathAbs(sum_bear) && MathAbs(Buffer_main_bull[i])<MathAbs(Buffer_main_bear[i])) Buffer_color_bear[i]=0;
            else
              {
               //--- 1 color of clrIndianRed histogram - color index "sell order allowed", sell order with average category of confirmation
               //--- category of confirmation - with two bullish indicators and one bullish indicator, in any combination
               if((total_bull<total_bear && MathAbs(sum_bull)<MathAbs(sum_bear) && MathAbs(Buffer_main_bull[i])>MathAbs(Buffer_main_bear[i])) ||
                  (total_bull<total_bear && MathAbs(sum_bull)>MathAbs(sum_bear) && MathAbs(Buffer_main_bull[i])<MathAbs(Buffer_main_bear[i])) ||
                  (total_bull>total_bear && MathAbs(sum_bull)<MathAbs(sum_bear) && MathAbs(Buffer_main_bull[i])<MathAbs(Buffer_main_bear[i]))) Buffer_color_bear[i]=1;
               else
                 {
                  //--- 2 color of clrLightPink histogram - color index "sell order allowed", sell order with low category of confirmation
                  //--- category of confirmation - with one bearish indicator and two bullish indicators, in any combination
                  if((total_bull<total_bear && MathAbs(sum_bull)>MathAbs(sum_bear) && MathAbs(Buffer_main_bull[i])>MathAbs(Buffer_main_bear[i])) ||
                     (total_bull>total_bear && MathAbs(sum_bull)<MathAbs(sum_bear) && MathAbs(Buffer_main_bull[i])>MathAbs(Buffer_main_bear[i])) ||
                     (total_bull>total_bear && MathAbs(sum_bull)>MathAbs(sum_bear) && MathAbs(Buffer_main_bull[i])<MathAbs(Buffer_main_bear[i]))) Buffer_color_bear[i]=2;
                  else
                    {
                     //--- 3 color of clrGray histogram - color index "sell order prohibited"
                     //--- category of confirmation - with bearish indicator missing
                     Buffer_color_bear[i]=3;
                    }
                 }
              }
           }
         //--- calculated value of the main line, summing up the skills of bears and bulls
         Buffer_calcLINE[i]=(Buffer_calc_bull[i]+Buffer_calc_bear[i])*line_deviation;
         //--- drawing line with filling colors by signal confirmation categories
         // 0 - clrDarkGreen - color index "only buy", buy order with high category of confirmation
         // 1 - clrDarkRed - color index "only sell", sell order with high category of confirmation
         // 2 - clrGray - color index "no strict confirmation"
         if(draw_line)
           {
            //--- drawing main line values, summing up the skills of bears and bulls
            Buffer_mainline[i]=(Buffer_calc_bull[i]+Buffer_calc_bear[i])*line_deviation;
            //--- setting the line of indefinite color (2 - clrGray)
            Buffer_mainline_color[i]=2;
            //--- setting the line of bullish color (0 - clrDarkGreen) when all three bullish indicators match (bull>bear)
            if(total_bull>total_bear && MathAbs(sum_bull)>MathAbs(sum_bear) && MathAbs(Buffer_calc_bull[i])>MathAbs(Buffer_calc_bear[i])) Buffer_mainline_color[i]=0;
            //--- setting the line of bearish color (1 - clrDarkRed) when all three bearish indicators match (bear>bull)
            if(total_bull<total_bear && MathAbs(sum_bull)<MathAbs(sum_bear) && MathAbs(Buffer_calc_bull[i])<MathAbs(Buffer_calc_bear[i])) Buffer_mainline_color[i]=1;
           }
        }
      //--- calculation and drawing the МA
      if(draw_MA_fast || draw_MA_slow)
        {
         //--- disabling indexing as in timeseries to transfer into the library MovingAverages.mqh (indexing is changed to have a current history bar in the end of array)
         ArraySetAsSeries(Buffer_calcLINE,false);
         ArraySetAsSeries(Buffer_MAfast,false);
         ArraySetAsSeries(Buffer_MAslow,false);
         //--- iteration of all uncalculated bars. Iteration = All bars (rates_total) - bar shift from the last known calculated time _tm_prev (bars_calc)
         for(int i=rates_total-bars_calc; i<rates_total && !IsStopped(); i++)
           {
            //--- restriction of calculations set in parameters max_bars, calculation only for the set amount of max_bars as the total difference of all bars (rates_total) minus the set amount (max_bars)
            if(max_bars>0?(i<(rates_total-max_bars)):false)
              {
               //--- if the current index i falls beyond the permitted value, we proceed to the allowed index
               i=rates_total-max_bars;
               continue;
              }
            //--- nulling the array in case МА data is not received
            Buffer_MAfast[i]=0.0;
            Buffer_MAslow[i]=0.0;
            //--- selection of the fast МА calculation method based on the method_MA_fast parameter
            if(draw_MA_fast)
              {
               switch(method_MA_fast)
                 {
                  case MODE_SMA: // Simple averaging
                     Buffer_MAfast[i]=SimpleMA(i,period_MA_fast,Buffer_calcLINE); // obtaining data of the calculated SimpleMA i index from the library Include\\MovingAverages.mqh based on Buffer_calcLINE data buffer and period_MA_fast period
                     break;
                  case MODE_EMA: // Exponential averaging
                     Buffer_MAfast[i]=ExponentialMA(i,period_MA_fast,Buffer_MAfast[i-1],Buffer_calcLINE);
                     break;
                  case MODE_SMMA: // Smoothed averaging
                     Buffer_MAfast[i]=SmoothedMA(i+period_MA_fast,period_MA_fast,Buffer_MAfast[i-1],Buffer_calcLINE);
                     break;
                  case MODE_LWMA: // Linear weighted averaging
                     Buffer_MAfast[i]=LinearWeightedMA(i+period_MA_fast,period_MA_fast,Buffer_calcLINE);
                     break;
                  default: return 0;
                 }
              }
            //--- selection of the slow MA calculation method based on method_MA_slow parameter
            if(draw_MA_slow)
              {
               switch(method_MA_slow)
                 {
                  case MODE_SMA: // Simple averaging
                     Buffer_MAslow[i]=SimpleMA(i,period_MA_slow,Buffer_calcLINE);
                     break;
                  case MODE_EMA: // Exponential averaging
                     Buffer_MAslow[i]=ExponentialMA(i,period_MA_slow,Buffer_MAslow[i-1],Buffer_calcLINE);
                     break;
                  case MODE_SMMA: // Smoothed averaging
                     Buffer_MAslow[i]=SmoothedMA(i,period_MA_slow,Buffer_MAslow[i-1],Buffer_calcLINE);
                     break;
                  case MODE_LWMA: // Linear weighted averaging
                     Buffer_MAslow[i]=LinearWeightedMA(i,period_MA_slow,Buffer_calcLINE);
                     break;
                  default: return 0;
                 }
              }
           }
         //--- enabling indexing as in timeseries for drawing
         ArraySetAsSeries(Buffer_calcLINE,true);
         ArraySetAsSeries(Buffer_MAfast,true);
         ArraySetAsSeries(Buffer_MAslow,true);
         //--- nulling МА data for the current bar, i.e. not calculated
         Buffer_MAfast[0]=EMPTY_VALUE;
         Buffer_MAslow[0]=EMPTY_VALUE;
         Buffer_calcLINE[0]=EMPTY_VALUE;
        }
      //--- memorize time of the last calculated bar
      _tm_prev=time[0];
     }
//--- return value of prev_calculated for next call
   prev_rates_total=rates_total;
   return(rates_total);
  }
Values of the main line have been increased (value of the main line * line_deviation) to fall beyond the histogram for a convenient view when displaying lines and the histogram. The restriction of the amount of calculated bars (max_bars) has been added for speeding up calculations for small periods, for example М1. The last block of the TakeShift_byTime code is used to obtain the bar deviation in time with a purpose of finding the amount of bars required for calculations in the bars_calc.
Chapter 2. Practical implementation of the "Rope" indicator and creating the Expert Advisor
In this chapter we are going to focus on creating the EARopebyEricNaiman Expert Advisor based on the "Rope" indicator (name of the indicator's source code — RopebyEricNaiman). The indicator can be used as a separate strategy based on the example of the EARopebyEricNaiman Expert Advisor, and a filter for finding the direction of the trend. The author considers several approaches for using data calculated by the indicator in this book. The following were selected among them in the Expert Advisor:
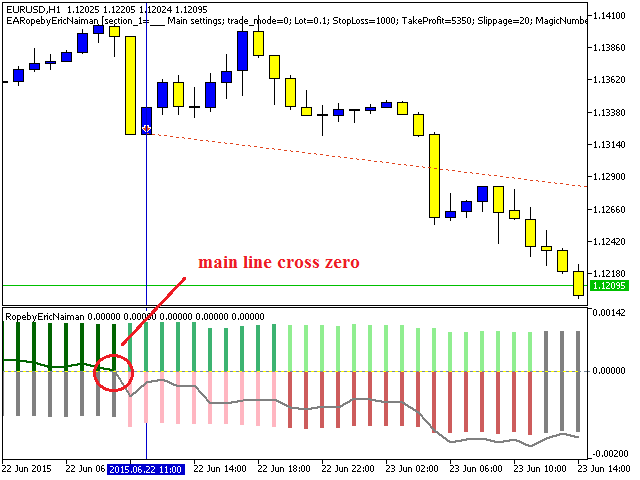
- Main line intersection with 0 (main line cross zero). Above intersection — buy deal, below intersection — sell deal.
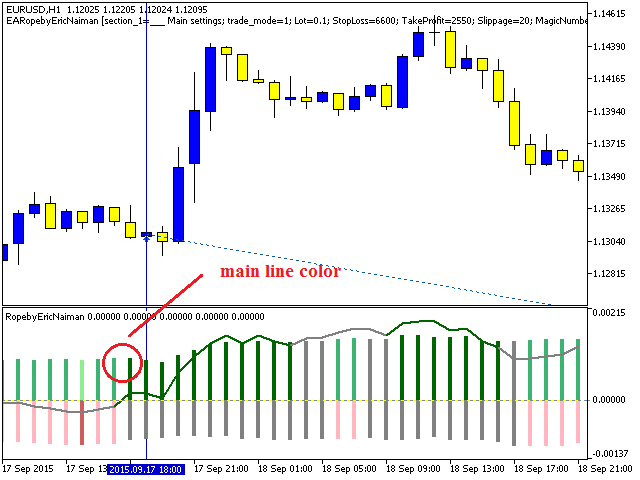
- Opening when the main line color is changed from gray to green (buy) or from gray to red (sell).
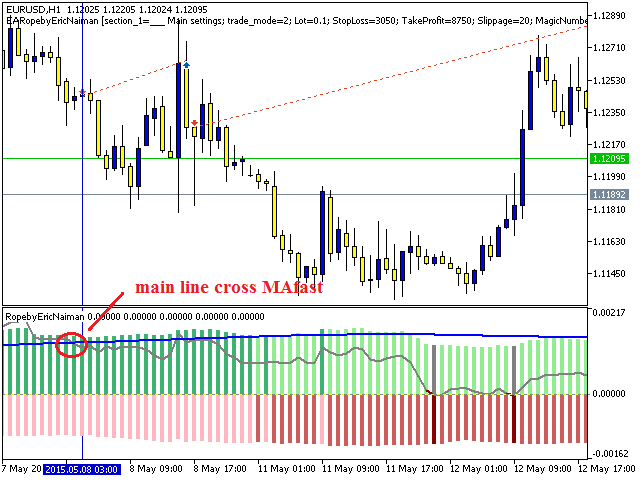
- Opening at the main line intersection with the fast МА (main line cross MAfast). The main line crossing the MA above — buy order, below — sell order.
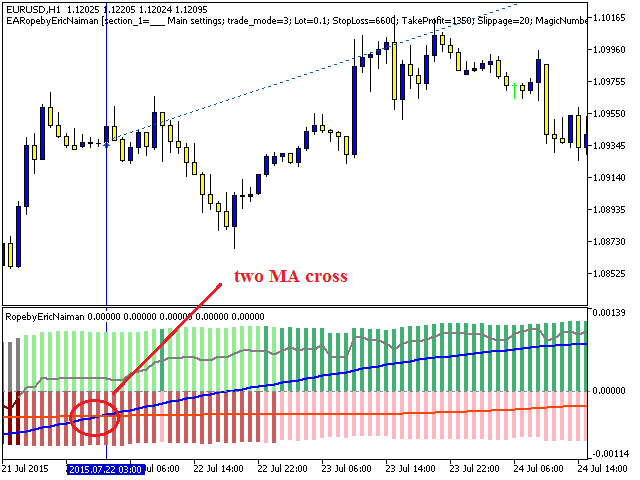
Opening when two МАs cross. The fast Ma crosses the slow МА above - buy, below — sell.
In addition to the main settings, the Expert Advisor provides an opportunity to set up 4 closing types corresponding to the opening signals separately, but in the opposite direction in comparison with an open position's type:
//---  settings for closing the position
input string section_5="___ Close settings";
//--- closing at the main line intersection with zero / BUY closing at the below intersection
input bool close1=true; // Close main line cross zero
//--- closing when the color is changed to the opposite color of the open position / BUY closing when changed to red
input bool close2=false; // Close main line color
//--- closing at the main line intersection with the МА line/ BUY closing at the main line intersection below МА
input bool close3=false; // Close main line cross MAfast
//---  closing at the intersection of two МАs / BUY closing at the fast МА intersection with the slow МА below
input bool close4=true; // Close two MA cross
Thus, the opening is based on one of the selected methods in the trade_mode variable, and closing is executed by Stop Loss/Take Profit/by one of the methods above. The entire expert and indicator source code can be downloaded and viewed in the files attached below. In this article we only analyze the main calculated part of signals for opening and closing positions.
- Main variables and the RopebyEricNaiman indicator are initialized in the OnInit() block.
- The OnTick() bloсk contains the managing block for opening and closing positions.
- The signal calculation block Check_Indi_Open() is used to load indicator data and search for an opening signal:
//+------------------------------------------------------------------+
//| Check_Indi_Open                                                  |
//+------------------------------------------------------------------+
int Check_Indi_Open()
  {
   //--- declaration of arrays to obtain indicator data
   int copy=0;
   double _arr_ind_1[];
   double mafast[];
   double mainline[];
   double maslow[];
   //--- using the switch function to select the opening method based on the external variable parameter trade_mode
   switch((int)trade_mode)
     {
      case 0:
         //--- indicator's main line comparison on the last two bars, except the current one
         copy=Copy_indi_Buffer(RbEN_handle,4,1,2,_arr_ind_1,"RbEN");
         if(copy!=2) return 4;
         if(_arr_ind_1[0]!=EMPTY_VALUE && _arr_ind_1[1]!=EMPTY_VALUE &&
            _arr_ind_1[0]>0 && _arr_ind_1[1]<=0)
           {
            return 0;
           }
         if(_arr_ind_1[0]!=EMPTY_VALUE && _arr_ind_1[1]!=EMPTY_VALUE &&
            _arr_ind_1[0]<0 && _arr_ind_1[1]>=0)
           {
            return 1;
           }
         break;
      case 1:
         //--- obtaining the indicator color index from the indicator buffer No5 on the last two bars, except the current one
         copy=Copy_indi_Buffer(RbEN_handle,5,1,2,_arr_ind_1,"RbEN");
         if(copy!=2) return 5;
         if(_arr_ind_1[0]!=EMPTY_VALUE && _arr_ind_1[1]!=EMPTY_VALUE &&
            _arr_ind_1[0]==0 && _arr_ind_1[1]!=0)
           {
            return 0;
           }
         if(_arr_ind_1[0]!=EMPTY_VALUE && _arr_ind_1[1]!=EMPTY_VALUE &&
            _arr_ind_1[0]==1 && _arr_ind_1[1]!=1)
           {
            return 1;
           }
         break;
      case 2:
         //--- receipt and comparison of mafast (МА on the main indicator line) and mainline (main line of indicator) values on the last two bars, except the current one.
         copy=Copy_indi_Buffer(RbEN_handle,6,1,2,mafast,"RbEN");
         if(copy!=2) return 6;
         copy=Copy_indi_Buffer(RbEN_handle,4,1,2,mainline,"RbEN");
         if(copy!=2) return 7;
         if(mafast[0]!=EMPTY_VALUE && mafast[1]!=EMPTY_VALUE &&
            mainline[0]!=EMPTY_VALUE && mainline[1]!=EMPTY_VALUE &&
            mainline[0]>mafast[0] && mainline[1]<=mafast[1])
           {
            return 0;
           }
         if(mafast[0]!=EMPTY_VALUE && mafast[1]!=EMPTY_VALUE &&
            mainline[0]!=EMPTY_VALUE && mainline[1]!=EMPTY_VALUE &&
            mainline[0]<mafast[0] && mainline[1]>=mafast[1])
           {
            return 1;
           }
         break;
      case 3:
         //--- receipt and comparison of mafast (fast МА on the main indicator line) and maslow (slow МА on the main indicator line) values on the last two bars, except the current one
         copy=Copy_indi_Buffer(RbEN_handle,6,1,2,mafast,"RbEN");
         if(copy!=2) return 8;
         copy=Copy_indi_Buffer(RbEN_handle,7,1,2,maslow,"RbEN");
         if(copy!=2) return 9;
         if(mafast[0]!=EMPTY_VALUE && mafast[1]!=EMPTY_VALUE &&
            maslow[0]!=EMPTY_VALUE && maslow[1]!=EMPTY_VALUE &&
            maslow[0]<mafast[0] && maslow[1]>=mafast[1])
           {
            return 0;
           }
         if(mafast[0]!=EMPTY_VALUE && mafast[1]!=EMPTY_VALUE &&
            maslow[0]!=EMPTY_VALUE && maslow[1]!=EMPTY_VALUE &&
            maslow[0]>mafast[0] && maslow[1]<=mafast[1])
           {
            return 1;
           }
         break;
      default: return 3;
     }
//---
   return 2;
  }
There is an iteration performed in the Check_Indi_Close() block according to the input settings of all four methods of closing the open position:
//+------------------------------------------------------------------+
//| Check_Indi_Close                                                 |
//+------------------------------------------------------------------+
int Check_Indi_Close()
  {
   //--- declaration of arrays to obtain indicator data
   int copy=0;
   double _arr_ind_1[];
   double mafast[];
   double mainline[];
   double maslow[];
   _str_close="";
   //--- receipt and comparison with the zero line of the main line on the last two bars, except the current one
   if(close1)
     {
      copy=Copy_indi_Buffer(RbEN_handle,4,1,2,_arr_ind_1,"RbEN");
      if(copy!=2) return 4;
      _str_close="Close main line cross zero";
      if(_arr_ind_1[0]!=EMPTY_VALUE && _arr_ind_1[1]!=EMPTY_VALUE &&
         _arr_ind_1[0]>0 && _arr_ind_1[1]<=0)
        {
         return 0;
        }
      if(_arr_ind_1[0]!=EMPTY_VALUE && _arr_ind_1[1]!=EMPTY_VALUE &&
         _arr_ind_1[0]<0 && _arr_ind_1[1]>=0)
        {
         return 1;
        }
     }
   //--- obtaining the indicator color index from the indicator buffer No5 on the last two bars, except the current one
   if(close2)
     {
      copy=Copy_indi_Buffer(RbEN_handle,5,1,2,_arr_ind_1,"RbEN");
      if(copy!=2) return 5;
      _str_close="Close main line color";
      if(_arr_ind_1[0]!=EMPTY_VALUE && _arr_ind_1[1]!=EMPTY_VALUE &&
         _arr_ind_1[0]==0 && _arr_ind_1[1]!=0)
        {
         return 0;
        }
      if(_arr_ind_1[0]!=EMPTY_VALUE && _arr_ind_1[1]!=EMPTY_VALUE &&
         _arr_ind_1[0]==1 && _arr_ind_1[1]!=1)
        {
         return 1;
        }
     }
   //--- receipt and comparison of mafast (МА on the main indicator line) and mainline (main line of indicator) values on the last two bars, except the current one.
   if(close3)
     {
      copy=Copy_indi_Buffer(RbEN_handle,6,1,2,mafast,"RbEN");
      if(copy!=2) return 6;
      copy=Copy_indi_Buffer(RbEN_handle,4,1,2,mainline,"RbEN");
      if(copy!=2) return 7;
      _str_close="Close main line cross MAfast";
      if(mafast[0]!=EMPTY_VALUE && mafast[1]!=EMPTY_VALUE &&
         mainline[0]!=EMPTY_VALUE && mainline[1]!=EMPTY_VALUE &&
         mainline[0]>mafast[0] && mainline[1]<=mafast[1])
        {
         return 0;
        }
      if(mafast[0]!=EMPTY_VALUE && mafast[1]!=EMPTY_VALUE &&
         mainline[0]!=EMPTY_VALUE && mainline[1]!=EMPTY_VALUE &&
         mainline[0]<mafast[0] && mainline[1]>=mafast[1])
        {
         return 1;
        }
     }
   //--- receipt and comparison of mafast (fast МА on the main indicator line) and maslow (slow МА on the main indicator line) values on the last two bars, except the current one
   if(close4)
     {
      copy=Copy_indi_Buffer(RbEN_handle,6,1,2,mafast,"RbEN");
      if(copy!=2) return 8;
      copy=Copy_indi_Buffer(RbEN_handle,7,1,2,maslow,"RbEN");
      if(copy!=2) return 9;
      _str_close="Close two MA cross";
      if(mafast[0]!=EMPTY_VALUE && mafast[1]!=EMPTY_VALUE &&
         maslow[0]!=EMPTY_VALUE && maslow[1]!=EMPTY_VALUE &&
         maslow[0]<mafast[0] && maslow[1]>=mafast[1])
        {
         return 0;
        }
      if(mafast[0]!=EMPTY_VALUE && mafast[1]!=EMPTY_VALUE &&
         maslow[0]!=EMPTY_VALUE && maslow[1]!=EMPTY_VALUE &&
         maslow[0]>mafast[0] && maslow[1]<=mafast[1])
        {
         return 1;
        }
     }
//---
   return 2;
  }
- The Copy_indi_Buffer() block is created to receive the indicator data using the CopyBuffer() function.
- The TakeLastOpenTime() block is used to receive the time of the last open position for comparison (in OnTick) with the bar opening time to avoid multiple opening of the position on one bar.
- OpenPosition() — a function for position opening.
- Copy_Time() copies the time of the indicated bar.
- CloseAllPosition() closes all positions.
After creating the Expert Advisor we proceed to the input parameters optimization described in the next chapter.
Chapter 3. Optimization of the Expert Advisor's input parameters
Before running the Expert Advisor we should optimize the main input parameters. The EURUSD H1 2005-2015 symbol (genetic algorithm of optimization) is selected as an example. A separate optimization is performed for all four opening types.
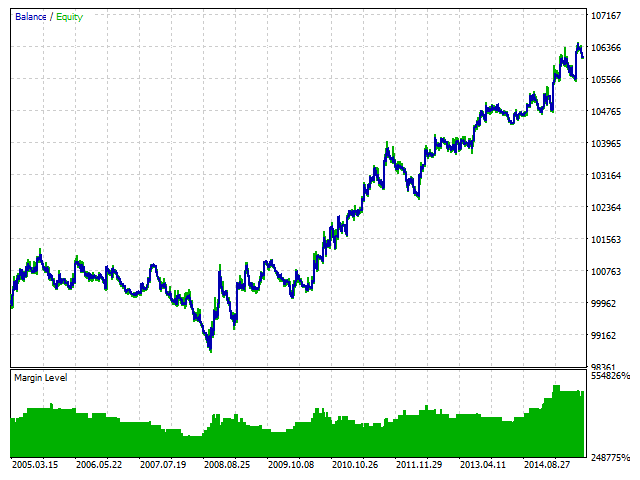
1. trade_mode = Close main line cross zero (main line intersection with 0: crossing upwards — buy, crossing downwards — sell).
Parameters for optimization:
Value Start Step Stop Steps StopLoss 0 50 10000 201 TakeProfit 0 50 10000 201 _period 1 1 200 200 close1 false true 2 Total passes 16160400
The optimization and the best test results can be viewed in the attached archive named optimization.zip in the folder "EURUSD H1 2005-2015\test1 - main line cross zero\".
2. trade_mode = Close main line color (opening when the main line color is changed from gray to green (buy) or from gray to red (sell)).
Parameters for optimization:
Value Start Step Stop Steps StopLoss 0 50 10000 201 TakeProfit 0 50 10000 201 _period 1 1 200 200 close2 false true 2 Total passes 16160400
The optimization and the best test results can be viewed in the attached archive named optimization.zip in the folder "EURUSD H1 2005-2015\test2 - main line color\".
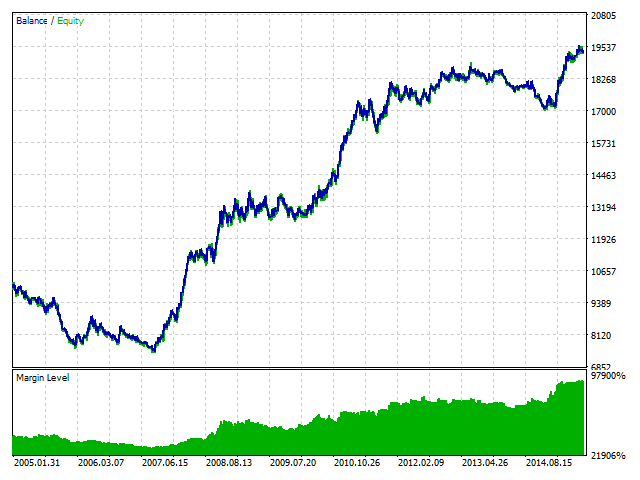
3. trade_mode = main line cross MAfast (opening at the main line intersection with the fast МА: the main line crosses MA above — buy, below — sell).
Parameters for optimization:
Value Start Step Stop Steps StopLoss 0 50 10000 201 TakeProfit 0 50 10000 201 _period 1 1 200 200 period_MA_fast 1 1 300 300 close3 false true 2 Total passes 4848120000 The optimization and the best test results can be viewed in the attached archive named optimization.zip in the folder "EURUSD H1 2005-2015\test3 - main line cross MAfast\".
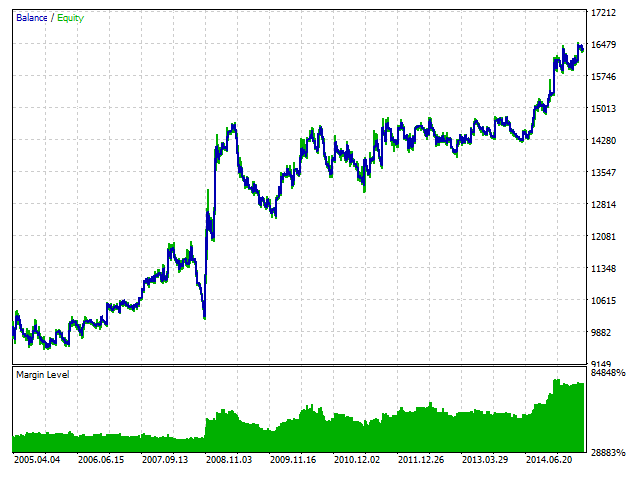
4. trade_mode = two MA cross (opening at the intersection of two MAs: the fast МА crosses the slow МА above — buy order, below — sell order).
Parameters for optimization:
Value Start Step Stop Steps StopLoss 0 50 10000 201 TakeProfit 0 50 10000 201 _period 1 1 200 200 period_MA_fast 1 1 300 300 period_MA_slow 1 1 400 400 close4 false true 2 Total passes 1939248000000 The optimization and the best test results can be viewed in the attached archive named optimization.zip in the folder "EURUSD H1 2005-2015\test4 - two MA cross\".
Conclusion
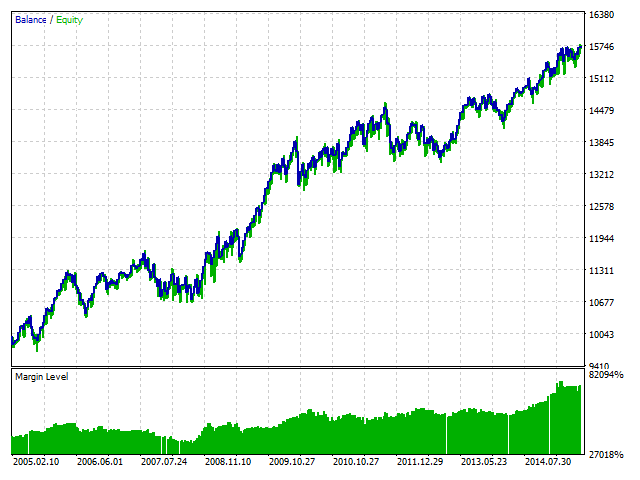
The optimization results prove this strategy's viability, considering that the Expert Advisor is built based on the pure logic of how the indicator works without using any additional functions for money management. Speaking of pure logic we imply the author's strategy of discovering the trend which is based on the static evaluation of bulls' and bears' vigor during the specified period of time. Using this indicator we define the core market entry points, therefore the indicator is applicable as both filter in its strategy and a base signal for opening trades.
See the attached files to find the indicator's and the Expert Advisor's source code that can be used for personal development in the field of programing and trading. This strategy was implemented and shown on small areas of use (basic signals for entry/exit), and has already demonstrated its working capacity at the initial stages.
Translated from Russian by MetaQuotes Ltd.
Original article: https://www.mql5.com/ru/articles/2027
Warning: All rights to these materials are reserved by MetaQuotes Ltd. Copying or reprinting of these materials in whole or in part is prohibited.
This article was written by a user of the site and reflects their personal views. MetaQuotes Ltd is not responsible for the accuracy of the information presented, nor for any consequences resulting from the use of the solutions, strategies or recommendations described.

 Graphical Interfaces I: Animating the Graphical Interface (Chapter 3)
 Graphical Interfaces I: Form for Controls (Chapter 2)
 Studying the CCanvas Class. Anti-aliasing and Shadows
 Graphical Interfaces I: Preparation of the Library Structure (Chapter 1)
- Free trading apps
- Over 8,000 signals for copying
- Economic news for exploring financial markets
You agree to website policy and terms of use