
Improved candlestick pattern recognition illustrated by the example of Doji
Introduction
One of the advantages of candlestick patterns is their simplicity: their description consists of only a few phrases, while the analysis handles only a few bars or even only one and thus it is accessible even to beginners.
Another advantage is the absence of specific requirements regarding the terminal and the hardware, as the analysis does not build any resource-intensive indicators. This fact was especially important decades ago, when computers were not as advanced as they are today. Many of the candlestick patterns were introduced in those days.
However, behind the simplicity of candlestick patterns, there is also a serious drawback, which can be eliminated by using the significantly increased capabilities of modern trading automation tools. This disadvantage is connected with the rough rounding of market situations to bar limits, which of course affects the efficiency of trading.
The disadvantage of conventional candlesticks and possible solutions
Bars on the chart have discrete, predefined start and end times. On the contrary, events in the market occur continuously. Some important price movement can start on one bar and end on another. In this case, the event looks completely different on the chart than if it happened entirely within on bar. It means that the same movement can be reflected in different ways on the chart.
Let us check the idea using the example of Doji candlesticks. One of the most interesting types of Doji is Gravestone (or Dragonfly, when inverted). It has a well-recognizable shape and is considered as a trend end and a potential reversal signal. This candlestick has approximately equal open and close prices, a very high upper shadow and almost no lower shadow:
Figure 1. The prefect Gravestone Doji
In the below example, the chart does not have such candlesticks:
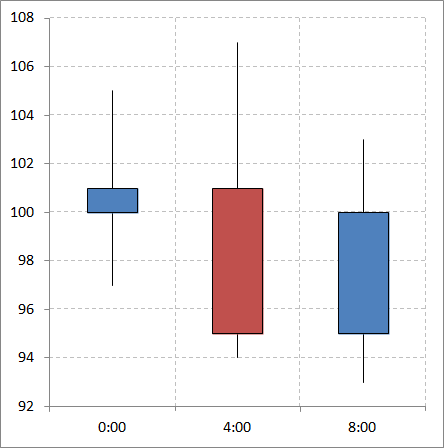
Figure 2. Regular H4 timeframe bars
Is it really so? Let's see what movements took place within these bars by switching to a lower timeframe:
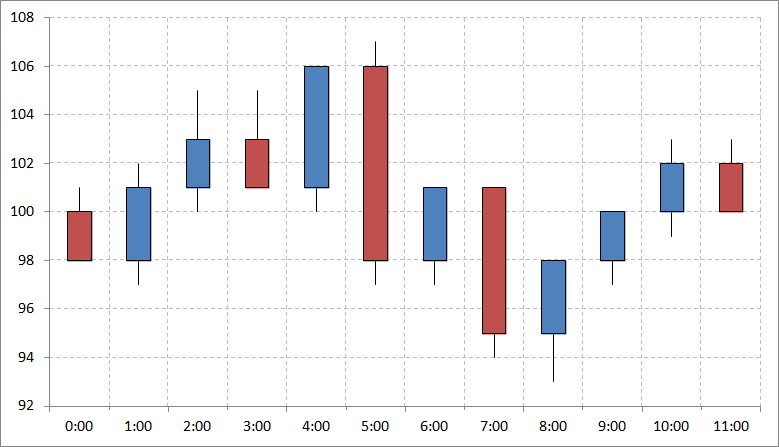
Figure 3. Regular H1 timeframe bars
In the above figure, close prices of some of the candlesticks are approximately equal to open prices of other bars. If we combine all bars, from 1 to 5, we will get a Doji candlestick. The same applies to bars from 6 to 9 and from 7 to 9. Let us call such groups of bars "metabars":
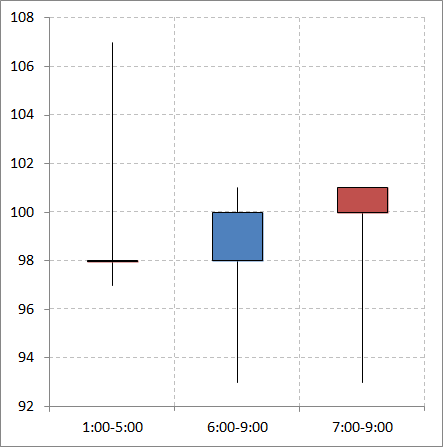
Figure 4. Metabars on the H1 timeframe
This is not magic or trick. These are real Doji candlesticks which are based on real price movements equal to 5, 4 and 3 H1 bars. We cannot see these Dojis on the standard H4 timeframe because the TF has a hard coded duration of 4 hours and a hard coded bar start time. A length difference of only one hour or a shift of the bar boundaries by one hour leads to very different results.
How many Doji candlesticks do we miss? In turn, missed candlesticks lead to missed trading signals.
But we cannot analyze the chats manually in an effort to find such metabars, as this would be time and effort consuming. A prefect option would be an indicator that can conduct such analysis automatically.
Developing an improved Doji indicator
First, we need to determine the input parameters that the indicator should have.
Let us see in detail what parts the Doji candlestick consists of.
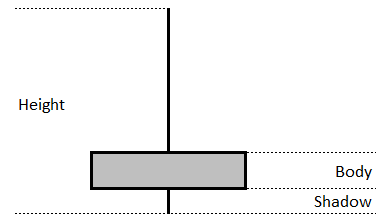
Figure 5. Candlestick structure
Height is the total height of the candlestick.
Body is the height of the candlestick body.
Shadow is the height of the shorter candlestick. A normal bar has two shadows: upper and lower. In case of a Doji, we are interested in the shorter candlestick because it should be almost absent, according to the Doji description, which however says nothing about the opposite shadow.
Doji candlesticks differ from other bars and candlesticks in the special proportions of their parts. The candlestick should have almost no body and almost no shorter candlestick. However, "almost no" is quite a fuzzy concept. It is assumed that each trader should decide for themselves whether the bar is similar enough to the Doji candlestick or not. When dealing with software indicators, we need clear, formal criteria. This means that we should be able to specify all these proportions in the indicator input parameters.
input double Candle_BodyPowerMax = 0.2; // Maximum body height relative to the candlestick height
That is, Candle_BodyPowerMax = Body / Height (see the figure above). To be more precise, this is the maximum ratio, above which a candlestick cannot be categorized as Doji. All bars with the ratio equal to or less than this value (up to zero) will be considered as Doji.
The same applies to the shadow:
input double Candle_ShadowPowerMax = 0.2; // Maximum shadow height relative to the candlestick height
Candle_ShadowPowerMax = Shadow / Height (see the figure above). To be more precise, this is the maximum ratio, above which a candlestick cannot be categorized as Doji. All bars with the ratio equal to or less than this value (up to zero) will be considered as Doji.
This set of parameters can be enough for the indicator that plots Doji based on single bars. But in our case, the indicator will operate with metabars. So, we also need an input to specify the number of bars in a metabar. This is the metabar width.
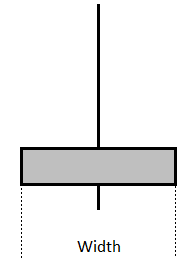
Figure 6. A special parameter for metabar-based candlesticks
The width should not necessarily be fixed (this is the advantage of metabars over regular timeframes), while it can be specified as a range:
input int     Candle_WidthMin          = 1;      // Minimum candlestick width in bars
input int     Candle_WidthMax          = 2;      // Maximum candlestick width in bars
If the user sets Candle_WidthMin = 1 and Candle_WidthMax = 1, all metabars will be equal to regular bars so this will be a classical Doji construction method. Otherwise, the indicator will iterate over all sequences of bars in the specified width range and will check if they together form a Doji candlestick.
At each bar, the terminal will operate not only with the bar itself, but also with a few older bars. We need to inform indicator about this in OnInit (indicator initialization) so that it makes a small indent at the beginning of history when drawing the indicator on the chart:
SkipBars = Candle_WidthMax;
PlotIndexSetInteger(0, PLOT_DRAW_BEGIN, SkipBars);
The SkipBars variable must be declared as global (be of time int). It should also be used in indicator calculations (in OnCalculate) to avoid indicator drawing and calculation on the oldest bars in history (this would cause metabar to form outside the history and will cause an error).
Below, I will describe the algorithm of the main part of the indicator in general terms.
| The main indicator cycle is organized in OnCalculate(): loop through all uncalculated indicator bars. This is needed to calculate all the values of the indicator. |
Inside this general loop, there is another loop to build all possible metabars, starting from the current bar and spreading into the past. It is a loop from 1 to Candle_WidthMax (indicator input). That is, the metabar is initially equal to one price bar. At each iteration, another bar from the price history is added to the metabar, and so on.
Adding a bar to a metabar is implemented through a comparison of the bar's OHLC with the metabar's OHLC. As a result of this operation, the metabar accumulates the extreme values and gradually, step by step, calculates its growing sizes.
For each metabar, the indicator calculates the parameters of the corresponding candlestick (body height, shadow height and width). It also checks whether the values comply with the value limits specified in input parameters.
If a candlestick turns out to be the desired Doji candlestick, the following happens:
The indicator draws a vertical line in the direction of the candlestick (up or down). The line height is equal to the width of the candlestick.
The metabar extension loop breaks.
The full indicator code is attached below.
Let us view the indicator operation in the terminal.
Here the indicator has found one-bar Doji candlesticks:
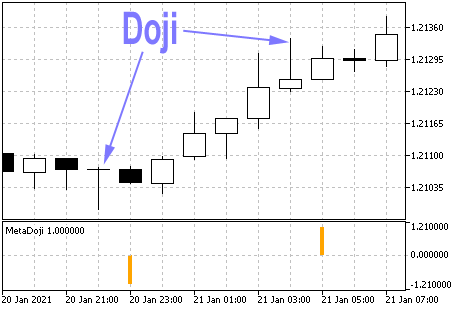
Figure 7. The indicator notifies of one-bar Doji candlesticks
The Doji candlesticks in the chart are one bar behind the indicator signals, since the indicator analyzes only completed bars. The purpose of the indicator is not to display the candlesticks but to generate real-time signals notifying that the formation of a Doji candlestick has completed (and that it will remain unchanged). This candlestick can consist of multiple bars. The indicator displays the width of the found candlestick as a value of its line height. In this case it is "1" for the upward directed candlestick and "-1" for a downward directed one.
Now, let us view a Doji candlestick consisting of five bars. Generally, the main purpose of the indicator is to search for such compound candlesticks:
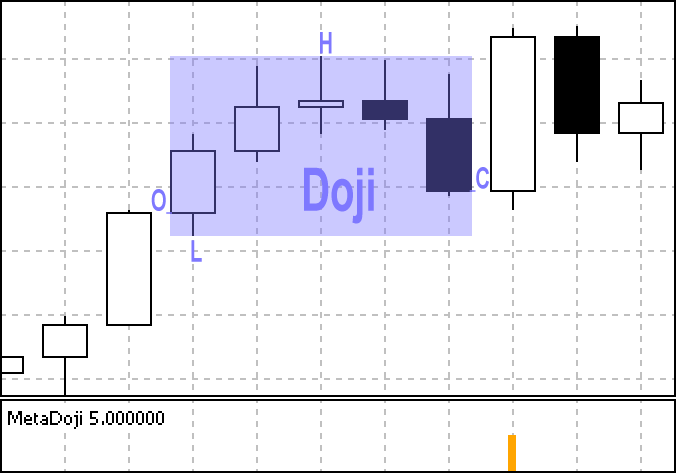
Figure 8. The indicator notifies of Doji candlestick consisting of five bars
We see that the Doji searching algorithm works correctly. In the above figure, I highlighted the sizes of the found metabar and its OHLC price levels.
However, for the effective practical application of this indicator, we need to take into account one more aspect. Candlesticks can differ in size: some are large, others are very small. Some of them can be so small, much smaller than adjacent bars, that they can be considered as noise, so they can hardly be treated as significant price movements. The practical application of such small Doji candles is zero. They cannot serve as indications of a trend beginning or end, or signs of anything else.
Therefore, we need to improve the indicator so that it only shows large Doji candlesticks. The problem solution seems simple: we can add the following input parameter to the indicator:
input double Candle_HeightMin = 0.01; // Minimum candlestick height (in absolute prices)
Then, OnCalculate would filter all found candlesticks according to this criterion.
This solution would work perfectly if candlesticks were constructed based on ordinary single bars. Due to the use of metabars, we have an unobvious problem which reduces the efficiency of this solution. An ordinary single bar has some statistically average height. Let's call it the value h. If we need to find large Doji candlesticks, we can set Candle_HeightMin equal to, let's say, 2*h, in the indicator settings. But what if we need to find large Doji candlesticks based on metabars which can have a width, for example, of 1 to 4 bars? Then a metabar consisting of 4 medium-height bars can have a total height of 2*h (if first two bars go up one after another, and then two bars go down).
The indicator will display a Doji on such a metabar, as it meets the medium height condition. But will it be right? In fact, this candlestick consists of mediocre bars and can hardly be considered as a sign of a strong price movement.
Setting Candle_HeightMin equal to 4*h would also be wrong in this case, since our metabars can have a width of 1 bar, and this would be too strong a threshold. In this case, the indicator would miss good 2*h and 3*h candlesticks.
So, we need to create a metabar height filter characterizing the strength of the price movement which is equally powerful and achievable for any metabars, including those consisting of one bar and of four bars.
The solution to this problem is quite simple. Candle_HeightMin should be specified in relative values rather than absolute ones. That is, it is not the absolute height of the metabar, but its height per unit of time. Candlestick Height/Width
Furthermore, we can express this parameter in price points. In this case, the indicator settings will not depend on the selected currency pair. All other settings, such as Doji body and shadow size, are also not tied to absolute prices.
So, instead of the Candle_HeightMin input parameter, we will use the following:
input double Candle_HeightPowerMin = 0.5; // Candlestick power = Height/Width, points per minute
The filter by this criterion in the indicator code will look like this:
if ((CandleHeight/CandleWidth/_Point) < (Candle_HeightPowerMin*PeriodSeconds()/60)) DojiExists = false;
Now the indicator is ready for practical use. The full indicator code is attached below.
Indicator testing
It's time to check what we have developed. During the test, we will measure the efficiency of the resulting metabar-based indicator in finding Doji candlesticks. We will check by how many times it is more efficient than the classical variant with one candlestick per bar.
On the EURUSD H4 chart, run the indicator with the following settings:
| Candle_WidthMin | 1 |
| Candle_WidthMax | 1 |
So, the indicator is set to search for only one-bar Doji candlesticks.
The limit values will be set so that the total size of the Doji candlestick body and shade are less than half of the candlestick height:
| Candle_BodyPowerMax | 0.2 |
| Candle_ShadowPowerMax | 0.2 |
These are quite liberal settings regarding the sizes of the candlestick body parts. In real trading, you may want to set them to 0.1 or close to zero in order for the Doji candlesticks to be almost perfect. The main purpose of current testing is to compare the number of candlesticks recognized by two different methods (single-bar and metabar). The sample should be large enough in order to reduce the statistical error.
For the same reasons, we will not set too high requirements for the candlestick height. For now, this filter will be zero to view all Doji candlesticks, including strong and weak:
| Candle_HeightPowerMin | 0 |
So, all parameters are set. This is the indicator chart in the terminal:
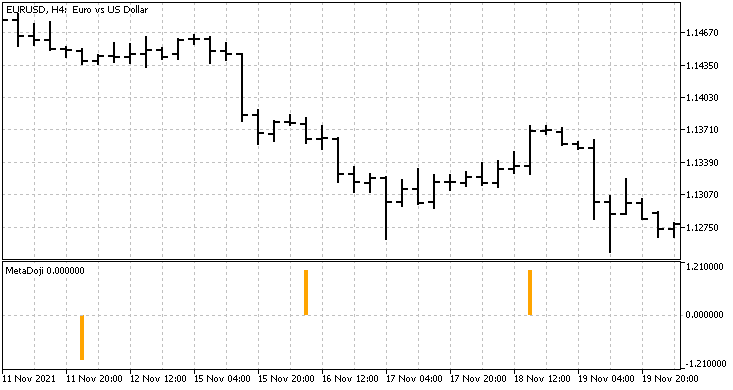
Figure 9. Doji candlestick indicator constructed on regular (single) H4 bars
If you scroll the chart, you will see that, for example, there were only 9 such Doji candlesticks in two months. This was the traditional candlestick construction method using single bars.
To evaluate the advantage of metabars, let's now change the chart timeframe to H1 and modify the indicator input parameters:
| Candle_WidthMin | 4 |
| Candle_WidthMax | 4 |
Now, the indicator will look for candlesticks four H1 bars wide each. This metabar is as wide as the traditional H4 bar from the previous example. The only difference is that classical bars have strict start times: 0:00, 4:00, 8:00, etc. Metabars will have four times more start times: 0:00, 1:00, 2:00, 3:00, 4:00, etc. The width is the same, but much more flexibility over time. Let's see the result:
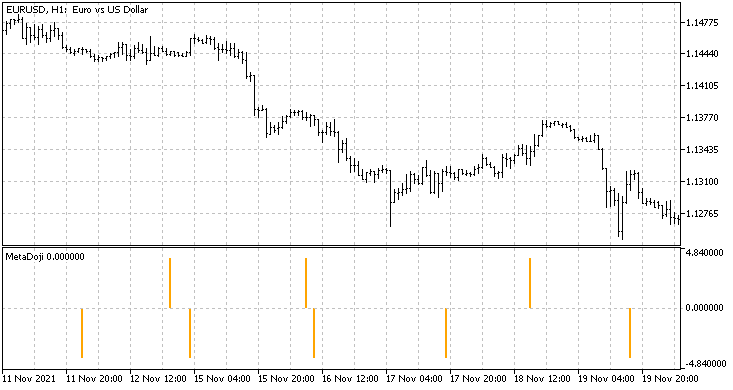
Figure 10. Doji candlestick indicator constructed on metabars each consisting of four H1 bars
Figure 10 shows the same price segment as Figure 9. This time there are a lot of additional Doji candlesticks. For a period of two months, in total, the metabar indicator identified 54 Doji candles.
This is 6 times more than the classical method! The advantage of the new method is obvious.
Next, let's check the variant with both the flexible start time and the flexible H1-based metabar width — the width will slightly fluctuate relative to the conventional H4 bar:
| Candle_WidthMin | 3 |
| Candle_WidthMax | 5 |
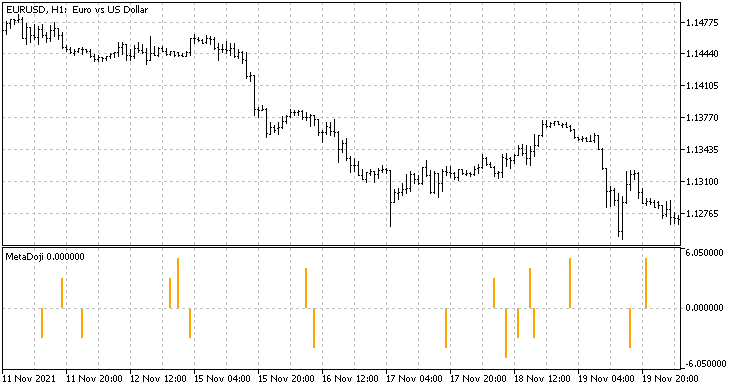
Figure 11. Doji candlestick indicator constructed on metabars each consisting of 2-5 H1 bars
The number of Doji candlesticks has increased even more. Pay attention that the H5 timeframe does not exist in the terminal, and thus such Doji candlesticks cannot be constructed using classical construction methods.
By covering all possible non-standard timeframes, we can obtain a maximum increase in detected Doji candlesticks, compared to the classical method. For this purpose, let's run the indicator on the minimum available M1 timeframe with the following settings:
| Candle_WidthMin | 180 |
| Candle_WidthMax | 300 |
This seems to be the same as in the 3-5 H1 range above. With the only difference being that here we have an even more flexible bar start times: minutes instead of hours. However, the real difference is much deeper: we will obtain metabars with an extremely flexible width, which are not only the hourly integer values H1 (3, 4, 5), but also real values, such as 199 M1, which is 3.32 H1 or 6.63 M30; 39.8 M5 etc. These are very non-standard timeframes in terms of classical trading. Traders never construct any candlesticks on such timeframes. And here hundreds of such timeframes are combined in one indicator, on a single chart:
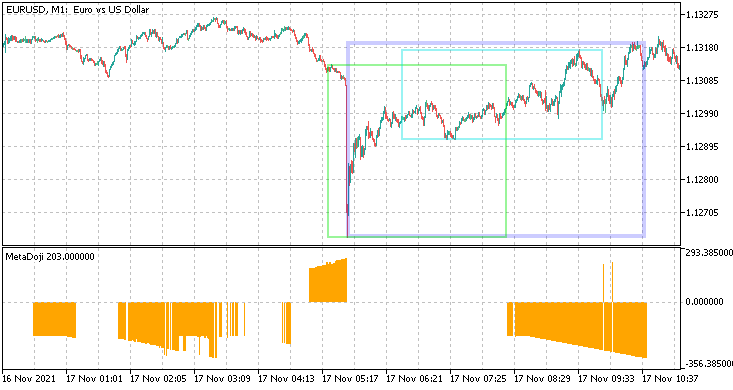
Figure 12. Doji candlestick indicator constructed on metabars each consisting of 180-300 M1 bars
Now we have thousands of indicator signals. In this mode, Doji candlesticks are found almost everywhere. Since the metabars in this example are very wide (wider than one bar by two orders of magnitude (!)), they overlap each other. Since the indicator reports the width of all found Doji candlesticks, we can find their boundaries on the price chart. I have marked some of these metabars with colored rectangles.
What is really striking in the figure above, is that one and the same long sequence of prices can be both part of an upward Doji candlestick and of a downwardly directed one! This may seem like madness and chaos which is incompatible with any kind of trading. But in fact, there is no error or problem here. We did not use a height filter for the identified candlesticks, therefore many of them are quite short — at a level of a price fluctuations noise, which is why they easily change their direction with a small time shift or a small change in the candlestick width. Let us try to overcome this noise by setting a filter in the indicator settings:
| Candle_HeightPowerMin | 2 |
Now the situation is quite different: the chart features only strong candlesticks and the sequences of detected candlesticks now have the same directions:
Figure 13. Doji candlestick indicator constructed on metabars each consisting of 180-300 M1 bars, with the height filter
The M1 timeframe with wide metabars has enabled us to look into a new dimension that was previously inaccessible. Each dense sequence of candlesticks displayed on such an indicator describes in fact one candlestick which changes in time. The analysis of this dynamics might allow someone to make additional conclusions about candlesticks which are not available in the traditional approach, in which a candlestick was considered as a static entity bound to one bar. With static candlesticks, there is no information about what would happen to the candlestick if the time parameter slightly changed. This new area is now available for research.
Conclusion
In this article, experiments have convincingly shown that the use of metabars allows a more detailed analysis of candlestick patterns:
-
finding more patterns than with classical methods
-
finding them in additional candlesticks, where traditional methods are basically unavailable
-
having greater flexibility and convenience (while using a single chart), with the possibility to customize for specific trader tasks
-
accurately tracking the candlestick formation beginning and end, monitoring the candlestick change dynamics throughout its lifetime
The techniques described in this article are applicable not only to Doji, but they can expand the possibilities in interpreting all other classical candlesticks.
However, the article does not consider all the nuances. Indicator is not trading yet. The practical effect of the metabar indicators may differ depending on trading strategies. Doji candlesticks are not trading signals, so you should not expect that the number of trades with metabars will increase as much as the indicator signals have increased. Doji candlestick trading requires additional analysis and verification of additional market conditions. Is it possible to combine metabars with other types of analysis (on conventional bars)? How will it affect the number of trades? We have seen a large number of successive indicator signals on the M1 timeframe, which are essentially one candlestick. Undoubtedly, due to the volatile and stretched nature of this candlestick, it can fit into various market situations that arise during its lifetime. This increases the chances of generating a useful signal (to open or close a trade) where the conventional candlestick would show no signal.
Reliable statistics regarding the number of deals can only be obtained from further experiments. This is a rather large topic for a separate study. If traders find this article describing an indicator interesting, I may continue the experiment in one of the next articles to check the behavior in a trading strategy.
Translated from Russian by MetaQuotes Ltd.
Original article: https://www.mql5.com/ru/articles/9801
Warning: All rights to these materials are reserved by MetaQuotes Ltd. Copying or reprinting of these materials in whole or in part is prohibited.
This article was written by a user of the site and reflects their personal views. MetaQuotes Ltd is not responsible for the accuracy of the information presented, nor for any consequences resulting from the use of the solutions, strategies or recommendations described.
 Matrices and vectors in MQL5
 Learn how to design a trading system by Bollinger Bands
 Combinatorics and probability for trading (Part V): Curve analysis
- Free trading apps
- Over 8,000 signals for copying
- Economic news for exploring financial markets
You agree to website policy and terms of use
Это не какая-то магия или лукавый трюк. Это самые настоящие свечи Доджи, основанные на реальных ценовых движениях длиной в 5, 4 и 3 часовых баров, которые не было видно на стандартном таймфрейме H4 просто потому, что там жестко задана длина бара в 4 часа и жесткое время начала этого бара. Отличие длины всего на 1 час или сдвиг границ бара на 1 час приводят к серьезной разнице в результате.
How many of these Dodgy candles are not seen by traders? And that's a huge number of missed signals for trading.
One problem. All candlestick patterns, as well as the rest of technical analysis, work only because everyone sees them (self-fulfilling prophecy).
And for the masses to start looking at these "shifted" patterns, they must become popular. But they won't, because they won't work (see point 1).
Such a vicious circle ;)
But the idea is interesting, thanks for the article.
All known price patterns, if they are put together like this, will turn into some known candlestick pattern. And vice versa.
This is such a fixation of extremum and price return to the same values with an extended range in time) I.e. if in the return prices coincide with growth prices on the border of bars of smaller TFs, it is a change of direction, and if they do not coincide, then no)))))
I don't even know, but there may be logic in it, but definitely not 100%
Interesting article, as the author has identified an important analytics problem, viz:
in traditional TA, no elementary structure suitable for analysis at any moment, which is present on the graph without discontinuities in time and has reliable parameters, has been identified. In physics it is an atom, in chemistry it is a molecule or an element of the Mendeleev table. Someone will say, what is wrong with a candle?
The candlestick is convenient and is constantly present on the chart, but the point is that its Close level is not reliable, as it is not fractal, but only an intermediate level within the corrective movement.
Perhaps a useful indicator would be showing which older candles are formed, more than a month TF, here MN goes over the day, but last month it managed to catch the last month clearly