
Learn how to design a trading system by Stochastic
Introduction
One of the most beautiful things in technical analysis trading is that we have a lot of tools and we can use one tool individually or combine more than one tools and this can be useful and profitable for us. In addition to that, we have an amazing tool which can be very helpful in enhancing our trading results and performance. This tool is programming allowing us to create programs which can be very useful and helpful: we give the computer instructions to do what we need automatically and accurately according to our conditions.
This article is another contribution to trying to learn and teach what can be helpful in this context of technical trading and programming of profitable trading strategies. We will discuss through this article a new tool that can be useful in our trading and it is the "Stochastic Oscillator" indicator which is one of the most popular in trading using technical analysis. If you read my other articles here, you should know that I like learning and teaching roots of things to understand all the details and the mechanism of things working as much as I can. So, I will discuss with you this topic using the same method. The following topics will be covered in this article:
Through the "Stochastic definition" topic, we will learn about the Stochastic Oscillator indicator in detail to know what it is, what it measures. Then, in "Stochastic strategy", we will learn some simple strategies that we can use. After that we will design a blueprint for these simple strategies to help us code them in MQL5 so that further we can use them in MetaTrader 5 — this will be considered in the "Stochastic blueprint" topic. Then we will proceed to learning how to write a code to design a trading system for these simple strategies — this will be done in the topic of "Stochastic trading system".
We will use the MetaTrader 5 trading terminal and MetaQuotes Language, which is built-in with MetaTrader 5. The terminal can be downloaded at the following link: https://www.metatrader5.com/en/download
Disclaimer: All information is provided 'as is' only for educational purposes and is not prepared for trading purposes or advice. The information does not guarantee any kind of result. If you choose to use these materials on any of your trading accounts, you will do that at your own risk and you will be the only responsible.
Now, we will start our new journey about a new interesting topic, let us do it.
Stochastic definition
In this part, we will learn in more detail about one of the most popular technical indicators, which is the Stochastic Oscillator indicator. It was developed by George Lane and this what is mentioned in "New Trading Systems and Methods" book by Perry J. Kaufman. But there are other opinions about that, one of them is that it is not absolutely clear who created the Stochastic indicator — this is mentioned in book "Technical Analysis, The Complete Resource for Financial Market Technicians" by Charles D. Kirkpatrick and Julie R. Dahlquist and the other opinion is that the indicator was popularized by George Lane as per what is mentioned in "Technical Analysis of The Financial Markets" book by John J. Murphy.
The idea behind the Stochastic indicator is as follows: there was an observation that during the uptrend, closing prices tend to close closer to the upper part of the price range for a specific period and vice versa, during the downtrend, closing prices tend to close closer to the lower part of the price range for a specific period. It measures the relationship between the current closing price and both the highest and lowest prices of a specific period.
The Stochastic Oscillator indicator consists of two lines and these two lines oscillate between zero level and 100 level:
- %K line is the fastest line.
- %D line is the slowest line, it is smoothed.
There is more than one version for the Stochastic Oscillator indicator. The most popular versions are the following two:
- The fast Stochastic.
- The slow Stochastic.
We will see the difference in the methods in which the Stochastic Oscillator indicator can be calculated.
The following are the steps to calculate the Stochastic Oscillator indicator:
- Determine the period that is needed to calculate the indicator.
- Determine the highest high value of the determined period.
- Determine the lowest low value of the determined period.
- Get %K of fast stochastic = 100*((current close-lowest low)/(highest high-lowest low))
- Get %D of fast stochastic = 3 moving average of %K of fast stochastic
- Get %K of slow stochastic = %D of fast stochastic
- Get %D of slow stochastic = 3 moving average of (%K of slow stochastic which is the same of %D of fast stochastic)
Now, let us see an example of how to apply these calculations to get the Stochastic Oscillator indicator. If we have the following data:
| Days | Close | High | Low |
|---|---|---|---|
| 1 | 100 | 110 | 90 |
| 2 | 130 | 140 | 120 |
| 3 | 140 | 160 | 120 |
| 4 | 130 | 150 | 110 |
| 5 | 120 | 140 | 100 |
| 6 | 140 | 150 | 130 |
| 7 | 160 | 170 | 150 |
| 8 | 170 | 180 | 160 |
| 9 | 155 | 170 | 150 |
| 10 | 140 | 170 | 130 |
| 11 | 160 | 180 | 155 |
| 12 | 180 | 190 | 175 |
| 13 | 190 | 220 | 190 |
| 14 | 200 | 230 | 200 |
| 15 | 210 | 215 | 205 |
| 16 | 200 | 200 | 190 |
| 17 | 190 | 195 | 180 |
| 18 | 185 | 105 | 180 |
| 19 | 195 | 210 | 185 |
| 20 | 200 | 220 | 190 |
To calculate the Stochastic Oscillator indicator we will follow the previously mentioned steps, so we do the following:
- Determine the period which will be = 14, so we need first to have 14 trading periods to start calculating the indicator.
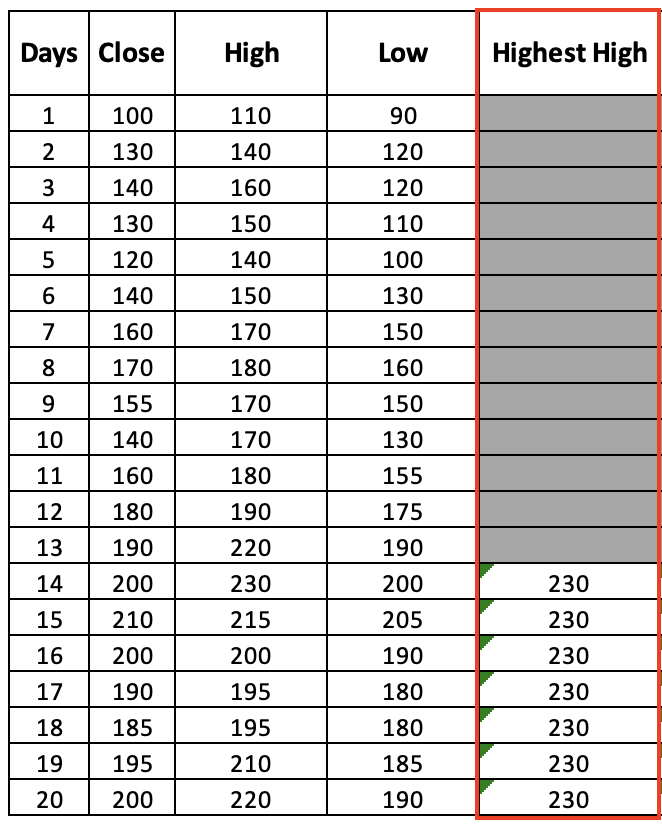
- Determine the highest high of the last 14 periods, it will be (230) and the following picture will show us that for the first value and the rest of the data:
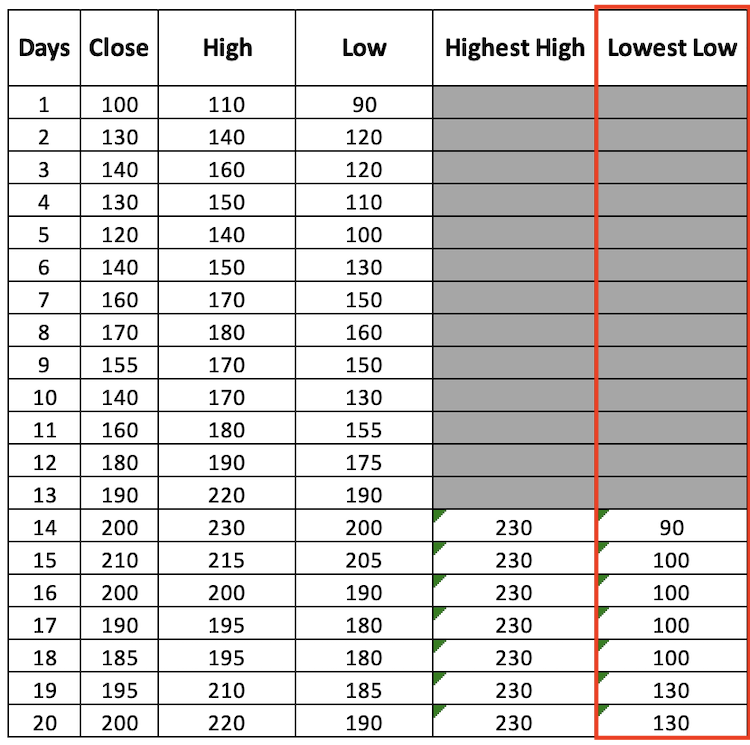
- Determine the lowest low of the last 14 periods, it will be (90) and the following picture will show us that for the first value and the rest of the data:
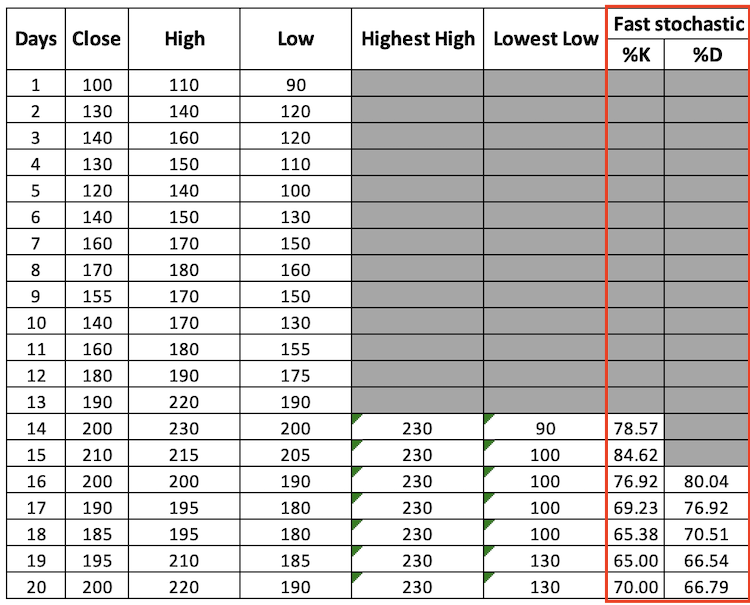
- Get the %K of fast stochastic = 100*((current close - lowest low)/(highest high- lowest low)),
- Get the %D of fast stochastic = 3 moving average of %K of fast stochastic,
- The following picture will show us the results of the calculation for the available data:
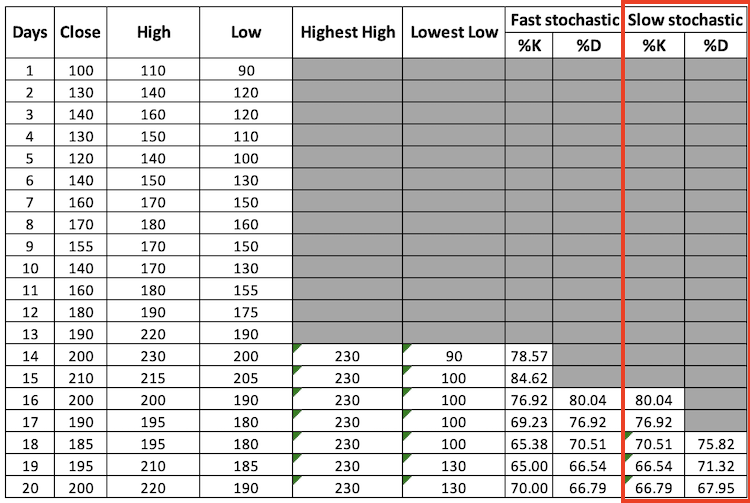
- Get the %K of slow stochastic = %D of fast stochastic,
- Get the %D of slow stochastic = 3 moving average of %K of slow stochastic,
- The following picture will show us the results of the calculation for the available data:
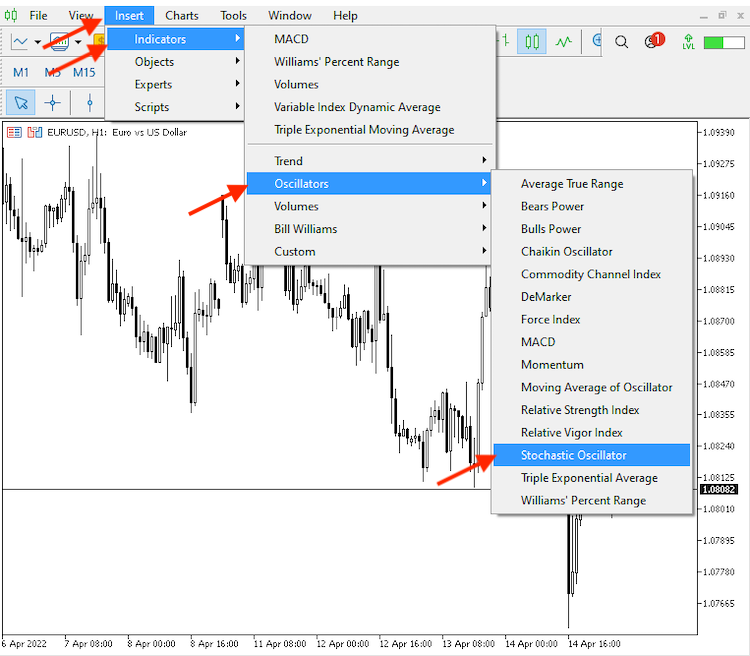
Through the previous steps, we calculated the Stochastic Oscillator indicator manually. Fortunately, we do not need to calculate it manually every time as we have a ready-to-use built-in indicator in the MetaTrader5 trading terminal. We can simply choose it from the list of available indicators in the platform by clicking on the Insert tab from MetaTrader 5 as it is shown in the following picture:
After choosing the "Stochastic Oscillator", the following window will be opened for the parameters of the indicator:
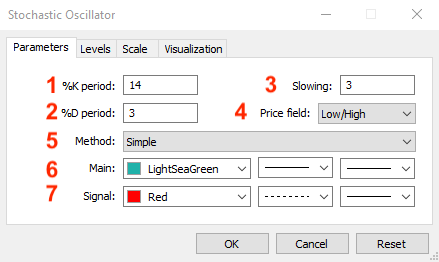
Parameters of the indicator:
- Determines the period
- Determines the moving average period for %D fast
- Determines the moving average period for %D slow
- Determines the price filed to measure the relation to it
- Determine the moving average type which will be used in the calculation
- Determine %K's line color, line style, and line thickness
- Determine %D's line color, line style, and line thickness
After determining parameters according to your preferences, the indicator will be attached to the chart and will appear like in the following picture:
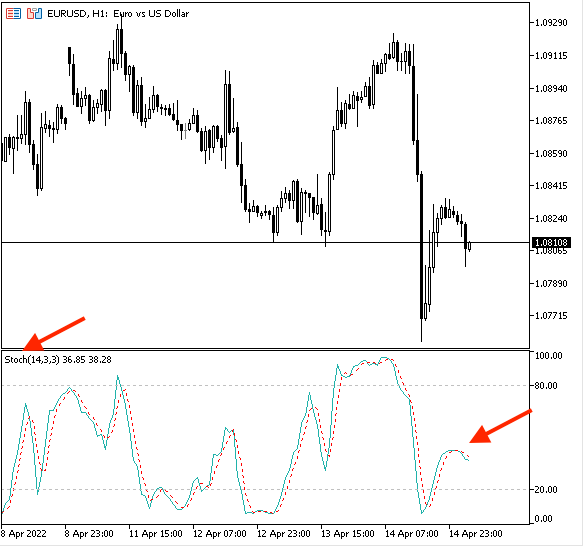
After inserting the Stochastic Oscillator, we can find according to the previous picture that we have the indicator plotted in the lower window with 2 lines (%K, %D) oscillating between zero and 100 and we can find it the same as the below:
- Stoch(14, 3,3): represents the name of the indicator and chosen parameters: 14 periods, 3 for the moving average of %D of the fast stochastic, 3 for the moving average of %D of the fast stochastic.
- 36.85: represents the %k value
- 38.28: represents the %D value
According to the calculation of the Stochastic Oscillator indicator, it will move to the direction of the market in a specific form most of the time as we knew that closing prices tend to close near to the upper or lower price range of a specific period according to market movement.
During uptrend:
An uptrend is a market direction in which prices move up because of the control of buyers or bulls. Usually prices create higher lows and higher highs. In this case, we can call this market a bullish market.
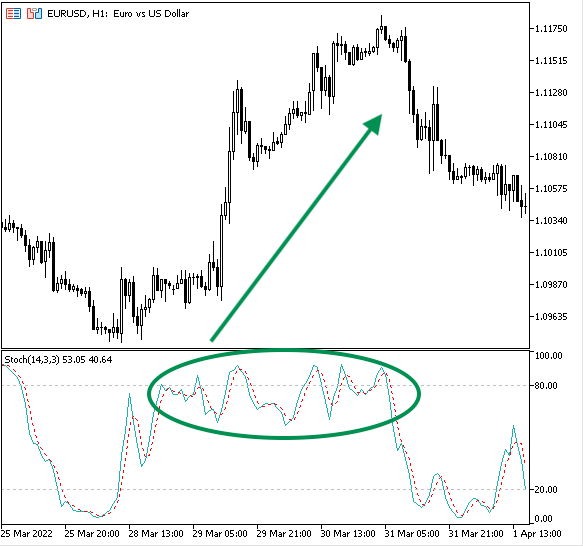
We can find during this market direction that most of the time, closing prices tend to close near the upper part of range price during that period of movement "Uptrend" and the stochastic indicator will oscillate between 50 level and 100 level. An example of this situation is shown in the following picture:
During downtrend:
A downtrend is a market direction in which prices move down because of the control of sellers or bears. The prices create lower highs and lower lows. In this case, we can call this market a bearish market.
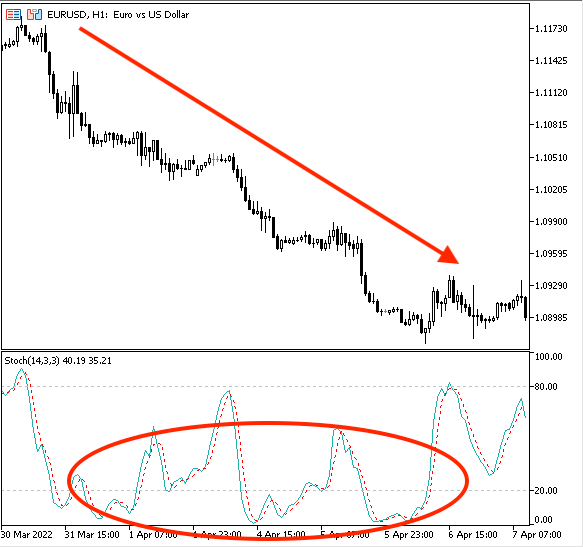
During this market direction most of the time closing prices tend to close near the lower range of price movements during that "Downtrend" movement period. So, we may find that the stochastic indicator moves between 50 level and 0 levels during downward movement period. An example of this situation is shown in the following picture:
During sideways:
A sideways is a price movement that is a movement without a clear direction either up or down. It can be considered as a balance between buyers and sellers or bulls and bears. It is any movement except uptrend or downtrend.
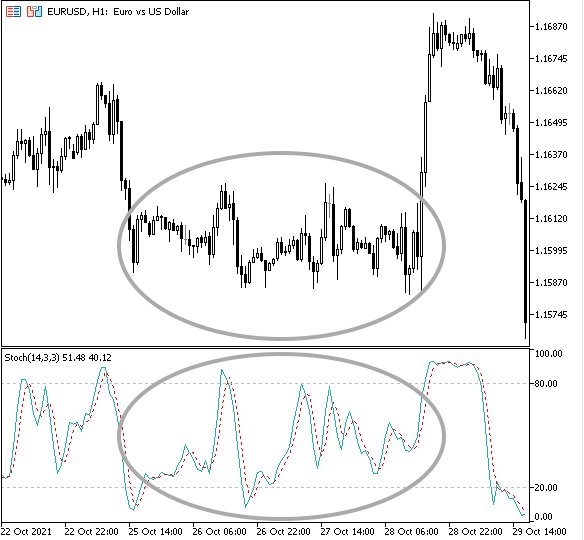
During this sideways movement there is no clear movement up or down, the prices tend to close near to mid-range of prices for that period of movement "Sideways" and so, we may find that most of the time, the stochastic moves around 20 and 80 levels and the following picture is an example for that:
Now that we have analyzed how the stochastic indicator may act in different market movements. Now we need to learn how we can use it in our favor, and this is what we will learn through the following topic.
Stochastic strategy
In this part, we will talk about how we can use this indicator through simple strategies. We can get signals from the stochastic indicator according to market trend and these strategies are uptrend strategy, downtrend strategy, and sideways strategy.
- Strategy one: Uptrend strategy
According to this strategy, we need to check if the %K line and %D line are below the 50 level, then, the buy signal will be generated when the %K line crosses above the %D line. We can take profit according to another effective tool like price action by searching for a lower low for example.
%K, %D < 50 --> %K > %D = buy signal- Strategy two: downtrend strategy
According to this strategy, we need to check if the %K line and %D line are above the 50 level, then, the sell signal will be generated when the %K line crosses below the %D line. We can take profit according to another effective tool like price action by searching for a higher high for example.
%K, %D > 50 --> %K < %D = sell signal- Strategy three: sideways strategy
- The buy signal:
According to this strategy, we need to check if the %K line and %D line are below the 20 level, then, the buy signal will be generated when the %K line crosses above the %D line. When the %K line and %D line are above 80, then the take profit signal will be generated when the %K line crosses below the %D line.
%K, %D < 20 --> %K > %D = buy signal%K, %D > 80 --> %K < %D = take profit
- The sell signal
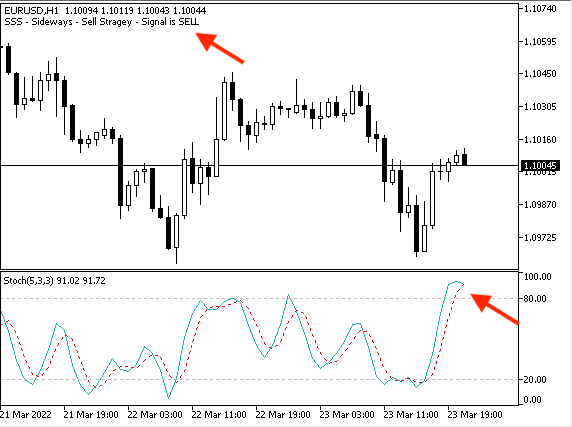
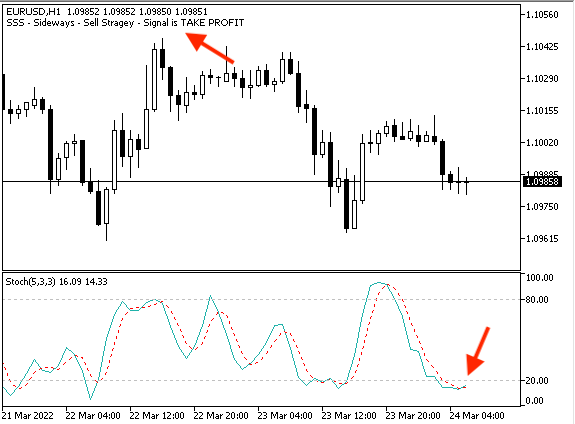
According to this strategy, we need to check if the %K line and %D line are above the 80 level, then, the sell signal will be generated when the %K line crosses below the %D line. When the %K line and %D are below the 20 level, then, the take profit signal will be generated when the %K line crosses above the %D line.
%K, %D > 80 --> %K < %D = sell signal
%K, %D < 20 --> %K > %D = take profit
I'd like to mention here that there are many stochastic strategies that can be used, from simple to complicated strategies and this indicator can be used individually or combined with another tool in a way that can give better results but here we mention only simple strategies to understand how this indicator can be used.
Stochastic blueprint
In this part, we will design a blueprint for previously mentioned strategies which should help us easily create a trading system. This blueprint will be a step-by-step guideline to identify what we need the program to do exactly.
- Strategy one: uptrend strategy
%K, %D < 50 --> %K > %D = buy signal
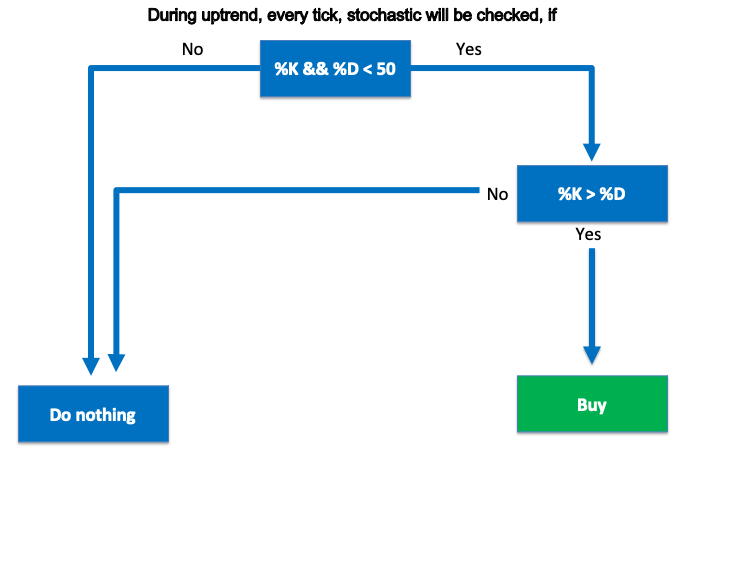
We first need the program to check (%K, %D) and decide if it is below or above the 50 level, then if it is below the 50 level, it will wait to do nothing till the %K line crosses above %D line to give the buy signal. If (%K, %D) is above or equal to the 50 level, the program will do nothing.
The following picture is a blueprint for this uptrend strategy:
- Strategy two: downtrend strategy
%K, %D > 50 --> %K < %D = sell signal
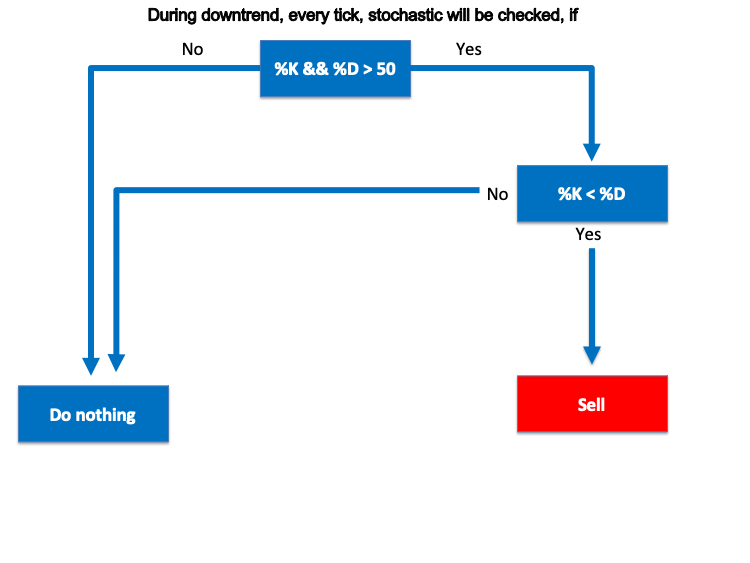
We first need the program to check (%K, %D) and decide if it is above or below the 50 level, then if it is above the 50 level, it will wait to do nothing till the %K line crosses below %D line to give the sell signal. If (%K, %D) is below or equal to the 50 level, the program will do nothing.
The following picture is a blueprint of this strategy:
- Strategy three: sideways strategy
The buy signal:
%K, %D < 20 --> %K > %D = buy signal
%K, %D > 80 --> %K < %D = take profit
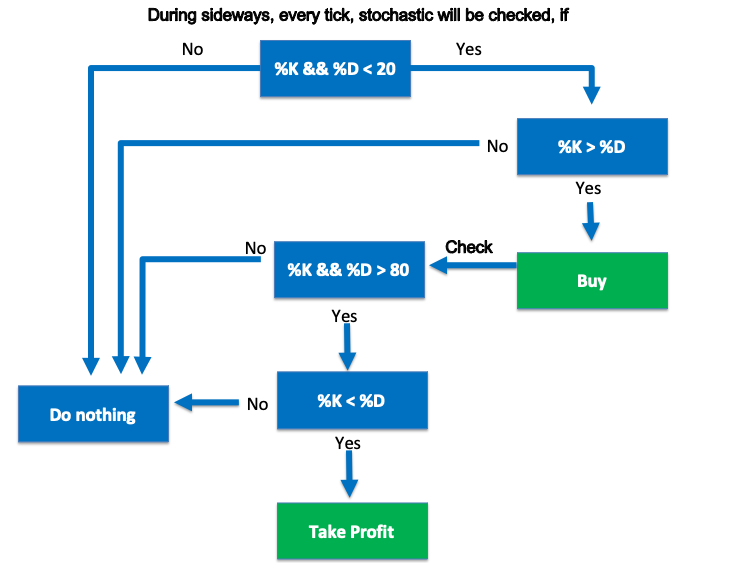
We first need the program to check (%K, %D) and decide if it is below or above the 20 level, then if it is below the 20 level, it will wait to do nothing till the %K line crosses above %D line to give the buy signal. If (%K, %D) is above or equal to the 20 level, the program will do nothing. Then, the program will check (%K, %D) and decide if it is above or below the 80 level, then if it is above the 80 level, it will wait to do nothing till the %K line crosses below the %D line to give the take profit signal. If (%K, %D) is below or equal to the 80 level, the program will do nothing.
The following picture is a blueprint for this strategy:
The sell signal:
%K, %D > 80 --> %K < %D = sell signal
%K, %D < 20 --> %K > %D = take profit
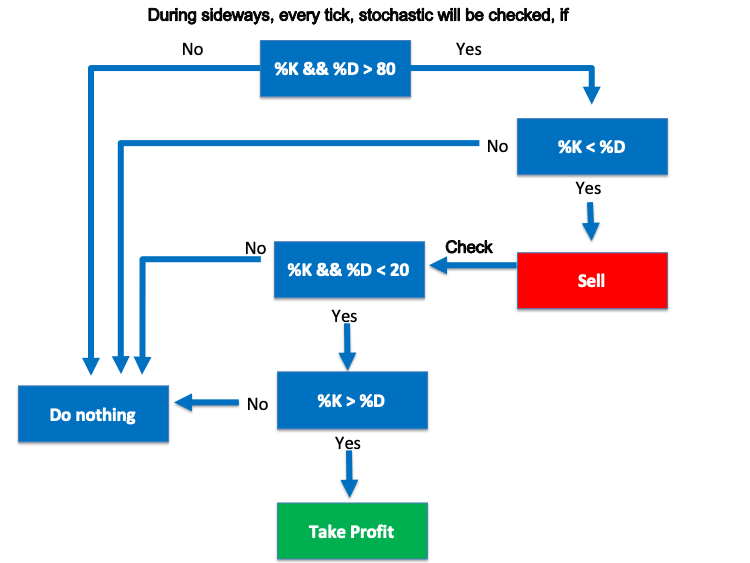
We first need the program to check (%K, %D) and decide if it is above or below the 80 level, then if it is above the 80 level, it will wait to do nothing till the %K line crosses below %D line to give the sell signal. If (%K, %D) is below or equal to the 80 level, the program will do nothing. Then, the program will check (%K, %D) and decide if it is below or above the 20 level, then if it is below the 20 level, it will wait to do nothing till the %K line crosses above the %D line to give the take profit signal. If (%K, %D) is above or equal to the 20 level, the program will do nothing.
The following picture is a blueprint for this sell signal of sideways strategy:
So far, we have considered simple strategies that can be used by the stochastic indicator and we have designed blueprints for these strategies to help us to create a trading system. In the next part, we will learn how to design this trading system.
Stochastic trading system
Now, we will start an interesting part in this article to learn how to code a trading system that works by these strategies. Programming is a great tool that helps us to trade effectively as it helps us to execute our plan and strategy in a disciplined way without involving emotions in our trading decision in addition to the accuracy in execution but the most important thing is to test any strategy before executing it. Let us write our trading system according to the earlier discussed strategies...
First, we need to write a code for a program that provides values of stochastic lines on the chart, and through writing this code we will learn line by line what we are writing to be able after this step to understand and create the trading system.
First steps, we need to create arrays for the %K line and %D line and we will use "double" which is presenting values with a fractional part:
double Karray[];
double Darray[];
Then, we need to sort these created arrays from the current data and we will use "ArraySetAsSerious" function:
ArraySetAsSeries(Karray, true);
ArraySetAsSeries(Darray, true);
Then, we need to define the "Stochastic" indicator and we will use "iStochastic" function after creating a variable with "StochDef" to be equal to the "Stochastic" definition:
int StochDef = iStochastic(_Symbol,_Period,14,3,3,MODE_SMA,STO_LOWHIGH);
Then, we need to fill array with prices data and we will use "CopyBuffer" function:
CopyBuffer(StochDef,0,0,3,Karray);
CopyBuffer(StochDef,1,0,3,Darray);
Then, we will calculate the value of the %K line and %D line of current data and we will use "float" to decrease the size of fractions and to be approximated:
float KValue = Karray[0];
float DValue = Darray[0];
The last code line will be to let the program present the %K line value and the %D line value on the chart in two lines and we will use the "Comment" function:
Comment("%K value is ", KValue,"\n""%D Value is ",DValue);
And the following is the same as the previous code but in one block to be able to copy it in one step if you need that:
//+------------------------------------------------------------------+
//|                       Simple Stochastic System - Lines Value.mq5 |
//|                                  Copyright 2022, MetaQuotes Ltd. |
//|                                             https://www.mql5.com |
//+------------------------------------------------------------------+
#property copyright "Copyright 2022, MetaQuotes Ltd."
#property link      "https://www.mql5.com"
#property version   "1.00"
//+------------------------------------------------------------------+
void OnTick()
  {
//creating arrays for %K line and %D line
   double Karray[];
   double Darray[];

//sorting arrays from the current data
   ArraySetAsSeries(Karray, true);
   ArraySetAsSeries(Darray, true);

//defining the stochastic indicator
   int StochDef = iStochastic(_Symbol,_Period,14,3,3,MODE_SMA,STO_LOWHIGH);

//filling arrays with price data
   CopyBuffer(StochDef,0,0,3,Karray);
   CopyBuffer(StochDef,1,0,3,Darray);

//calculating value of %K and %D line of cuurent data
   float KValue = Karray[0];
   float DValue = Darray[0];

//commenting calcualted values on the chart
   Comment("%K value is ",KValue,"\n"
   "%D Value is ",DValue);

  }
//+------------------------------------------------------------------+
So far, we wrote code of a program that can present current values of stochastic indicator lines on the chart and now we need to execute this program on our trading terminal which is Meta Trader5 as we can find it now existing in the navigator window after compiling:
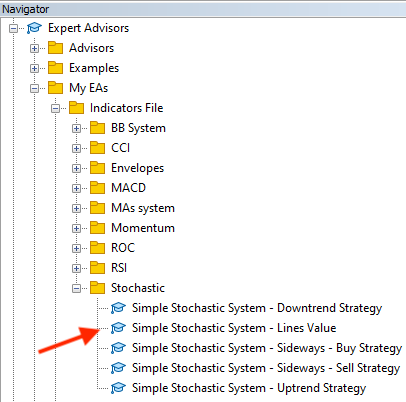
After dragging and dropping the file of Simple Stochastic System - Lines Value, the following window will open:
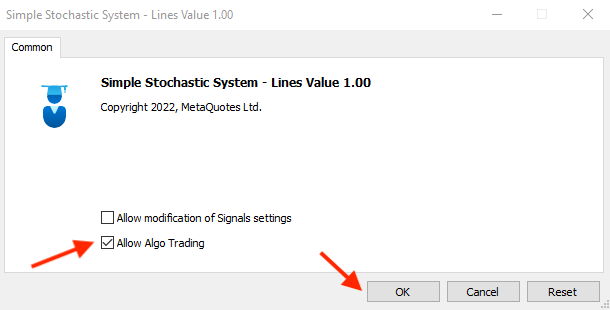
After pressing OK, the program or the (Expert Advisor) will be attached to the chart the same as the below picture:
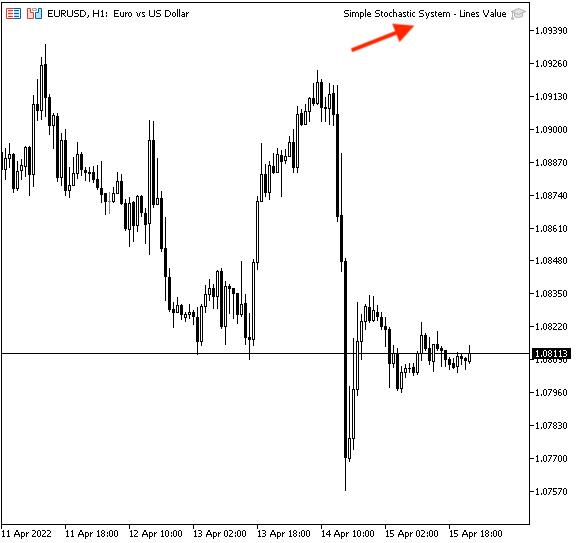
Then, we can see that the program generates values of stochastic lines the same as in the below picture:
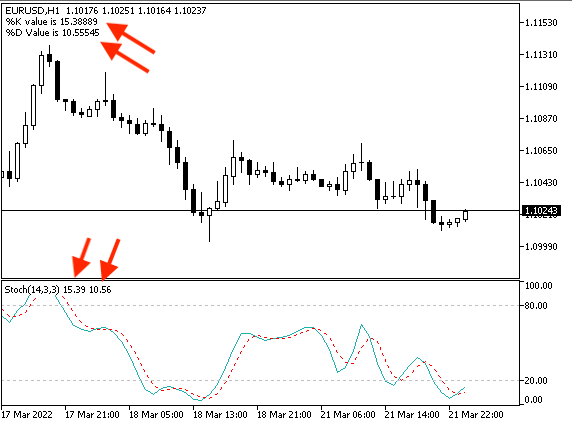
Now, we will start to write the code to create a trading system for our strategies, and what we need to do here is to create a trading system that is able to present the suitable signal as a comment on the chart according to the used strategy. Let us start to do that...
- Strategy one: uptrend strategy
%K, %D < 50 --> %K > %D = buy signal
The following code is for creating a trading system to execute what we need according to this uptrend strategy:
//+------------------------------------------------------------------+
//|                  Simple Stochastic System - Uptrend Strategy.mq5 |
//|                                  Copyright 2022, MetaQuotes Ltd. |
//|                                             https://www.mql5.com |
//+------------------------------------------------------------------+
#property copyright "Copyright 2022, MetaQuotes Ltd."
#property link      "https://www.mql5.com"
#property version   "1.00"
//+------------------------------------------------------------------+
void OnTick()
  {
   string signal="";

   double Karray[];
   double Darray[];

   ArraySetAsSeries(Karray, true);
   ArraySetAsSeries(Darray, true);

   int StochDef = iStochastic(_Symbol,_Period,14,3,3,MODE_SMA,STO_LOWHIGH);

   CopyBuffer(StochDef,0,0,3,Karray);
   CopyBuffer(StochDef,1,0,3,Darray);

   double KValue0 = Karray[0];
   double DValue0 = Darray[0];

   double KValue1 = Karray[1];
   double DValue1 = Darray[1];

   if (KValue0<50&&DValue0<50)
      if ((KValue0>DValue0) && (KValue1<DValue1))
      {
         signal = "BUY";
      }

   Comment("SSS - Uptrend Strategy - Signal is ",signal);

  }
//+------------------------------------------------------------------+
As you can see that the differences here is:
Created a variable for the "signal" with an empty assignment as we will calculate it after that:
string signal="";
Created two variables for %K values (0,1) and two variables for %D values (0,1) for current data and data before the current:
   double KValue0 = Karray[0];
   double DValue0 = Darray[0];

   double KValue1 = Karray[1];
   double DValue1 = Darray[1];
To evaluate the crossover between %K and %D as we need the crossover to up, in other words, we need %K to break %D to up to move above it after this crossover and this is what we can find in the line code of "if":
   if (KValue0<50&&DValue0<50)
      if ((KValue0>DValue0) && (KValue1<DValue1))
      {
         signal = "BUY";
      }
After evaluation of the crossover, if it is true, we need a signal for "BUY" and this will be the assignment for "signal". Then we need a comment with this signal on the chart and it will be according to the following line of code:
Comment("SSS - Uptrend Strategy - Signal is ",signal);
So for, we created the code of the program and after compiling we can find it in the navigator window:
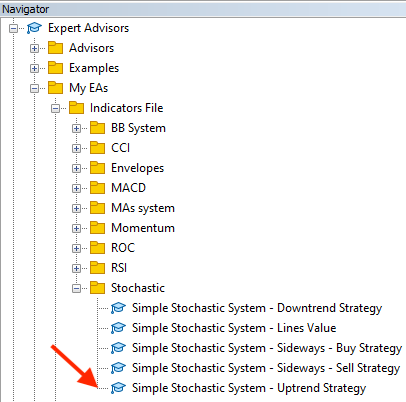
After dragging and dropping this file on the chart, the following window will appear:
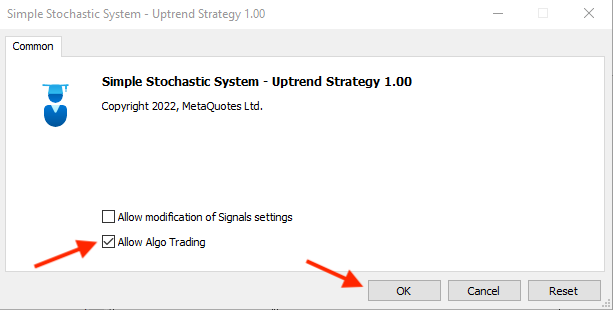
After pressing OK, it will be attached:
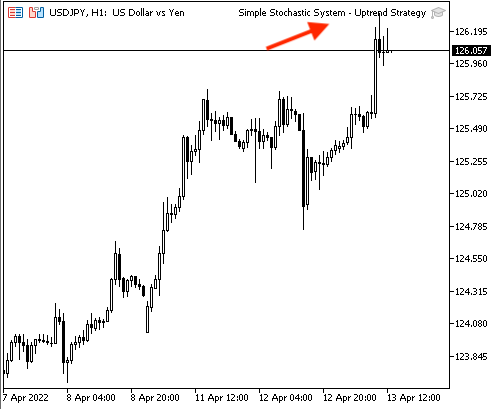
The signal will appear the same as the following example while testing:
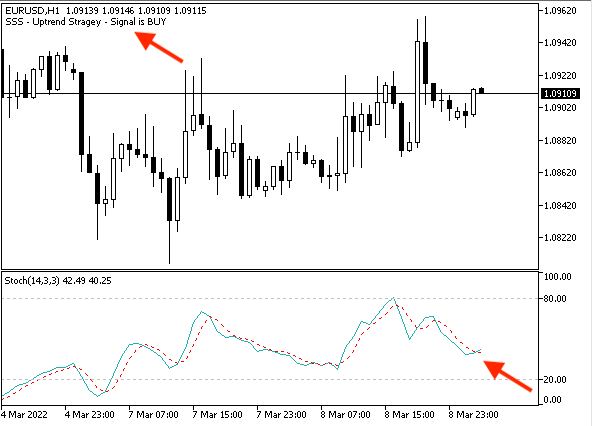
- Strategy two: downtrend strategy
%K, %D > 50 --> %K < %D = sell signal
The following is for creating a program to execute this downtrend strategy:
//+------------------------------------------------------------------+
//|                Simple Stochastic System - Downtrend Strategy.mq5 |
//|                                  Copyright 2022, MetaQuotes Ltd. |
//|                                             https://www.mql5.com |
//+------------------------------------------------------------------+
#property copyright "Copyright 2022, MetaQuotes Ltd."
#property link      "https://www.mql5.com"
#property version   "1.00"
//+------------------------------------------------------------------+
void OnTick()
  {
   string signal="";

   double Karray[];
   double Darray[];

   ArraySetAsSeries(Karray, true);
   ArraySetAsSeries(Darray, true);

   int StochDef = iStochastic(_Symbol,_Period,5,3,3,MODE_SMA,STO_LOWHIGH);

   CopyBuffer(StochDef,0,0,3,Karray);
   CopyBuffer(StochDef,1,0,3,Darray);

   double KValue0 = Karray[0];
   double DValue0 = Darray[0];

   double KValue1 = Karray[1];
   double DValue1 = Darray[1];

   if (KValue0>50&&DValue0>50)
      if ((KValue0<DValue0) && (KValue1>DValue1))
      {
         signal = "SELL";
      }

   Comment("SSS - Downtrend Strategy - Signal is ",signal);

  }
//+------------------------------------------------------------------+
The differences are:
- Conditions of the crossover
   if (KValue0>50&&DValue0>50)
      if ((KValue0<DValue0) && (KValue1>DValue1))
      {
         signal = "SELL";
      }
- The comment according to this strategy:
Comment("SSS - Downtrend Strategy - Signal is ",signal);
After compiling, we can find the file of this program in the navigator window:
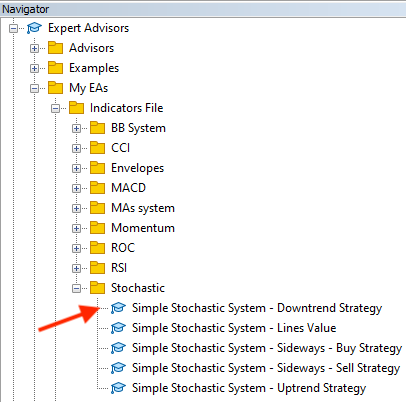
Drag and drop this file on the chart and the following window will open:
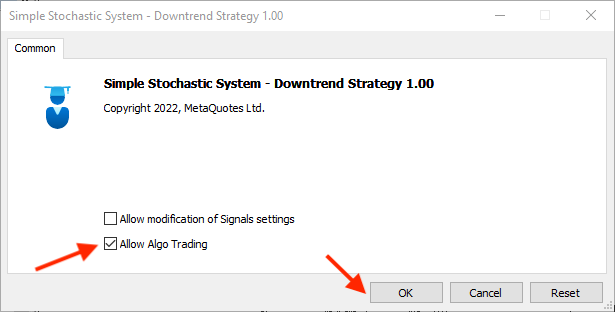
After pressing OK, the file will be attached to the chart:
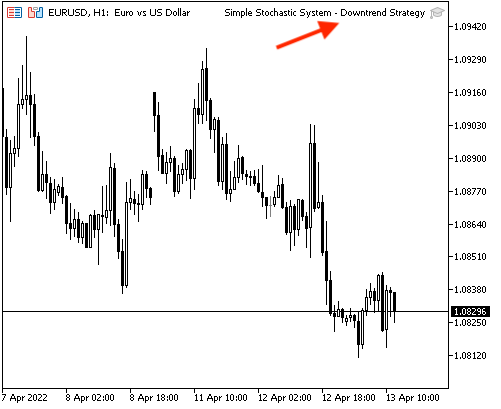
The signal will appear as a comment on the chart according to the conditions of this strategy and the following picture is an example of that:
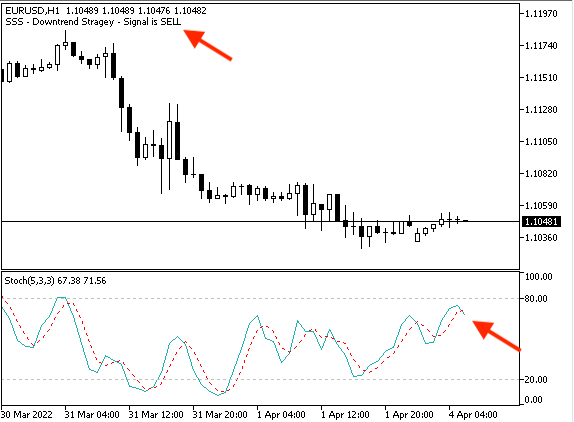
- Strategy three: sideways strategy
- Buy signal:
%K, %D < 20 --> %K > %D = buy signal
%K, %D > 80 --> %K < %D = take profit signal
The following code is for creating a program that is able to execute this sideways strategy:
//+------------------------------------------------------------------+
//|           Simple Stochastic System - Sideways - Buy Strategy.mq5 |
//|                                  Copyright 2022, MetaQuotes Ltd. |
//|                                             https://www.mql5.com |
//+------------------------------------------------------------------+
#property copyright "Copyright 2022, MetaQuotes Ltd."
#property link      "https://www.mql5.com"
#property version   "1.00"
//+------------------------------------------------------------------+
void OnTick()
  {
   string signal="";

   double Karray[];
   double Darray[];

   ArraySetAsSeries(Karray, true);
   ArraySetAsSeries(Darray, true);

   int StochDef = iStochastic(_Symbol,_Period,5,3,3,MODE_SMA,STO_LOWHIGH);

   CopyBuffer(StochDef,0,0,3,Karray);
   CopyBuffer(StochDef,1,0,3,Darray);

   double KValue0 = Karray[0];
   double DValue0 = Darray[0];

   double KValue1 = Karray[1];
   double DValue1 = Darray[1];

   if (KValue0<20&&DValue0<20)
      if ((KValue0>DValue0) && (KValue1<DValue1))
      {
         signal = "BUY";
      }

   Comment("SSS - Sideways - Buy Strategy - Signal is ",signal);

    if (KValue0>80&&DValue0>80)
      if ((KValue0<DValue0) && (KValue1>DValue1))
      {
         signal = "Take Profit";
      }

   Comment("SSS - Sideways - Buy Strategy - Signal is ",signal);

  }
//+------------------------------------------------------------------+
The differences are:
- Conditions of crossover according to the buy signal of sideways strategy:
   if (KValue0<20&&DValue0<20)
      if ((KValue0>DValue0) && (KValue1<DValue1))
      {
         signal = "BUY";
      }
- The comment according to the buy signal of sideways strategy:
Comment("SSS - Sideways - Buy Strategy - Signal is ",signal);
- Conditions of take profit signal of sideways strategy:
    if (KValue0>80&&DValue0>80)
      if ((KValue0<DValue0) && (KValue1>DValue1))
      {
         signal = "Take Profit";
      }
- The comment according to take profit signal of sideways strategy:
Comment("SSS - Sideways - Buy Strategy - Signal is ",signal);
After compiling, the file of this trading system will appear in the Navigator window:
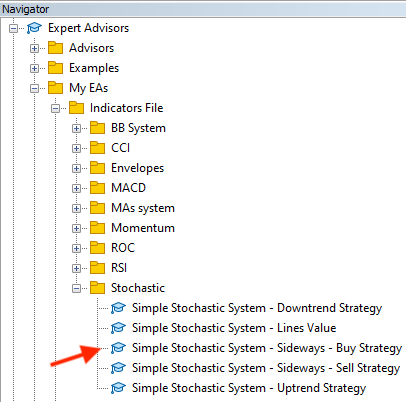
Drag and drop the file on the chart, the following window will be opened:
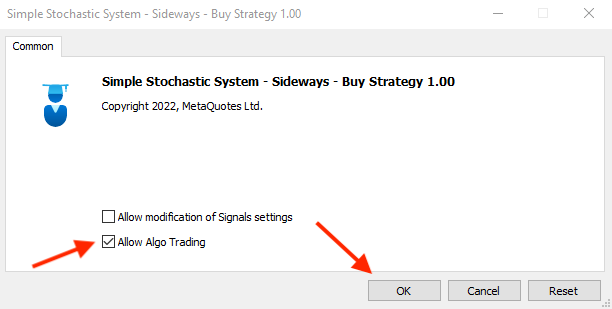
After pressing OK, the program will be attached to the chart:
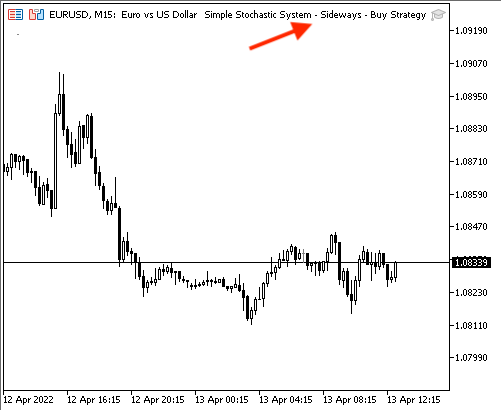
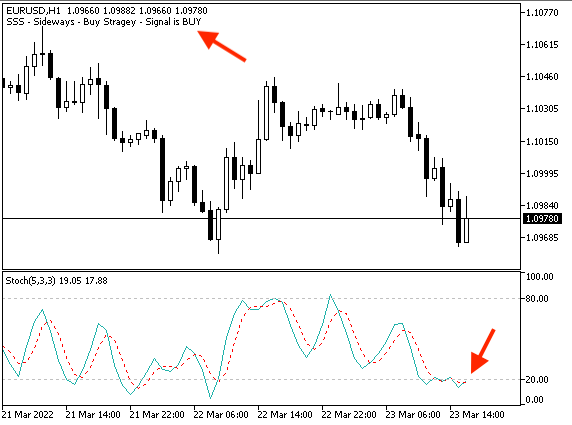
The signal will be shown as a comment on the chart according to this strategy. The following picture shows an example of such a signal:
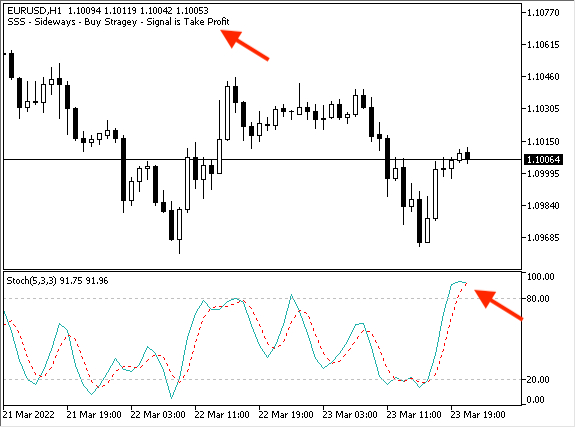
The "take profit" signal example:
- Sideways strategy: sell signal
%K, %D > 80 --> %K < %D = sell signal
%K, %D < 20 --> %K > %D = take profit signal
The following is for how to write the code of a program that is execute this strategy:
//+------------------------------------------------------------------+
//|          Simple Stochastic System - Sideways - Sell Strategy.mq5 |
//|                                  Copyright 2022, MetaQuotes Ltd. |
//|                                             https://www.mql5.com |
//+------------------------------------------------------------------+
#property copyright "Copyright 2022, MetaQuotes Ltd."
#property link      "https://www.mql5.com"
#property version   "1.00"
//+------------------------------------------------------------------+
void OnTick()
  {
   string signal="";

   double Karray[];
   double Darray[];

   ArraySetAsSeries(Karray, true);
   ArraySetAsSeries(Darray, true);

   int StochDef = iStochastic(_Symbol,_Period,5,3,3,MODE_SMA,STO_LOWHIGH);

   CopyBuffer(StochDef,0,0,3,Karray);
   CopyBuffer(StochDef,1,0,3,Darray);

   double KValue0 = Karray[0];
   double DValue0 = Darray[0];

   double KValue1 = Karray[1];
   double DValue1 = Darray[1];

    if (KValue0>80&&DValue0>80)
      if ((KValue0<DValue0) && (KValue1>DValue1))
      {
         signal = "SELL";
      }

   Comment("SSS - Sideways - Sell Strategy - Signal is ",signal);

   if (KValue0<20&&DValue0<20)
      if ((KValue0>DValue0) && (KValue1<DValue1))
      {
         signal = "TAKE PROFIT";
      }
   Comment("SSS - Sideways - Sell Strategy - Signal is ",signal);
  }
//+------------------------------------------------------------------+
The differences are:
- Conditions of crossover according to the sell signal of sideways strategy:
    if (KValue0>80&&DValue0>80)
      if ((KValue0<DValue0) && (KValue1>DValue1))
      {
         signal = "SELL";
      }
- The comment according to the sell signal of sideways strategy:
Comment("SSS - Sideways - Sell Strategy - Signal is ",signal);
- Conditions of take profit signal of sideways strategy:
   if (KValue0<20&&DValue0<20)
      if ((KValue0>DValue0) && (KValue1<DValue1))
      {
         signal = "TAKE PROFIT";
      }
- The comment according to the take profit signal of sideways strategy:
Comment("SSS - Sideways - Sell Strategy - Signal is ",signal);
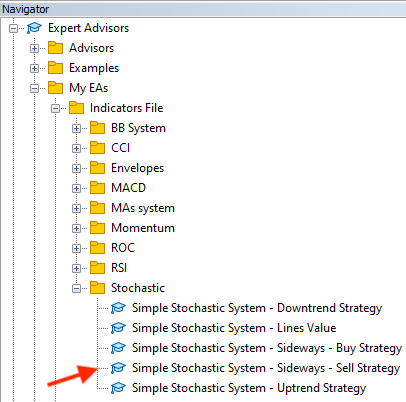
After compiling, the file of this trading system will appear in the Navigator window:
Drag and drop it on the chart and the following window will open:
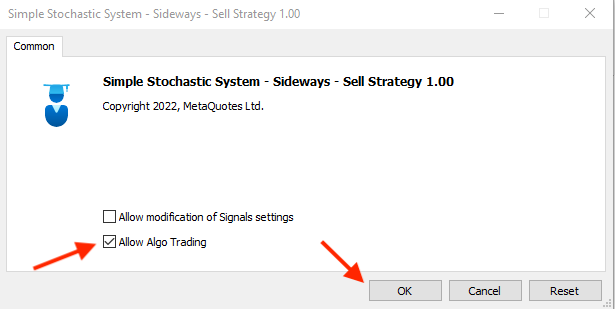
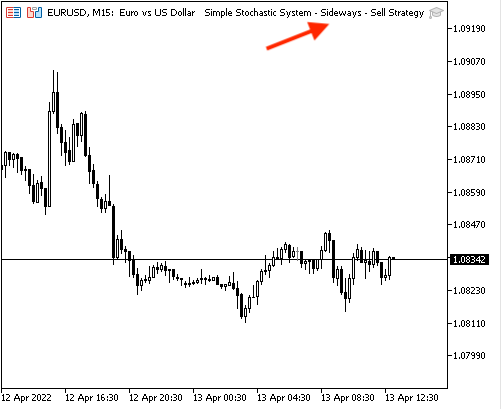
After pressing OK, the program will be attached to the chart to be ready to generate signals:
The following picture is an example of a generated sell signal according to this strategy:
The following picture is an example of a generated take profit signal according to this strategy:
Conclusion
At the end of this article, we can say that we have learnt the basics of how to create a simple trading system using the "Stochastic Oscillator" technical indicator which is one of the most popular indicators in the world of trading. I hope you have understood what the "Stochastic Oscillator" indicator is, what it measures, and how to calculate it — we have considered it in detail. I hope you have found out something new about how to use the Stochastic indicator by learning some simple strategies that can be used. Also the article presented a blueprint for these simple strategies based on which it is possible to create a trading system easily and smoothly. Also, we have considered how to design a trading system based on these mentioned simple strategies.
I hope that you found this article useful for you and your trading, and that it will assist in finding new ideas by giving you insights into one of the most popular and useful indicators — the "Stochastic Oscillator" in the world of trading.
Warning: All rights to these materials are reserved by MetaQuotes Ltd. Copying or reprinting of these materials in whole or in part is prohibited.
This article was written by a user of the site and reflects their personal views. MetaQuotes Ltd is not responsible for the accuracy of the information presented, nor for any consequences resulting from the use of the solutions, strategies or recommendations described.
 DirectX Tutorial (Part I): Drawing the first triangle
 Using the CCanvas class in MQL applications
 Learn how to design a trading system by MACD
- Free trading apps
- Over 8,000 signals for copying
- Economic news for exploring financial markets
You agree to website policy and terms of use
I'd like to know if I don't have a visa card, how can I make the withdrawal after I've won?
thank u for sharing strategy. It's really good. Can i have a question ? In your article. You use stoch 14 3 3 for Uptrend Strategy. But Downtrend Strategy and sideway buy sell signal is stoch 5 3 3. Is that correct?
Thanks for your kind comment. it is correct.