MQL4 and MQL5 Programming Articles
Study the MQL5 language for programming trading strategies in numerous published articles mostly written by you - the community members. The articles are grouped into categories to help you quicker find answers to any questions related to programming: Integration, Tester, Trading Strategies, etc.
Follow our new publications and discuss them on the Forum!
Add a new article

You are missing trading opportunities:
- Free trading apps
- Over 8,000 signals for copying
- Economic news for exploring financial markets
Registration
Log in
You agree to website policy and terms of use
If you do not have an account, please register


Expert Advisors Based on Popular Trading Systems and Alchemy of Trading Robot Optimization (Part V)
In this article the author offers ways to improve trading systems described in his previous articles. The article will be interesting for traders that already have some experience of writing Expert Advisors.
MQL5 Trading Tools (Part 10): Building a Strategy Tracker System with Visual Levels and Success Metrics
In this article, we develop an MQL5 strategy tracker system that detects moving average crossover signals filtered by a long-term MA, simulates or executes trades with configurable TP levels and SL in points, and monitors outcomes like TP/SL hits for performance analysis.

ALGLIB library optimization methods (Part II)
In this article, we will continue to study the remaining optimization methods from the ALGLIB library, paying special attention to their testing on complex multidimensional functions. This will allow us not only to evaluate the efficiency of each algorithm, but also to identify their strengths and weaknesses in different conditions.

Developing a Replay System (Part 38): Paving the Path (II)
Many people who consider themselves MQL5 programmers do not have the basic knowledge that I will outline in this article. Many people consider MQL5 to be a limited tool, but the actual reason is that they do not have the required knowledge. So, if you don't know something, don't be ashamed of it. It's better to feel ashamed for not asking. Simply forcing MetaTrader 5 to disable indicator duplication in no way ensures two-way communication between the indicator and the Expert Advisor. We are still very far from this, but the fact that the indicator is not duplicated on the chart gives us some confidence.

Price Action Analysis Toolkit Development (Part 24): Price Action Quantification Analysis Tool
Candlestick patterns offer valuable insights into potential market moves. Some single candles signal continuation of the current trend, while others foreshadow reversals, depending on their position within the price action. This article introduces an EA that automatically identifies four key candlestick formations. Explore the following sections to learn how this tool can enhance your price-action analysis.

DoEasy. Controls (Part 20): SplitContainer WinForms object
In the current article, I will start developing the SplitContainer control from the MS Visual Studio toolkit. This control consists of two panels separated by a vertical or horizontal movable separator.

Forex spread trading using seasonality
The article examines the possibilities of generating and providing reporting data on the use of the seasonality factor when trading spreads on Forex.

Measuring Indicator Information
Machine learning has become a popular method for strategy development. Whilst there has been more emphasis on maximizing profitability and prediction accuracy , the importance of processing the data used to build predictive models has not received a lot of attention. In this article we consider using the concept of entropy to evaluate the appropriateness of indicators to be used in predictive model building as documented in the book Testing and Tuning Market Trading Systems by Timothy Masters.

Creating an MQL5-Telegram Integrated Expert Advisor (Part 6): Adding Responsive Inline Buttons
In this article, we integrate interactive inline buttons into an MQL5 Expert Advisor, allowing real-time control via Telegram. Each button press triggers specific actions and sends responses back to the user. We also modularize functions for handling Telegram messages and callback queries efficiently.

Neural Networks in Trading: A Multimodal, Tool-Augmented Agent for Financial Markets (FinAgent)
We invite you to explore FinAgent, a multimodal financial trading agent framework designed to analyze various types of data reflecting market dynamics and historical trading patterns.

MQL5 Wizard Techniques you should know (Part 83): Using Patterns of Stochastic Oscillator and the FrAMA — Behavioral Archetypes
The Stochastic Oscillator and the Fractal Adaptive Moving Average are another indicator pairing that could be used for their ability to compliment each other within an MQL5 Expert Advisor. We look at the Stochastic for its ability to pinpoint momentum shifts, while the FrAMA is used to provide confirmation of the prevailing trends. In exploring this indicator pairing, as always, we use the MQL5 wizard to build and test out their potential.

Build Self Optimizing Expert Advisors in MQL5 (Part 8): Multiple Strategy Analysis
How best can we combine multiple strategies to create a powerful ensemble strategy? Join us in this discussion as we look to fit together three different strategies into our trading application. Traders often employ specialized strategies for opening and closing positions, and we want to know if our machines can perform this task better. For our opening discussion, we will get familiar with the faculties of the strategy tester and the principles of OOP we will need for this task.

Population optimization algorithms: Invasive Weed Optimization (IWO)
The amazing ability of weeds to survive in a wide variety of conditions has become the idea for a powerful optimization algorithm. IWO is one of the best algorithms among the previously reviewed ones.

Developing a robot in Python and MQL5 (Part 2): Model selection, creation and training, Python custom tester
We continue the series of articles on developing a trading robot in Python and MQL5. Today we will solve the problem of selecting and training a model, testing it, implementing cross-validation, grid search, as well as the problem of model ensemble.

Portfolio Risk Model using Kelly Criterion and Monte Carlo Simulation
For decades, traders have been using the Kelly Criterion formula to determine the optimal proportion of capital to allocate to an investment or bet to maximize long-term growth while minimizing the risk of ruin. However, blindly following Kelly Criterion using the result of a single backtest is often dangerous for individual traders, as in live trading, trading edge diminishes over time, and past performance is no predictor of future result. In this article, I will present a realistic approach to applying the Kelly Criterion for one or more EA's risk allocation in MetaTrader 5, incorporating Monte Carlo simulation results from Python.

Black-Scholes Greeks: Gamma and Delta
Gamma and Delta measure how an option’s value reacts to changes in the underlying asset’s price. Delta represents the rate of change of the option’s price relative to the underlying, while Gamma measures how Delta itself changes as price moves. Together, they describe an option’s directional sensitivity and convexity—critical for dynamic hedging and volatility-based trading strategies.

SP500 Trading Strategy in MQL5 For Beginners
Discover how to leverage MQL5 to forecast the S&P 500 with precision, blending in classical technical analysis for added stability and combining algorithms with time-tested principles for robust market insights.

From Novice to Expert: Predictive Price Pathways
Fibonacci levels provide a practical framework that markets often respect, highlighting price zones where reactions are more likely. In this article, we build an expert advisor that applies Fibonacci retracement logic to anticipate likely future moves and trade retracements with pending orders. Explore the full workflow—from swing detection to level plotting, risk controls, and execution.
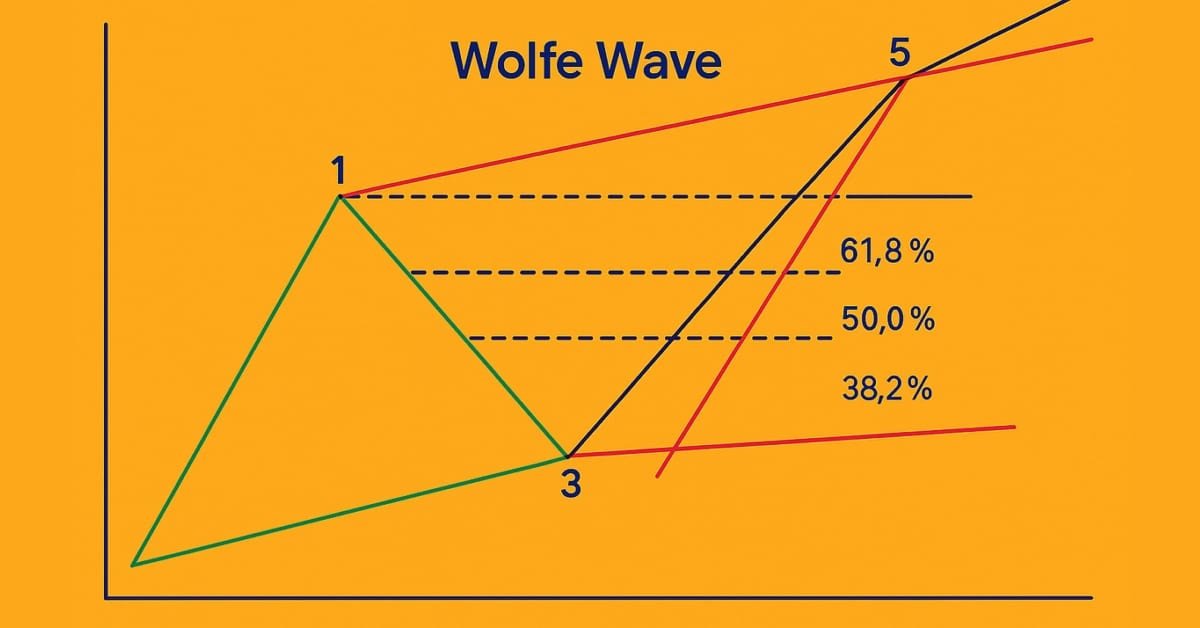
Introduction to MQL5 (Part 18): Introduction to Wolfe Wave Pattern
This article explains the Wolfe Wave pattern in detail, covering both the bearish and bullish variations. It also breaks down the step-by-step logic used to identify valid buy and sell setups based on this advanced chart pattern.

Automating Trading Strategies in MQL5 (Part 33): Creating a Price Action Shark Harmonic Pattern System
In this article, we develop a Shark pattern system in MQL5 that identifies bullish and bearish Shark harmonic patterns using pivot points and Fibonacci ratios, executing trades with customizable entry, stop-loss, and take-profit levels based on user-selected options. We enhance trader insight with visual feedback through chart objects like triangles, trendlines, and labels to clearly display the X-A-B-C-D pattern structure

Metalanguage of Graphical Lines-Requests. Trading and Qualified Trading Learning
The article describes a simple, accessible language of graphical trading requests compatible with traditional technical analysis. The attached Gterminal is a half-automated Expert Advisor using in trading results of graphical analysis. Better used for self-education and training of beginning traders.

The MQL5 Standard Library Explorer (Part 9): Using ALGLIB to Filter Excessive MA Crossover Signals
During sideways price movements, traders face excessive signals from multiple moving average crossovers. Today, we discuss how ALGLIB preprocesses raw price data to produce filtered crossover layers, which can also generate alerts when they occur. Join this discussion to learn how a mathematical library can be leveraged in MQL5 programs.

Fast trading strategy tester in Python using Numba
The article implements a fast strategy tester for machine learning models using Numba. It is 50 times faster than the pure Python strategy tester. The author recommends using this library to speed up mathematical calculations, especially the ones involving loops.

Triangular arbitrage with predictions
This article simplifies triangular arbitrage, showing you how to use predictions and specialized software to trade currencies smarter, even if you're new to the market. Ready to trade with expertise?

Price Action Analysis Toolkit Development (Part 64): Synchronizing Manually Drawn Trendlines with Automated Monitoring
Monitoring manually drawn trendlines requires constant chart observation, which can cause important price interactions to be missed. This article develops a trendline monitoring Expert Advisor that synchronizes manually drawn trendlines with automated monitoring logic in MQL5, generating alerts when price approaches, touches, or breaks a monitored line.

Neural networks made easy (Part 18): Association rules
As a continuation of this series of articles, let's consider another type of problems within unsupervised learning methods: mining association rules. This problem type was first used in retail, namely supermarkets, to analyze market baskets. In this article, we will talk about the applicability of such algorithms in trading.

Population optimization algorithms: Monkey algorithm (MA)
In this article, I will consider the Monkey Algorithm (MA) optimization algorithm. The ability of these animals to overcome difficult obstacles and get to the most inaccessible tree tops formed the basis of the idea of the MA algorithm.

Developing a Replay System — Market simulation (Part 04): adjusting the settings (II)
Let's continue creating the system and controls. Without the ability to control the service, it is difficult to move forward and improve the system.

Price Action Analysis Toolkit Development (Part 5): Volatility Navigator EA
Determining market direction can be straightforward, but knowing when to enter can be challenging. As part of the series titled "Price Action Analysis Toolkit Development", I am excited to introduce another tool that provides entry points, take profit levels, and stop loss placements. To achieve this, we have utilized the MQL5 programming language. Let’s delve into each step in this article.

Adaptive Malaysian Engulfing Indicator (Part 1): Pattern Detection and Retest Validation
Implement the Malaysian Engulfing concept in MQL5 with two coordinated indicators. One applies strict, body‑based engulfing rules for precise pattern detection; the other uses a state-driven model to monitor what follows—pullbacks and timed retests—directly on the chart. The result is a repeatable, rule-based workflow that replaces visual guesswork with programmable logic.
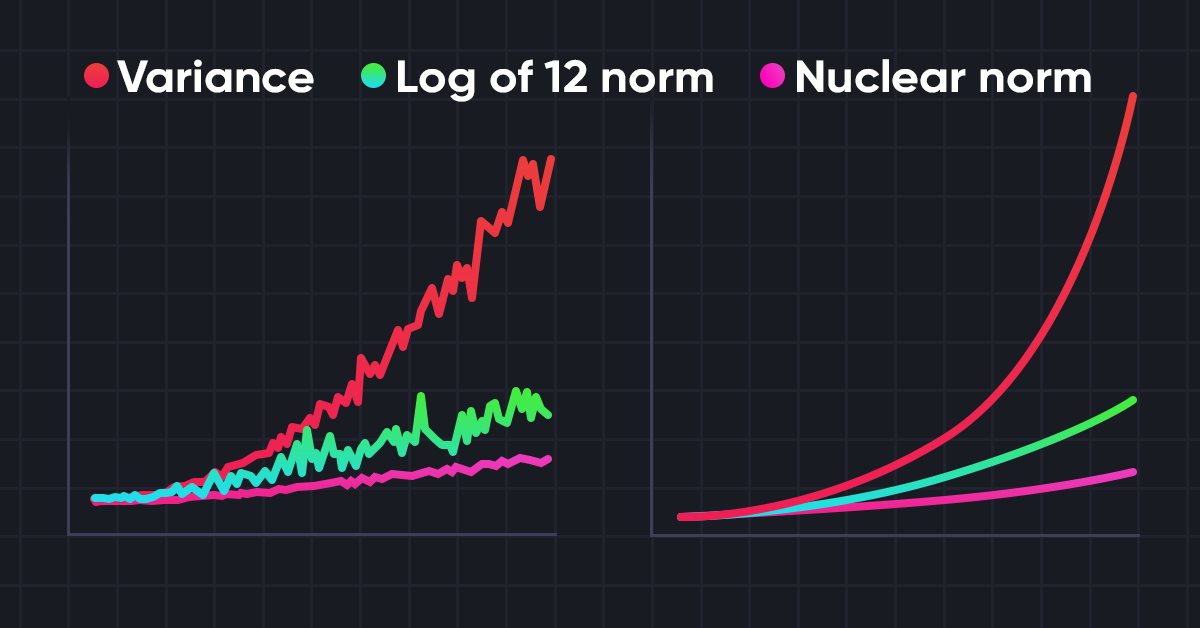
Neural networks made easy (Part 56): Using nuclear norm to drive research
The study of the environment in reinforcement learning is a pressing problem. We have already looked at some approaches previously. In this article, we will have a look at yet another method based on maximizing the nuclear norm. It allows agents to identify environmental states with a high degree of novelty and diversity.

Creating an Interactive Graphical User Interface in MQL5 (Part 2): Adding Controls and Responsiveness
Enhancing the MQL5 GUI panel with dynamic features can significantly improve the trading experience for users. By incorporating interactive elements, hover effects, and real-time data updates, the panel becomes a powerful tool for modern traders.

Neural Networks in Trading: Integrating Chaos Theory into Time Series Forecasting (Attraos)
The Attraos framework integrates chaos theory into long-term time series forecasting, treating them as projections of multidimensional chaotic dynamic systems. Exploiting attractor invariance, the model uses phase space reconstruction and dynamic multi-resolution memory to preserve historical structures.
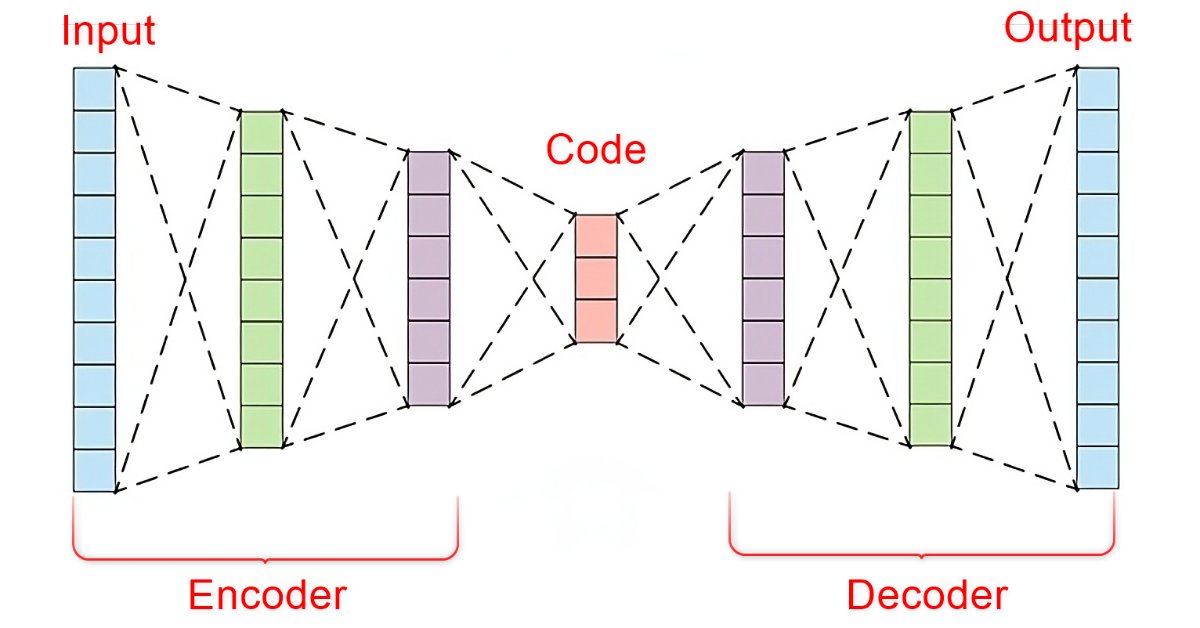
Data Science and Machine Learning (Part 22): Leveraging Autoencoders Neural Networks for Smarter Trades by Moving from Noise to Signal
In the fast-paced world of financial markets, separating meaningful signals from the noise is crucial for successful trading. By employing sophisticated neural network architectures, autoencoders excel at uncovering hidden patterns within market data, transforming noisy input into actionable insights. In this article, we explore how autoencoders are revolutionizing trading practices, offering traders a powerful tool to enhance decision-making and gain a competitive edge in today's dynamic markets.

Price Action Analysis Toolkit Development (Part 15): Introducing Quarters Theory (I) — Quarters Drawer Script
Points of support and resistance are critical levels that signal potential trend reversals and continuations. Although identifying these levels can be challenging, once you pinpoint them, you’re well-prepared to navigate the market. For further assistance, check out the Quarters Drawer tool featured in this article, it will help you identify both primary and minor support and resistance levels.

Price Action Analysis Toolkit Development (Part 65): Building an MQL5 System to Monitor and Analyze Manually Drawn Fibonacci Levels
The Fibonacci retracement tool is an essential component of price action analysis, providing critical levels for potential market reactions. However, its effectiveness is often limited by the need for continuous human monitoring, which can lead to missed setups. In this part of our series, we introduce a tool that synchronizes and actively monitors manually drawn Fibonacci levels using MQL5, combining discretionary insight with automated oversight.

Price Action Analysis Toolkit Development (Part 12): External Flow (III) TrendMap
The flow of the market is determined by the forces between bulls and bears. There are specific levels that the market respects due to the forces acting on them. Fibonacci and VWAP levels are especially powerful in influencing market behavior. Join me in this article as we explore a strategy based on VWAP and Fibonacci levels for signal generation.
DoEasy. Controls (Part 32): Horizontal ScrollBar, mouse wheel scrolling
In the article, we will complete the development of the horizontal scrollbar object functionality. We will also make it possible to scroll the contents of the container by moving the scrollbar slider and rotating the mouse wheel, as well as make additions to the library, taking into account the new order execution policy and new runtime error codes in MQL5.

MQL5 Wizard Techniques you should know (Part 42): ADX Oscillator
The ADX is another relatively popular technical indicator used by some traders to gauge the strength of a prevalent trend. Acting as a combination of two other indicators, it presents as an oscillator whose patterns we explore in this article with the help of MQL5 wizard assembly and its support classes.

Creating Custom Indicators in MQL5 (Part 2): Building a Gauge-Style RSI Display with Canvas and Needle Mechanics
In this article, we develop a gauge-style RSI indicator in MQL5 that visualizes Relative Strength Index values on a circular scale with a dynamic needle, color-coded ranges for overbought and oversold levels, and customizable legends. We utilize the Canvas class to draw elements like arcs, ticks, and pies, ensuring smooth updates on new RSI data.