
Build Self Optimizing Expert Advisors in MQL5 (Part 2): USDJPY Scalping Strategy

In our last discussion on building Self Optimizing Expert Advisors in MQL5, we built a linear regression model to create entry and exit signals for our trading application, a link to the previous article can be found, here. In retrospect, we may not need all the moving parts available in a machine learning model. Rather, we can observe machine learning models as an example of how to solve real-world problems using dynamic rules. We can then use the same simple principles of thought and logic to potentially guide our trading applications to higher levels of profitability without necessarily creating a behemoth code base to maintain.
For our discussion today, we aim to trade the USDJPY pair profitably on the Daily Time-frame. Our trading strategy will be based on candle stick patterns. In particular, we will be trading reversal patterns created by engulfing candles. Our rules for a bullish engulfing candle will be satisfied if our Open price is lower than the previous Day Close and the Close price is greater than the previous day Open. An example is depicted in Fig 1 below. These candle stick patterns are believed to show that a certain price level was rejected with considerable strength.
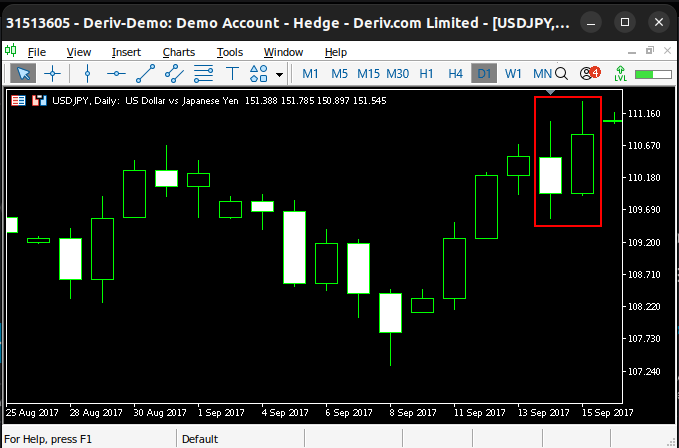
Fig 1: We have identified an example of our bullish candlestick pattern
Traders believe that engulfing candle stick patterns are a sign that a new trend is forming in the market. If they are identified correctly, they are usually followed by consistent price action in the direction of the new trend, see Fig 2 below. This creates the basis for the trading strategy, trying to identify the trading pattern correctly. Bearish engulfing candles can be used to identify the beginning of downtrends, we use the same rules we have just described, but in the opposite manner.
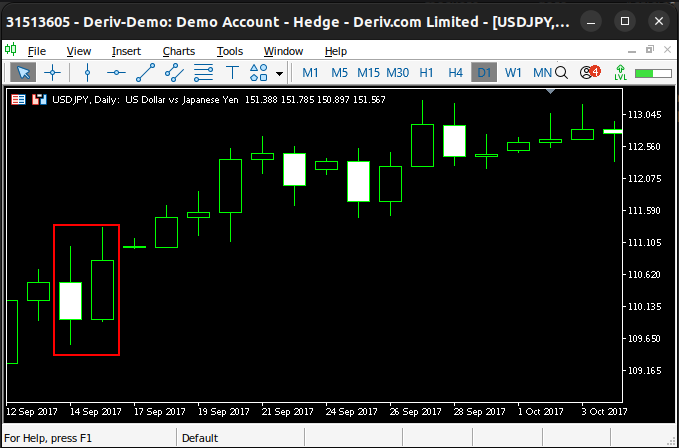
Fig 2: Our candle stick pattern was reliable in this particular example
Normally, these strategies are believed to hold true across all time frames. However, I believe that the daily time frame may be the most reliable and have selected it as our time frame of choice for this exercise. Let us try to implement a strategy to trade entry signals generated by our understanding of these particular market patterns. We will also be interested to see if we can increase our profitability by making adjustments to the original strategy.
Getting Started in MQL5
Our program will have 6 main parts that we will need to achieve our goal of profitably trading candlestick patterns.
| Part | Purpose |
|---|---|
| Initialization | This part of our system will be responsible for loading and setting global variables. |
| DeInitialization | Free up resources our application is no longer using, to ensure stable end user experience. |
| OnTick | Update system variables and scan the current chart for our candle stick patterns. |
| Custom Functions | Perform specialized jobs needed to accomplish our goal. |
| System Constants | Constants that aren’t intended to be changed by the end user. |
| Global Variables | Keep track of the last order type we placed, current market prices being offered and volatility levels. Variables like “trade” and ‘bid” were created for this. The Average True Range will help place stop losses and take profits for our positions. |
Initially, our strategy will only place trades once our candle stick pattern is found. If the pattern is identified, and we have no open positions, we will take the signal and use the ATR to then set and adjust our stop loss. Otherwise, our system will manage any trades we have opened. Therefore, our system's global variables will be:
| Variable | Description |
|---|---|
| trade | Meant to inform us the type of position we have currently open, this will make it easier for us to update our stops and any other tasks we may think of in the future. |
| atr_handler | Important for updating our stop losses consistently. |
| bid, ask | Keeping track of market prices. |
To get started, we will first build a benchmark version of our trading strategy. Let us begin by defining system constants. These constants will be created using the #define directive. The #define directive instructs the pre-processor embedded into our MQL5 editor to replace any occurrence of the macro identifier we have specified, and put in its place what we have assigned to the right of the macro identifier.
The first system constant we have defined is "SYMBOL". When we compile our application, the pre-processor will replace all instances of "SYMBOL" in our code with the value "USDJPY". This simple feature gives us complete and predictable control over the system, and guarantees us consistency across our tests, these are attributes we find attractive.
//+------------------------------------------------------------------+
//|                                      Dynamic Stops Benchmark.mq5 |
//|                                        Gamuchirai Zororo Ndawana |
//|                          https://www.mql5.com/en/gamuchiraindawa |
//+------------------------------------------------------------------+
#property copyright "Gamuchirai Zororo Ndawana"
#property link      "https://www.mql5.com/en/gamuchiraindawa"
#property version   "1.00"
//+------------------------------------------------------------------+
//| This trading application is intended to serve as our benchmark.  |
//| Our goal is to learn what it will take to surpass the benchmark. |
//+------------------------------------------------------------------+

//+------------------------------------------------------------------+
//| System constants                                                 |
//+------------------------------------------------------------------+
#define SYMBOL          "USDJPY"    //--- System pair
#define DAILY           PERIOD_D1   //--- Daily  time frame
#define VOL             0.1         //--- Trading volume
#define ATR_PERIOD      14          //--- Technical Indicator ATR Period
#define ATR_MULTIPLE    2           //--- Stop loss ATR multiple
We will also need to load the trade library.
//+------------------------------------------------------------------+
//| Libraries                                                        |
//+------------------------------------------------------------------+
#include <Trade/Trade.mqh>
CTrade Trade;
Now we shall define our global variables. These variables will help us keep track of our open position and current market quotes.
//+------------------------------------------------------------------+
//| Global variables                                                 |
//+------------------------------------------------------------------+
int    trade = 0;
int    atr_handler;
double atr[];
double bid,ask;
Upon initialization, we will call for a specialized function responsible for initializing our system variables.
//+------------------------------------------------------------------+
//| Expert initialization function                                   |
//+------------------------------------------------------------------+
int OnInit()
  {
//---
   setup();
//---
   return(INIT_SUCCEEDED);
  }
If we are no longer using our trading application, then we will release the technical indicators we are no longer using.
//+------------------------------------------------------------------+
//| Expert deinitialization function                                 |
//+------------------------------------------------------------------+
void OnDeinit(const int reason)
  {
//--- Release the indicator
   release();
  }
We will update our system variables once at the end of the day. This may be changed to your liking for better risk management. I am opting to only update system variables once a day so that the back tests are completed in a timely fashion, making it easier for us to compare the changes we are making.
//+------------------------------------------------------------------+
//| Expert tick function                                             |
//+------------------------------------------------------------------+
void OnTick()
  {
//---
   update();
  }
//+------------------------------------------------------------------+
The first customized function we will build will be responsible for releasing system resources we aren't consuming anymore.
//+------------------------------------------------------------------+
//| Custom Functions                                                 |
//+------------------------------------------------------------------+

//+------------------------------------------------------------------+
//| Release variables we don't need                                  |
//+------------------------------------------------------------------+
void release(void)
  {
   IndicatorRelease(atr_handler);
  }
Update our system variables once a day.
//+------------------------------------------------------------------+
//| Update system                                                    |
//+------------------------------------------------------------------+
void update(void)
  {
   static datetime daily_timestamp;
   datetime daily_time = iTime(SYMBOL,DAILY,0);
   if(daily_timestamp != daily_time)
     {
      //--- Update the time
      daily_timestamp = daily_time;
      //--- Update system variables
      daily_update();
      //--- Do we have an oppurtunity to trade?
      if((PositionsTotal() == 0))
         find_setup();
      //--- Do we have positions to manage?
      if(PositionsTotal() > 0)
         manage_setup();
     }
  }
Manage our trades by only updating the stop loss and take profit if the new position of the stop loss or take profit will be more profitable.
//+------------------------------------------------------------------+
//| Manage our trades                                                |
//+------------------------------------------------------------------+
void manage_setup(void)
  {
//--- Select the position
   if(PositionSelect(SYMBOL))
     {
      //--- Get ready to update the SL/TP
      double initial_sl  = PositionGetDouble(POSITION_SL);
      double initial_tp  = PositionGetDouble(POSITION_TP);
      double buy_sl      = (ask - (ATR_MULTIPLE * atr[0]));
      double sell_sl     = (bid + (ATR_MULTIPLE * atr[0]));
      double buy_tp      = (ask + (ATR_MULTIPLE * atr[0]));
      double sell_tp     = (bid - (ATR_MULTIPLE * atr[0]));
      double new_sl      = ((trade == 1) && (initial_sl <  buy_sl))? (buy_sl) : ((trade == -1) && (initial_sl > sell_sl)) ? (sell_sl) : (initial_sl);
      double new_tp      = ((trade == 1) && (initial_tp <  buy_tp))? (buy_tp) : ((trade == -1) && (initial_tp > sell_tp)) ? (sell_tp) : (initial_tp);
      //--- Update the position
      Trade.PositionModify(SYMBOL,new_sl,new_tp);
     }
  }
Setup technical indicators. So far, we only have 1 technical indicator to manage.
//+------------------------------------------------------------------+
//| Get our technical indicators ready                               |
//+------------------------------------------------------------------+
void setup(void)
  {
   atr_handler         = iATR(SYMBOL,DAILY,ATR_PERIOD);
  }
Update the system state.
//+------------------------------------------------------------------+
//| Daily update routine                                             |
//+------------------------------------------------------------------+
void daily_update(void)
  {
//--- Get current prices
   ask = SymbolInfoDouble(SYMBOL,SYMBOL_ASK);
   bid = SymbolInfoDouble(SYMBOL,SYMBOL_BID);
//--- Update Technical Indicators
   CopyBuffer(atr_handler,0,0,1,atr);
//--- Check for engulfing candles.
   int candles_state = check_candles();
//--- Give feedback
   Comment("Candle State: ",candles_state);
  }
Check for our candlestick pattern. If the pattern is found, we will return either 1 or -1 and place a long or short trade. Otherwise, we will wait.
//+------------------------------------------------------------------+
//| Check if we have any engulfing candles                           |
//+------------------------------------------------------------------+
int check_candles(void)
  {
//--- Return 1 if we have a bullish engulfing candle
   if((iOpen(SYMBOL,DAILY,0) < iClose(SYMBOL,DAILY,1)) && (iClose(SYMBOL,DAILY,0) > iOpen(SYMBOL,DAILY,1)))
      return(1);

//--- Return -1 if we have a bearish engulfing candle
   if((iOpen(SYMBOL,DAILY,0) > iClose(SYMBOL,DAILY,1)) && (iClose(SYMBOL,DAILY,0) < iOpen(SYMBOL,DAILY,1)))
      return(-1);

//--- Otherwise return 0
   return(0);
  }
Our system will know it has found a trade setup if the candle state is not 0. Otherwise, there is nothing more that needs to be done for now.
//+------------------------------------------------------------------+
//| Find setup                                                       |
//+------------------------------------------------------------------+
void find_setup(void)
  {
//--- Our sentiment is bullish
   int candles_state = check_candles();
   if(candles_state == 1)
     {
      Trade.Buy(VOL,SYMBOL,ask,(ask - (ATR_MULTIPLE * atr[0])),(ask + (ATR_MULTIPLE * atr[0])),"");
      trade = 1;
     }

//--- Our sentiment is bearish
   if(candles_state == -1)
     {
      Trade.Sell(VOL,SYMBOL,bid,(bid + (ATR_MULTIPLE * atr[0])),(bid - (ATR_MULTIPLE * atr[0])),"");
      trade = -1;
     }
  }
//+------------------------------------------------------------------+
Fig 3 below allows us to see what our system looks like. Our system keeps track of the presence or absence of our candlestick pattern and places trades if the pattern is located. Under our current setup, the stop loss and take profit positions will be moved once a day, at the end of the day.

Fig 3: Visualizing our trading strategy on the USDJPY daily time frame
We will test our new strategy over 4 years of historical data, from the 1st of January 2020 until the end of November 2024. If you'd like to follow along, and wish to make any changes to these settings, be sure to also make the appropriate changes in the system variables. Otherwise, our system will continue to trade the USDJPY on the daily time frame, regardless of which symbols and time frame we specify.

Fig 4: The primary settings for our back test
Random delay is closest to real trading scenarios, and allows us to stress test our system. Be sure to adjust the "Deposit" and the account leverage to match your intended trading setup if you are considering using the strategy in practice. 
Fig 5: Selecting the modelling type and account size for our back test
The equity curve produce by the strategy is promising. Our scalping strategy grew the account size by approximately 4% on this back test. As with any trading strategy, it went through sustained periods of loss. But what is quite remarkable about this strategy is its ability to recover from periods of loss.

Fig 6: Visualizing our trading account balance over time
Let us now take a closer look at the performance of our strategy. In its present form, our strategy had a Sharpe ratio of 1.12 and a success rate of 44.68%. What will it take to reduce the size of the average loss from $133.22 and push it closer to 0 whilst minimizing our impact on the average profit?

Fig 7: A detailed analysis of our back test performance
Improving Our Results
Our system is profitable in its current state. Are there are any changes we can make, that will allow us to exercise more control over the losing trades? I’ll propose a few changes to the original strategy:
| Proposed Change | Intended Purpose |
|---|---|
| Additional Confirmation | By using an additional confirmation strategy side by side with our already profitable strategy, we may potentially filter out more of the unprofitable trades. |
| Add Extra Padding To The Stop Loss | We want to minimize the number of times we get stopped out of winning trades. |
| Account For Market Volatility | Each market potentially has unique volatility levels. Our trading strategy should try to consider historic volatility levels, to analyze current price levels with some level of context, like professional human traders. |
Hopefully, by implementing these changes, we will reduce our proportion of unprofitable trades. There is always a tradeoff to be made when making these decisions. Ultimately, our new strategy will occasionally miss out on profitable trades that our old strategy would’ve easily managed.
It stands to reason that, eventually, exercising no control over the size of our average loss could potentially cost us all the profit we worked to accumulate. To realize our desired changes, we will have to introduce changes to our current version of the application.
| System Change | Description |
|---|---|
| New System Variables | To account for market volatility, we have to first decide how much data from the past we should fetch. This will be handled for us by a new system variable, fittingly named “fetch”. Additionally, we will need to fix the parameters of any technical indicators we will use. |
| Technical Indicators | We can obtain additional confirmation by using technical indicator trading strategies. Today, we will employ a moving average channel strategy. Therefore, we will create new indicator handlers and buffers to store this new information. |
| Confluence of Signals | We will create a new global variable named “sentiment”. Its value will be 1 or -1 when both our candlestick pattern and technical indicators are either both bullish (1) or both bearish(-1). Otherwise, its value will be 0. Our system will only place trades when our sentiment value is not equal to 0. |
| Customized Functions | To attain the behavior we desire from our system, we will have to extend some of the customized functions we have already created, as well as creating a few new functions. |
Overview of The Confirmation Strategy
Our confirmation strategy will be based on moving average channel trading strategies. This strategy is created by 2 moving averages following the high and low prices respectively. The 2 moving averages create a channel. Note, the moving averages do not cross over each other. Therefore, our entry signals, are generated when a candle fully forms outside the region between the 2 moving averages.
The reasoning behind this strategy is that price levels between the high and low moving average are considered stable. Whereas, when price levels form beyond the region between the 2 moving averages, we perceive an imbalance in the market. The strategy suggests this to be the formation of a new trend in the direction of the imbalance. Fig 8 below depicts how we would use the strategy.
The red arrow represents an optimal region to have occupied a short position according to the strategy. The setup is typically considered valid, until price levels find their way back into the channel. At that point, our positions may be closed, and we will wait for the next imbalance to be detected. This second imbalance is marked by the blue arrow. Since the imbalance appeared above our moving average channel, we would have interpreted that as a signal to long.
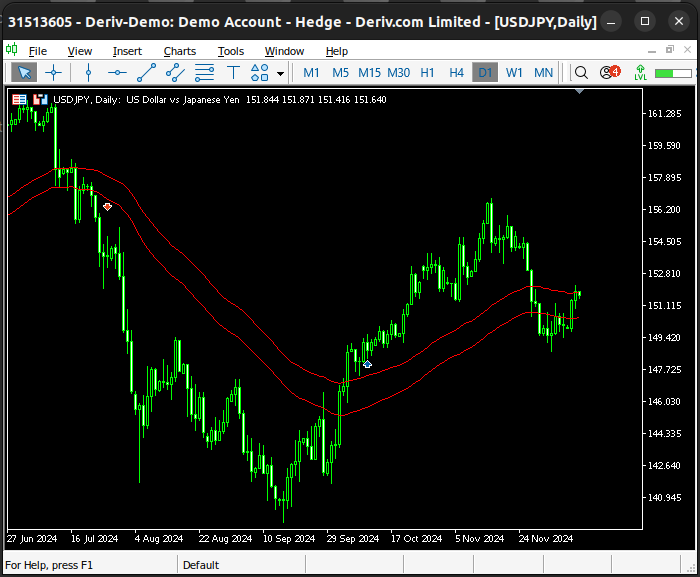
Fig 8: Our moving average channel strategy for identifying entry and exit points
We will extend the idea further, by also considering historical highs and lows experienced in the market. We will calculate the midpoint formed by the last year to date of historical high and low prices offered in the market. Furthermore, will use the information to restrict or application to only place long positions when the Close price is above the historical high-low midpoint and the opposite will be true for our short positions.
The red horizontal line in Fig 9 symbolizes the average of the high and low prices over the last year to date. This mid-point is updated every day by our system and will serve as a lens for our application to view price levels under.

Fig 9: The historical mid-point of the last year to date of high and low prices offered in the market
| Position Type | New Position Criteria |
|---|---|
| Long | An engulfing bullish candle has formed, above the moving average channel and price levels are elevated above the yearly average volatility levels. |
| Short | An engulfing bearish candle has formed, above the moving average channel and price levels are elevated above the yearly average volatility levels. |
Hopefully, by using our 2 strategies together, we may filter out the unprofitable trades that troubled our old system while still holding on to the profitable trades we want to keep. Let us get started implementing these changes to see how effective they will be. We must first define new system variables that will fix the periods of our moving average channel and the amount of data historical data we will fetch to calculate our mid-point.
//+------------------------------------------------------------------+
//|                                  USDJPY Price Action Benchmark 2 |
//|                                        Gamuchirai Zororo Ndawana |
//|                          https://www.mql5.com/en/gamuchiraindawa |
//+------------------------------------------------------------------+
#property copyright "Gamuchirai Zororo Ndawana"
#property link      "https://www.mql5.com/en/gamuchiraindawa"
#property version   "1.00"
//+------------------------------------------------------------------+
//| This trading application is intended to surpass our benchmark.   |
//+------------------------------------------------------------------+

//+------------------------------------------------------------------+
//| System constants                                                 |
//+------------------------------------------------------------------+
//--- I have intentionally omitted parts of the system that remained unchanged
#define FETCH           365            //--- How much should we fetch?
#define MA_PERIOD       90             //--- Moving average period
We will also need a few additional global variables to keep track of the market states we have defined.
//+------------------------------------------------------------------+
//| Global variables                                                 |
//+------------------------------------------------------------------+
int    sentiment = 0;
int    trade = 0;
int    ma_high_handler, ma_low_handler;
double ma_high[],ma_low[];
The body of our application will remain the same. However, some of the functions that are being called have changed.
//+------------------------------------------------------------------+
//| Expert initialization function                                   |
//+------------------------------------------------------------------+
int OnInit()
  {
//--- Setup our system varaibles
   setup();
//---
   return(INIT_SUCCEEDED);
  }
//+------------------------------------------------------------------+
//| Expert deinitialization function                                 |
//+------------------------------------------------------------------+
void OnDeinit(const int reason)
  {
//--- Release any resources
   release();
  }
//+------------------------------------------------------------------+
//| Expert tick function                                             |
//+------------------------------------------------------------------+
void OnTick()
  {
//--- Update system variables
   update();
  }
//+------------------------------------------------------------------+
Let us now review the changes made to the custom functions. The first two changes will be loading our technical indicators and releasing them afterward.
//+------------------------------------------------------------------+
//| Custom Functions                                                 |
//+------------------------------------------------------------------+

//+------------------------------------------------------------------+
//| Release our technical indicators                                 |
//+------------------------------------------------------------------+
void release(void)
  {
   IndicatorRelease(atr_handler);
   IndicatorRelease(ma_low_handler);
   IndicatorRelease(ma_high_handler);
  }
These changes to our code base go hand in hand and are simple to understand.
//+------------------------------------------------------------------+
//| Get our technical indicators ready                               |
//+------------------------------------------------------------------+
void setup(void)
  {
   atr_handler         = iATR(SYMBOL,DAILY,ATR_PERIOD);
   ma_high_handler     = iMA(SYMBOL,DAILY,MA_PERIOD,0,MODE_EMA,PRICE_HIGH);
   ma_low_handler      = iMA(SYMBOL,DAILY,MA_PERIOD,0,MODE_EMA,PRICE_LOW);
  }
Our daily update routine needs to be extended as well. We are now also interested in knowing how current price levels compare against the historical noise levels expected from this market. If our candle stick patterns and price levels give us matching sentiment, then we will seek validation from our moving average channel, if now is a good time to execute our trade.
//+------------------------------------------------------------------+
//| Daily update routine                                             |
//+------------------------------------------------------------------+
void daily_update(void)
  {
//--- Get current prices
   ask = SymbolInfoDouble(SYMBOL,SYMBOL_ASK);
   bid = SymbolInfoDouble(SYMBOL,SYMBOL_BID);
//--- Update Technical Indicators
   CopyBuffer(atr_handler,0,0,1,atr);
   CopyBuffer(ma_high_handler,0,0,1,ma_high);
   CopyBuffer(ma_low_handler,0,0,1,ma_low);
//--- Check for engulfing candles.
   int candles_state = check_candles();
//--- Compare current price levels to historical price levels in the market
   int price_state  = check_price_levels();
//--- Check our tech
//--- What is our sentiment?
//--- Our sentiment is well defined.
   if(candles_state == price_state)
      sentiment = candles_state;
//--- Wait.
   if(candles_state != price_state)
      sentiment = 0;
//--- Give feedback
   Comment("Sentiment: ",sentiment,"\nCandle State: ",candles_state,"\nPrice State: ",price_state);
  }
We will use the MQL5 vector type to calculate and keep track of our market statistics on the fly with ease.
//+------------------------------------------------------------------+
//| Check if we are closer to the all time high or low               |
//+------------------------------------------------------------------+
int check_price_levels(void)
  {
//--- Get historical prices
   vector highs = vector::Zeros(FETCH);
   vector lows  = vector::Zeros(FETCH);
   highs.CopyRates(SYMBOL,DAILY,COPY_RATES_HIGH,0,FETCH);
   lows.CopyRates(SYMBOL,DAILY,COPY_RATES_LOW,0,FETCH);

//--- First we shall calculate the mid point between the all time high and low
   vector mid = ((highs + lows) / 2);

//--- Return 1 if we are above the mid point
   if(iClose(SYMBOL,DAILY,0) > mid.Mean())
      return(1);

//--- Return -1 if we are above the mid point
   if(iClose(SYMBOL,DAILY,0) < mid.Mean())
      return(-1);

//--- Otherwise return 0
   return(0);
  }
Our new rules for finding a trade setup will consider 2 additional filters. The price level relative to the annual mid-point and the price level relative to the moving average channel. If both strategies harmonize, we will place our trade accordingly.
//+------------------------------------------------------------------+
//| Find setup                                                       |
//+------------------------------------------------------------------+
void find_setup(void)
  {
//--- Our sentiment is bullish
   if(sentiment == 1)
     {
      if((iOpen(SYMBOL,DAILY,0) > ma_high[0]) && (iClose(SYMBOL,DAILY,0) > ma_high[0]))
        {
         Trade.Buy(VOL,SYMBOL,ask,(ask - (ATR_MULTIPLE * atr[0])),(ask + (ATR_MULTIPLE * atr[0])),"");
         trade = 1;
        }
     }

//--- Our sentiment is bearish
   if(sentiment == -1)
     {
      if((iOpen(SYMBOL,DAILY,0) < ma_low[0]) && (iClose(SYMBOL,DAILY,0) < ma_low[0]))
        {
         Trade.Sell(VOL,SYMBOL,bid,(bid + (ATR_MULTIPLE * atr[0])),(bid - (ATR_MULTIPLE * atr[0])),"");
         trade = -1;
        }
     }
  }
//+------------------------------------------------------------------+
We can take a look at our strategy in action. Note that our strategy now keeps track of 3 conditions that must be met before we will commit to any position. We hope that by carefully selecting the right conditions, they will not all be satisfied by chance.

Fig 10: We are back testing our revised USDJPY scalping strategy on historical market data
As we stated earlier, settings regarding the duration and period of the back test will be kept fixed for consistency across both our tests. Therefore, our dates correspond with the dates from the previous test.

Fig 11: Our settings for the back test will be fixed in both tests
Remember to feel free to adjust these particular settings to reflect the environment you intended to use them under.

Fig 12: The second batch of settings for our back test
The equity curve produced by our new strategy has fewer periods of draw down as compared to our first back test. For example, in the period between January 2020 and approaching December 2023 the equity curve produced by our initial strategy was in one place, oscillating around the initial balance. Whilst our new equity curve does not have that undesirable characteristic. Our equity curve grew in a less volatile trend from September 2022 until the end of the back test.

Fig 13: The equity curve produce by our revised trading strategy
Upon further inspection, we observe that we achieved our goal to push the average loss and the proportion of losing trades closer towards 0. However, we only marginally reduced the proportion of loss trades, from about 55% to about 54%. Furthermore, our changes also reduced the profitability of our trading strategy. This isn't a material issue because we can correct for it by safely increasing our lot size. Marketplaces are dynamic environments, and the new safety measures we have put in place may prove invaluable in the future.

Fig 14: A detailed analysis of our second trading strategy
Conclusion
In this article, we covered the potential to be uncovered from trading the signals generated by candlestick patterns. Although there are many criticisms against such strategies, such as the fact that it is possible to observe the candle stick pattern form, but it is not always followed by the same price action afterward may cast doubts on the validity of the strategy.
However, by following the adjustments we have discussed in this strategy and by adding your own understanding of the market, I believe that any doubts on the profitability of the strategy can be reasonably laid to rest. The challenge is that it is not always obvious to us, how the changes we are making will affect the profitability of the strategy.
| File | Description |
|---|---|
| USDJPY Price Action Benchmark | This application was the initial, volatile version of our trading strategy, it was more profitable but also carried more risk. |
| USDJPY Price Action Strategy 2 | This is the refined version of the strategy that we built together, it is just as profitable, and it tries to minimize its losses. |
Warning: All rights to these materials are reserved by MetaQuotes Ltd. Copying or reprinting of these materials in whole or in part is prohibited.
This article was written by a user of the site and reflects their personal views. MetaQuotes Ltd is not responsible for the accuracy of the information presented, nor for any consequences resulting from the use of the solutions, strategies or recommendations described.

- Free trading apps
- Over 8,000 signals for copying
- Economic news for exploring financial markets
You agree to website policy and terms of use
Am I able to test the EA? I downloaded it but for some reason it is not showing up under EA. Any help is greatly appreciated. Thanks.