Introduction to MQL5 (Part 18): Introduction to Wolfe Wave Pattern

Introduction
Welcome back to Part 18 of the Introduction to MQL5 series! This part continues to build on everything we’ve explored so far, using our signature project-based approach to help you sharpen your MQL5 skills through real-world examples. In Part 17, we focused on trend line breakouts and reversal setups, showing how you can build Expert Advisors who react to key levels and trade based on price behavior aroundtrend lines.
In this article, we’ll take things a step further by exploring a more advanced chart pattern, the Wolfe Wave. Unlike basic patterns that rely heavily on simple support and resistance breaks, the Wolfe Wave involves a precise five-point structure and aims to forecast price movement toward a specific target line. It is a powerful tool for predicting reversals and timing entries with higher precision.
This part will focus on explaining the concepts behind Wolfe Wave patterns, including how to identify both bearish and bullish setups. You'll learn how to spot these patterns on the chart and understand the conditions that define a valid Wolfe Wave structure. The framework for programmatically recognizing the pattern and creating an Expert Advisor (EA) based on it is also be laid out in this section. We will apply this logic in MQL5 in the upcoming article to automatically identify Wolfe Waves and build an Expert Advisor based on the pattern.
1. Wolfe Waves Pattern
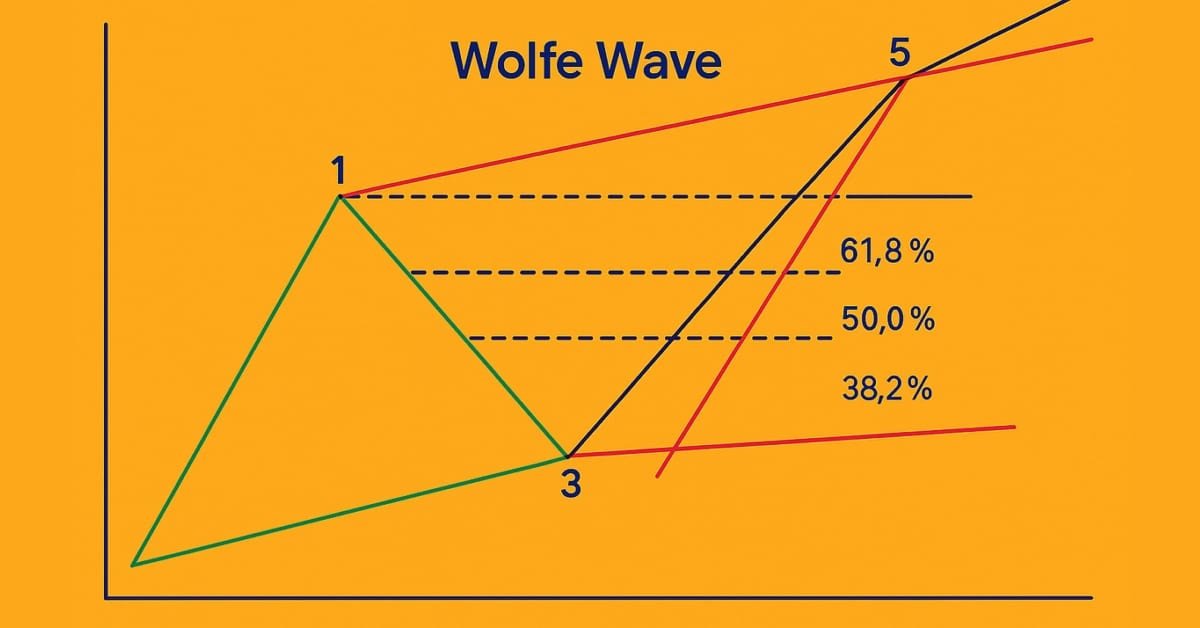
One reversal chart pattern that can be used to identify a possible shift in the market's direction is the Wolfe Wave. Price movement is made up of five different waves. To draw the five points, this pattern depends on locating important swing highs and lows. Following the establishment of these five points, the pattern indicates that the price will turn around at the fifth point and proceed in the direction of a target line that is expected to be drawn from points 1 through 4. To further increase the strategy's accuracy, it also estimates the projected target area and validates the pattern using the Fibonacci extension tool.
Bearish Wolfe Wave Pattern
Five distinct price points, each with well-defined structural principles, must be found sequentially in a bearish Wolfe Wave pattern. The pattern must start with wave 1, which must be a swing high. Wave 2 must be placed below Wave 1 because it is a swing low. Wave 3 is then a swing high that surpasses wave 1 and falls inside a predetermined Fibonacci extension range of the price movement between waves 1 and 2. Then, wave 4 is created as a swing low that must stay above wave 2 while being below both waves 3 and 1.
Since wave 5 is a swing high that rises above wave 3 and needs to fall within a specific Fibonacci extension range of the move between waves 3 and 4, it ultimately becomes the most crucial point. Since the completion of wave 5 frequently indicates an overextended bullish push, the market is regarded as ready for a possible reversal to the downside whenever all these requirements are satisfied.

Waves 3 and 4 are to be at least 70% the size of Waves 1 and 2, enhancing reversal accuracy. Three trend lines are crucial for recognizing the Wolfe Wave pattern. To help to better define the pattern's upper structure, the first trend line is drawn from wave 1 to wave 3. The lower border is formed by the second trend line, which joins waves two and four. The pattern is visually framed by the converging structure formed by these two lines. A more strategic function is played by the third trend line, which is drawn from wave 1 to wave 4. It aids in determining wave 5's anticipated trajectory. This last trend line is a crucial reference point for trade entrance, since it frequently indicates a possible reversal when the price hits or approaches it.
Bullish Wolfe Wave Pattern
Five separate swing points must be identified in a particular order in a bullish Wolfe Wave pattern, each of which must adhere to exact structural rules. The pattern begins as a swing low in Wave 1. Wave 2 comes next, creating a swing high that needs to be placed above wave 1. Then, wave 3 is recognized as a swing low that falls within a specific Fibonacci extension range of the move between waves 1 and 2 and dips below wave 1. Following that, wave 4 appears as a swing high that needs to ascend above waves 1 and 3 but stay below wave 2.
The most important element of this bullish setup is wave 5. It must be located within a particular Fibonacci extension range of the move from wave 3 to wave 4 and is recognized as a swing low that occurs below wave 3. Following the completion of wave 5, the market is thought to be somewhat overextended to the downside, indicating a strong likelihood of an upside reversal.
Like the bearish pattern, the bullish Wolfe Wave depends on a sense of symmetry between its waves. The wave 3 to wave 4 transitions should ideally be as lengthy as the wave 1 to wave 2 transfers. More specifically, the transition from wave 1 to wave 2 should resemble wave 3 to wave 4 by at least 70%.
Three trend lines provide vital confirmation of the bullish Wolfe Wave. The initial trend line, drawn from wave 1 to wave 3, defines the bottom structure of the pattern. The second trend line connects waves two and four to establish the structure's upper boundary. These two trend lines often form a narrower, converging shape. The third and most significant trend line is shown from wave 1 to wave 4. It helps predict the expected trajectory of wave 5 and is an essential point of reference for trade entry.

Identifying Waves
To identify Wolfe Waves, we must first understand how to detect swing highs and swing lows. In previous articles, I explained how to identify these critical points. For a swing high, the high price of a specific bar must be higher than the high prices of a set number of bars before and after it. Similarly, a swing low occurs when the low price of a bar is lower than the low prices of the specified number of bars around it. These swing points serve as the foundation for determining the five-wave structure of the Wolfe Wave pattern. Without accurately detecting them, the rest of the pattern cannot be reliably identified.
Once swing highs and lows are accurately detected, the next step is to organize them into the five-wave structure that defines the Wolfe Wave pattern. There is a certain order in which each wave must be connected to the others. For instance, Wave 3 must be inside the range of the movement's legitimate Fibonacci expansion, while Waves 1 to 2 establish the starting orientation. This organized arrangement maintains the geometric symmetry and predictive power of the pattern. It is crucial to properly create this sequence before attempting to put it into an Expert Advisor.
Example:
//+------------------------------------------------------------------+
//| FUNCTION FOR SWING LOW                                           |
//+------------------------------------------------------------------+
bool IsSwingLow(const double &low_price[], int index, int lookback)
  {
   for(int i = 1; i <= lookback; i++)
     {
      if(low_price[index] > low_price[index - i] || low_price[index] > low_price[index + i])
         return false;
     }
   return true;
  }

//+------------------------------------------------------------------+
//| FUNCTION FOR SWING HIGH                                          |
//+------------------------------------------------------------------+
bool IsSwingHigh(const double &high_price[], int index, int lookback)
  {
   for(int i = 1; i <= lookback; i++)
     {
      if(high_price[index] < high_price[index - i] || high_price[index] < high_price[index + i])
         return false;
     }
   return true;
  }

A price chart's swing low can be found using the IsSwingLow() function. A swing low occurs when the low price of a bar is less than the low prices of the bars surrounding it. This function takes as inputs an array of low prices, a lookback number that specifies how many bars should be compared before and after the current bar, and a particular index to check. The function is then used to compare the current low with each of the surrounding bars. The function returns false if the current bar is not a swing low. It returns true, it's indicating that the current low is a swing low, if it is less than any of those surrounding values.
Likewise, identifying a swing high is the responsibility of the IsSwingHigh() function. When a bar's high price on the chart surpasses the highs of the bars right before and after it, it's known as a swing high. Similar in operation to IsSwingLow(), this function compares high prices rather than low ones. To determine whether any of the bars surrounding the target index have a greater high, it iterates through them. The function returns false and the current bar is not a swing high if even one does. A swing high is confirmed if the high of the current bar is higher than the highs of all the bars surrounding it.
When examining wave-based patterns like Wolfe Waves, these functions are crucial for locating the peaks and troughs in price data. Swing highs and lows are connected to generate waves in these patterns. These features enable the Expert Advisor to construct legitimate wave structures based on real market behavior by programmatically identifying certain turning moments.
In both functions, the lookback parameter is crucial. It specifies the number of bars that will be checked on either side of the current bar. A greater lookback value reduces false signals by requiring the swing to be more distinct from the surrounding price activity. The logic that recognizes waves in technical patterns is based on these functions, which are utilized frequently throughout the EA to identify possible trade setups.
Retrieving Candlestick Data and Identifying Swings
As usual, working with any chart pattern means you are working directly with price action. And to analyze price action effectively, the first and most essential step is to retrieve candlestick data from the chart. Without access to bar data, you cannot identify the swing highs and swing lows needed to define chart patterns like the Wolfe Wave. For a predetermined number of recent bars, we will retrieve the open, high, low, close, and time data. To help to identify important price turning points, these values will be kept in arrays and scanned via previous candles. We can start to identify the generation of waves that potentially resemble the Wolfe Wave pattern by determining these swing locations. Everything that comes after, such as determining Fibonacci extensions, confirming pattern structure, and drawing trend lines, is based on accurate swing detection.
Example:input ENUM_TIMEFRAMES timeframe = PERIOD_CURRENT; int bars_check = 500; datetime time_bar; double total_symbol_bars; double open[]; double close[]; double low[]; double high[]; datetime time[]; //+------------------------------------------------------------------+ //| Expert initialization function | //+------------------------------------------------------------------+ int OnInit() { return(INIT_SUCCEEDED); } //+------------------------------------------------------------------+ //| Expert deinitialization function | //+------------------------------------------------------------------+ void OnDeinit(const int reason) { } //+------------------------------------------------------------------+ //| Expert tick function | //+------------------------------------------------------------------+ void OnTick() { total_symbol_bars = Bars(_Symbol, timeframe); time_bar = iTime(_Symbol, timeframe, 0); CopyOpen(_Symbol, timeframe, time_bar, bars_check, open); CopyClose(_Symbol, timeframe, time_bar, bars_check, close); CopyLow(_Symbol, timeframe, time_bar, bars_check, low); CopyHigh(_Symbol, timeframe, time_bar, bars_check, high); CopyTime(_Symbol, timeframe, time_bar, bars_check, time); } //+------------------------------------------------------------------+ //| FUNCTION FOR SWING LOW | //+------------------------------------------------------------------+ bool IsSwingLow(const double &low_price[], int index, int lookback) { for(int i = 1; i <= lookback; i++) { if(low_price[index] > low_price[index - i] || low_price[index] > low_price[index + i]) return false; } return true; } //+------------------------------------------------------------------+ //| FUNCTION FOR SWING HIGH | //+------------------------------------------------------------------+ bool IsSwingHigh(const double &high_price[], int index, int lookback) { for(int i = 1; i <= lookback; i++) { if(high_price[index] < high_price[index - i] || high_price[index] < high_price[index + i]) return false; } return true; }
Explanation:
To regulate the number of historical bars it examines, this Expert Advisor initializes important variables like timeframe and bars_check. To recognize swings and chart patterns, it also declares arrays for storing candlestick data. The EA uses the Bars() and iTime() functions to determine how many bars exist and when to start copying data. Then, Copy*() functions load historical price data into arrays for analysis.
For a certain period and number of bars, functions such as CopyOpen() load particular price data, such as open, close, high, or low, into arrays. Although they target different price classes, all functions adhere to the same framework. The IsSwingLow and IsSwingHigh functions help identify key price turning points by checking if a candle’s low or high is more extreme than surrounding candles within a lookback range. If the condition is met, the candle is marked as a valid swing point.
Finding the five wave points that characterize chart patterns such as the Wolfe Wave requires the use of these functions. Actually, these swing detection functions will continue to be helpful as long as we work with chart patterns. They serve as the cornerstone of the approach, and this piece, like the others in this series, expands upon previously presented fundamental ideas. Every new piece should, however, include a clear explanation of them, particularly for readers who are only following this section of the series and haven't read the others.

2. Building an Expert Advisor
How the EA Works
Developing the Wolfe Wave Expert Advisor requires an understanding of the logic behind valid buy and sell opportunities. The EA needs to be able to identify these waves in historical price data and verify that they satisfy certain requirements, such as symmetry, and Fibonacci alignment, to operate effectively.
Outlining the fundamental framework that will direct the EA's decisions is crucial before we begin the actual coding. This entails specifying what constitutes a legitimate pattern, when to think about a possible entry, and how to steer clear of bogus formations. The Expert Advisor will only respond to high-probability setups that adhere to the traditional Wolfe Wave structure if this framework is established.
This part of the article lays the groundwork needed to later translate the pattern’s logic into programmatic steps. We’ll go over how to represent the chart visually using key wave points and how to prepare the data that the EA will use in its analysis.
Logic for Sell
- The EA will detect four points that qualify as wave 1, wave 2, wave 3, and wave 4 of a bearish Wolfe Wave pattern.
- It will draw three trend lines on the chart. The first connects wave 1 and wave 3 to outline the upper structure. The second connects wave 2 and wave 4 to define the lower structure. The third trend line connects wave 1 and wave 4 and is used to project the potential profit target area.
- A Fibonacci extension object will also be added to the chart for both the wave 1 and 2 legs, and the wave 3 and 4 legs. This helps verify that wave 3 and wave 5 meet the required extension criteria based on the Wolfe Wave structure.
- The EA monitors for a bullish breakout where price crosses and closes above the trend line drawn from wave 1 to wave 3.
- After the breakout occurs, the EA waits for a confirmation candle, a bearish candle that crosses back below the same trend line and closes under it.
- Once this confirming reversal candle closes, the EA immediately places a sell order.
- It then evaluates all bars between the breakout candle and the reversal candle to find the highest high in that range. This high is taken as the top of wave 5 and is used as the stoploss level.
- The take-profit will be specified. It allows the trade to run until the price reaches the projected trend line drawn from wave 1 to wave 4. This trend line serves as the final take-profit trigger.
- Once the price touches the wave 1 to wave 4 trend line, the EA automatically closes the sell trade.

Logic for Buy
- The EA will detect four points that qualify as wave 1, wave 2, wave 3, and wave 4 of a bullish Wolfe Wave pattern.
- It will draw three trend lines on the chart. The first connects wave 1 and wave 3 to define the lower structure. The second connects wave 2 and wave 4 to form the upper boundary. The third trend line connects wave 1 and wave 4 and is used to project the potential profit target area.
- A Fibonacci extension object will also be added to the chart for both the wave 1 and 2 legs, and the wave 3 and 4 legs. This helps validate whether wave 3 and wave 5 fall within the required extension ranges expected in a proper Wolfe Wave pattern.
- The EA monitors for a bearish breakout where price crosses and closes below the trend line drawn from wave 1 to wave 3.
- After this breakout, the EA waits for a confirmation candle, a bullish candle that crosses back above the same trend line and closes above it.
- Once this confirmation candle closes, the EA immediately places a buy order.
- The EA then checks all bars between the breakout candle and the reversal candle to determine the lowest low in that range. This low point is taken as the base of wave 5 and is used as the stoploss level.
- The take-profit will be specified. The trade remains open until the price reaches the projected trend line drawn from wave 1 to wave 4, which acts as the profit target zone.
- Once the price touches the trend line connecting wave 1 and wave 4, the EA automatically closes the buy trade.

Note: This project aims to teach MQL5 programming and chart pattern strategies, not for live trading. Always consult a financial expert before using any strategy in real markets.
Conclusion
In this article, you were introduced to the concept of the Wolfe Wave pattern, including its structure and the logic required to build an Expert Advisor based on it. We explored how to identify valid wave points using swing highs and lows, and the key principles that guide buy and sell setups. In the next article, we will explore how to implement this logic programmatically in MQL5, bringing the Wolfe Wave strategy to life through automated trading.
Warning: All rights to these materials are reserved by MetaQuotes Ltd. Copying or reprinting of these materials in whole or in part is prohibited.
This article was written by a user of the site and reflects their personal views. MetaQuotes Ltd is not responsible for the accuracy of the information presented, nor for any consequences resulting from the use of the solutions, strategies or recommendations described.


 From Basic to Intermediate: Union (II)
- Free trading apps
- Over 8,000 signals for copying
- Economic news for exploring financial markets
You agree to website policy and terms of use