

An Introduction to the Study of Fractal Market Structures Using Machine Learning
 2 602
2 602
 10
10

Introduction: Complexity of financial markets and non-linear approaches
Financial markets have complex, non-linear dynamics that traditional models often fail to capture. Linear approaches and classical risk indicators such as standard deviation and beta do not account for features such as heavy tails and volatility clustering.
Fractal theory, developed by Mandelbrot, offers an alternative that can describe "wild randomness" and self-similar structures in financial series. It reveals hidden patterns that elude traditional analysis and promotes a deeper understanding of market behavior.

Fig 1. Benoit Mandelbrot, creator of the fractal theory of markets
Fractal properties of financial time series: self-similarity and scale invariance
Financial data often possesses self-similarity — its structure is preserved when changing the scale. This fractal property is reflected in the similarity of price charts across timeframes, indicating scale invariance.
The existence of self-similarity challenges the Efficient Market Hypothesis (EMH) that assumes random walks. Repeating patterns across different time scales indicate potential predictability increasing interest in technical analysis.
A classic example is the study of B. Mandelbrot (1963), who showed distributional self-similarity in cotton prices and the application of stable Levy distributions in modeling.
Hurst exponent (H) measures the degree of long-term memory:
-
H > 0.5 — trend stability;
-
H < 0.5 — reversion to the mean;
-
H = 0.5 — random walk.
It is related to the fractal dimension of D via D = 2 - H. Empirically, H for DAX ≈ 0.54, for crude oil — 0.5224, which indicates a deviation from random behavior and the presence of persistence — an important condition for market predictability.
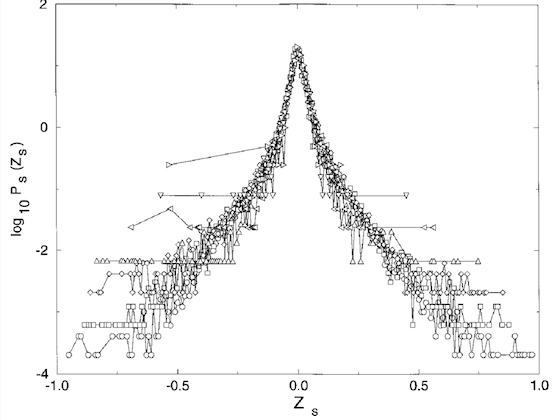
Fig. 2. Demonstration of scale invariance in financial time series. Source
Demonstration of scale invariance in financial time series. Mantegna and Stanley (1995) analyzed the probability distribution P(Z) of variations in the S&P index Z(t) observed over Dt time intervals that range from 1 to 1000 min. As Dt increases, a spread in the probability distribution is observed, characteristic of a random walk. A scaled graph of the probability distributions is shown. All data is compressed to a Dt = 1 min distribution using scaling transformations corresponding to the Levy distribution, with a = 1.40. Points outside the mean behavior define the noise level of that particular distribution.
Multifractality of financial time series: multidimensional scaling
Multifractal analysis reflects the complex nature of market dynamics. Unlike monofractals with a single scaling exponent, multifractals are characterized by variations in signal regularity that depend on the scale and order of statistical moments. This means that small and large price fluctuations obey different scaling laws.
Multifractal detrended fluctuation analysis (MF-DFA) is one of the key methods for assessing multifractality, using the generalized Hurst exponent H(q). Its non-linearity indicates the presence of a multifractal structure. The method is particularly effective for analyzing non-stationary series with heavy tails and long-term correlations.
Other approaches include multifractal conditional diffusion entropy (MS-CDE), moving average (MF-DMA), and cross-correlation analysis (MF-DCCA), allowing market behavior to be studied across different trends and time scales.
The multifractal spectrum f(α) describes the distribution of singularities and characterizes the "roughness" of the market. The spectrum width (Δα) serves as a quantitative measure of complexity and risk, reflecting the heterogeneity of scale characteristics and the potential for extreme events.
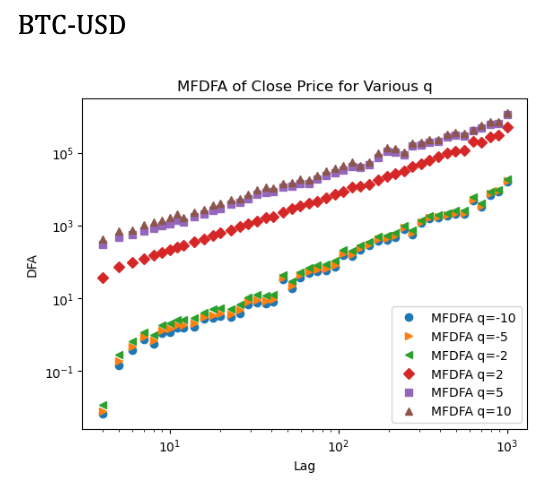
Fig. 3. MF-DFA price analysis of BTC/USD. Source
Symmetry in fractal financial structures
Fractals can be "exact" (patterns repeat exactly) or "statistical" (only statistical qualities repeat, with the introduction of randomness). Financial time series are usually viewed as statistical fractals due to their inherent noise and randomness. While exact symmetry may be less noticeable in noisy financial data, the statistical symmetry concept (or lack thereof) is crucial.
Financial time series often exhibit statistical properties that are not perfectly symmetric, such as heavy tails and asymmetry, which is a deviation from the symmetry of a normal distribution. This statistical asymmetry is a key fractal characteristic. This means that forecasting models cannot rely on perfect pattern repetition, but should use statistical regularities and probabilistic forecasting.
Exact fractals are constructed by precisely repeating the pattern at different magnifications, while statistical fractals introduce randomness by breaking the exact repetition so that only statistical qualities are repeated. Financial markets are inherently noisy and complex, making them more like statistical fractals, where patterns are not perfectly reproducible but have similar statistical properties across different scales. The distinction between exact and statistical fractals is crucial for realistic financial modeling. While the theoretical elegance of exact fractals provides a conceptual basis, practical applications in finance should take into account the inherent "noise" and "randomness" that make financial fractals statistical.
Distributions of financial returns often exhibit asymmetry (skewness around the mean) and kurtosis (heavy tails), deviating significantly from a normal distribution. Investors generally prefer positive skewness and thinner tails, i.e., a lower probability of extreme losses.
Multifractal analysis has gained widespread popularity due to its ability to capture asymmetric market risks by identifying different reactions to uptrends and downtrends and by identifying different scaling behaviors. Research shows asymmetric multifractal characteristics in stock indices, with significant differences in fractal spectra for different asset types. For example, multifractality may be higher in a downtrend for oil and in an uptrend for gold during crisis periods.
The observed asymmetries in financial returns, particularly in multifractal properties, pose a direct challenge to simplistic market models and offer a challenging path for risk management and forecasting. Recognizing that market behavior (and therefore predictability) varies significantly during uptrends, downtrends, or periods of crisis allows for the development of more adaptive and robust trading strategies that take these non-linear, asymmetric responses into account.
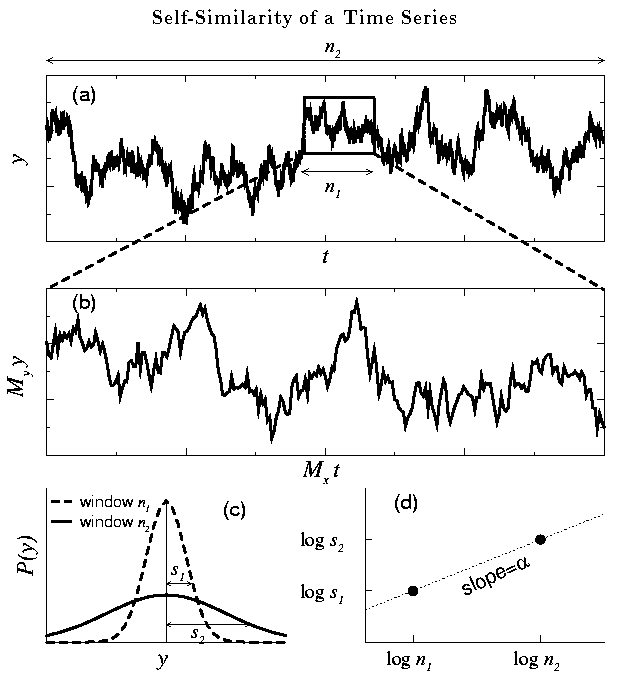
Fig. 4. An example of statistical symmetry of a time series. Source
Connections with chaos theory: Unpredictability and strange attractors
Chaos theory describes systems with "sensitive dependence on initial conditions", meaning that a tiny error in initial conditions can lead to drastic long-term changes. This phenomenon is often referred to as the "butterfly effect". Chaotic systems are unpredictable in the long term due to this sensitivity, as well as their aperiodic behavior, fractal dimensions, non-linearity, and strange attractors.
Financial markets are not completely random, but operate within chaotic, non-periodic structures called strange attractors that constrain price behavior to certain ranges.
This limited unpredictability allows for the identification of statistical patterns and support/resistance levels. The concept of chaotic attractors explains why prices exhibit repetitive, but not identical, movements.
The fractal markets hypothesis (FMH), proposed by Edgar Peters, states that market data has a fractal structure that depends on investment horizons. During crises, the structure collapses, which leads to increased volatility and decreased liquidity. Unlike EMH, FMH allows for periods of market inefficiency and predictability, particularly under stressful conditions.
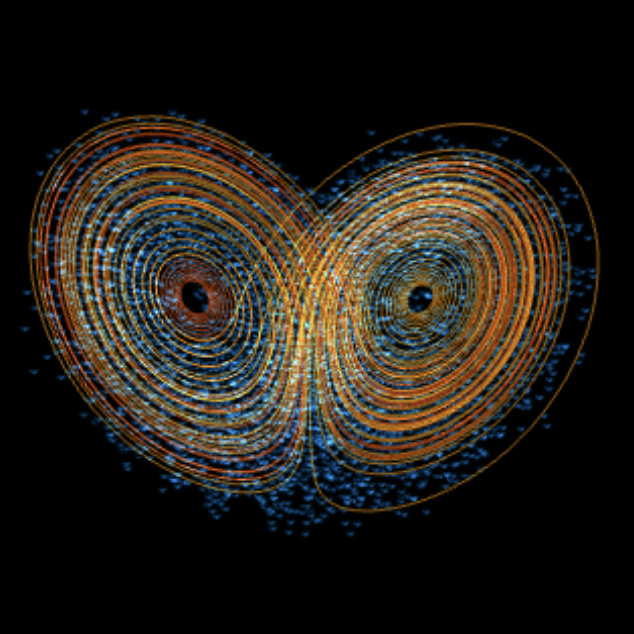
Fig. 5. The butterfly effect using the Lorenz attractor as an example. Interactive source
Synergetics and self-organization of financial markets
Synergetics studies the self-organization of complex systems, including financial markets, where ordered fractal structures emerge without centralized control. Markets function as open, non-linear systems that can transition from chaos to order under the influence of internal and external factors.Financial markets have the ability to self-organize, forming fractal patterns through feedback loops, information flows, and the collective behavior of participants. These patterns are not external effects, but emergent properties of the system.
These dynamics explain the persistence of trends, the clustering of volatility, and the existence of "market memory", suggesting that understanding the mechanisms of information flow and investor reactions is key to analyzing and forecasting fractal market behavior.
Prognostic properties of fractal and multifractal characteristics
Fractal and multifractal characteristics of financial series provide valuable tools for market analysis. Hurst exponent (H) evaluates long-term memory:
-
H > 0.5 — stable trend,
-
H < 0.5 — reversion to the mean,
-
H ≈ 0.5 — random walk.
A high H value helps to more accurately predict market behavior and choose the appropriate strategy: trend or counter-trend. H is also used to assess market turbulence and detect crisis phases.
Multifractal analysis reveals the degree of market "roughness" and large-scale patterns. The spectral width (Δα) serves as a predictor of volatility, market conditions and potential returns. For example, the MS-CDE method allows one to distinguish between bullish and bearish markets based on the sign of α.
Fractal data is applicable in algorithmic trading improving the choice of stop-loss levels, position size and portfolio structure. Self-similarity analysis helps adapt strategies to changing market conditions. Combining fractal dimension with machine learning improves the accuracy of market forecasts and the effectiveness of risk management.
Defining symmetrical fractal structures
Our approach will differ from the approaches described above, which are used primarily for risk assessment. In order to effectively predict the direction of market movements in the short term, it is necessary to determine the basis on which the predictions will be made. The theoretical part already introduces the concept of strange attractors and chaotic patterns that are described by these attractors.
In other words, price charts are capable of forming certain repeating structures under the influence of external information that organizes them. Market participants create a complex dynamic system that has memory elements that take the form of certain market symmetries (patterns). These patterns may evolve over time or may repeat. Due to the self-similarity of fractal market structures, patterns can be expressed across different time scales.
As a starting point, let's consider the well-known Mandelbrot set to illustrate self-repetition in scale.

Fig. 6. Mandelbrot set
The Mandelbrot set can be divided into separate parts (large and small), which are similar to each other. There is a direct analogy with price charts, which form similar structures regardless of the time period we are looking at. If we hide the time axis on hourly and daily charts, the average trader will hardly be able to distinguish which timeframe each one belongs to.
The Mandelbrot set exhibits fractal structure and self-similarity reminiscent of price charts: their shape is preserved on different time scales. If we hide the scale, it is difficult to distinguish the hourly chart from the daily one just like the different parts of the Mandelbrot set.
Key properties of the Mandelbrot set:
-
Compactness and boundedness: all points lie in a circle of radius 2; if the modulus exceeds 2, the point does not belong to the set.
-
Connectivity: the set is continuous, despite its visual complexity.
-
Approximate self-similarity: the structure is repeated with variations.
-
Symmetry along the real axis.
-
Fractal boundary with infinite complexity.
Additional elements:
-
Cardioid and bulbs : the main form and its "satellites", repeating the structure of the set.
-
Whiskers and threads: thin connections that form a single coherent structure.
-
Connection with Julia sets: each point c corresponds to a Julia set, which may be connected or not.
-
Periodic regions: sections where the sequence zn = zn² + c converges to a cycle. This reflects period-doubling bifurcations leading to chaos. Such areas visually organize the complexity of the set and indicate transitions between stability and chaos.
The Mandelbrot set illustrates how simple rules give rise to complex behavior, demonstrating connections to chaos theory, bifurcations, and the visualization of dynamical systems. Its structure serves as a model for analyzing market dynamics, complex cycles and behavior patterns.
Thus, each particular Julia set can be defined as a separate building block of the Mandelbrot set:
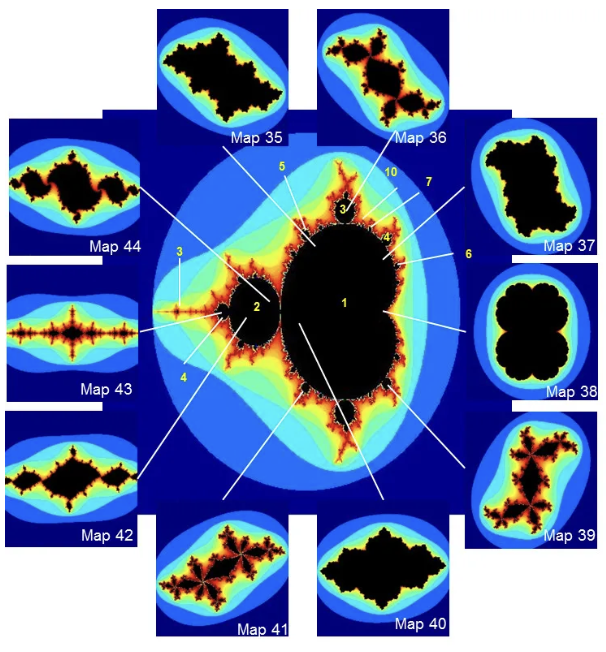
Fig. 7. Julia sets as subsets of the Mandelbrot set. Source
Why do Julia sets have attracting orbits? Here lies the key connection between the Mandelbrot set and the Julia sets:
-
Relationship with the Mandelbrot set:
- If the c parameter belongs to the Mandelbrot set (c∈M), then the corresponding Julia set J(fc) is connected. In this case, the filled Julia set contains attracting orbits. These attracting orbits (fixed points or cycles) are in the interior of the filled Julia set.
- If the c parameter does not belong to the Mandelbrot set (c∈/M), then the corresponding Julia set J(fc) is disconnected. In this case, the filled Julia set contains no attracting orbits (except perhaps at infinity), and all points either go to infinity or are part of a complex, chaotic dynamic on the very boundary of the set.
-
The role of attracting orbits in dynamics:
- An attracting orbit (attractor) is a sequence of points nearby points are attracted to. If you start iterations from a point that is in the attraction basin of the attracting orbit, your zn sequence will eventually approach this orbit and remain close to it.
- When the Julia set is connected (c∈M), this means that there is some region of points that do not "escape" to infinity. These points are "stuck" in a finite region of the complex plane. They do this because they are attracted to an attracting orbit (or a set of such orbits) located inside the filled Julia set.
Julia sets as an analogy for "specific market development scenarios"
For each specific c value (i.e. for each point on the "Mandelbrot landscape"), we get our own unique Julia set. This set describes the dynamics of iterations for a given c: which z0 starting points remain bounded (belong to a filled Julia set) and to which attractors they will converge, and which will "escape" to infinity.Each specific Julia set for a given c (which in turn represents the "current market state" or "set of prevailing parameters") may be an analogy to the market behavior at that particular point in time or in a given "market regime".
- If c is located inside the Mandelbrot set (for example, in one of the 3-period "bulbs"), then the corresponding Julia set will be connected and will have attracting orbits. In the market, this can mean that, despite apparent complexity, there are certain "attracting" levels, prices, or cycles that the market continually returns to or fluctuates around. These can be strong support/resistance levels, average values to which the price tends to return (i.e. reversion to the mean).
- If c is outside the Mandelbrot set, the corresponding Julia set is disconnected ("Fatou dust") and has no attracting orbits (except infinity). This may be an analogy to highly volatile or "explosive" market conditions, where price has no "anchors" and tends to infinity (e.g. hyperbolic growth or collapse), and any small disturbances lead to unpredictable and radically different behavior. Any trading strategy based on "reversion to the mean" will fail under such conditions.
Since we have too many analogies that confirm the possibility of considering market quotes as self-similar fractals, this allows us to think about the forecasting horizons of such structures.
- If we are inside the "body" of the filled Julia set (that is, in the Fatou region), our "forecast horizon" is quite large. We can be sure that the trajectory will tend towards an attracting orbit.
- If we are on the border, which is the Julia set itself, then our "forecast horizon" tends to zero. Any small change in our starting point can send us on a completely different path.
Thus, the "predictability horizons" for Julia sets are not fixed lines or numbers, but rather depend on where in the complex plane we are located with respect to these fractal structures. While there is predictability within the Fatou set, on the Julia set it is practically non-existent.
We will be able to find patterns that satisfy the properties of Julia fractals using the function that will be proposed in the article devoted to the practical application of fractal market structures. Each of them has its own center of attraction (or orbit), indicated by a vertical dotted line, from which the graph reflects itself "mirror-like" into the past and future. This means that the mirror image of the right side of the graph will have a high correlation with the left side.
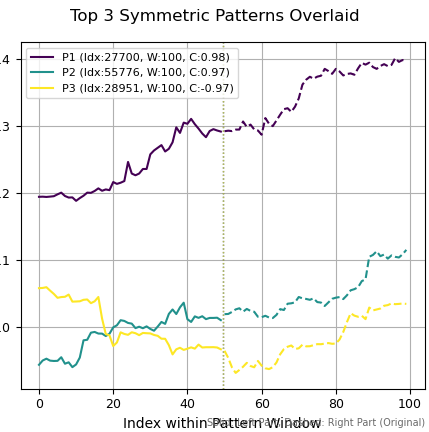
Fig. 8. Fractals found on EURUSD
In Figure 8, 3 fractals were found, the left and right parts of which are strongly correlated with each other. That is, if we knew the center of attraction (attractor or orbit) in advance, or rather its position in time, we could easily predict future price dynamics. When located in this Julia Fractal region (Fatou region), markets become clear and predictable. We will use this property of fractals to predict market dynamics using machine learning.
The image below was generated by me using a neural network in order to visually highlight the presence of an attractor and a point of attraction in a section of the graph. Prices "dance" around the luminous center of the orbit, forming a mirror-symmetrical structure. This image very accurately conveys the meaning of the fractal symmetries that will be explored. You can compare Fig. 8 and Fig. 9 to visually understand the concept of market fractals.

Fig. 9. Visualization of an attractor on a financial chart
Challenges and limitations of applying fractal theory in finance
Despite the significant predictive potential of fractal theory, its application in finance is associated with a number of challenges and limitations. Financial data is notoriously noisy, making it difficult to identify clear self-similar patterns. Financial time series are often non-stationary, meaning their statistical properties change over time, which poses a challenge for traditional analysis methods. Reliable methods are needed to capture evolving market dynamics. Assessing the accuracy of the Hurst exponent can be difficult.
The Hurst exponent is not deterministic because it can only be estimated from observed data. The inherent noise and non-stationarity of financial data pose significant methodological obstacles to fractal analysis. While advanced methods, such as MF-DFA, are designed to mitigate these issues, they introduce complexities in parameter estimation and model validation. This means that while fractal properties offer predictive potential, their extraction and reliable application require sophisticated data pre-processing and robust statistical testing, recognizing the dynamic nature of market parameters.
Furthermore, complex models based on fractal theory often require significant computational resources and expert knowledge to be implemented correctly. It is crucial to find a balance between the complexity of the model and its interpretability. Complex models can capture complex patterns in data, but they often lack transparency, making them difficult to interpret and use in practice. Analyzing large financial datasets requires significant computing resources and scalable algorithms.
The computational intensity and interpretability issues associated with complex fractal and multifractal models highlight the practical trade-offs in financial applications. While these models offer deeper insights and potentially better predictive power, their implementation requires significant technical expertise, which may limit their accessibility and real-time applicability for many users.
Conclusion of the introductory part and research prospects
Financial time series exhibit fractal and multifractal properties, including self-similarity, long-term memory (Hurst exponent), and scale heterogeneity (multifractal spectrum). These features expand on traditional approaches, providing more accurate forecasting of trends, volatility, and market patterns.Fractal analysis opens the way to adaptive algorithmic strategies and improved risk management that take into account market non-linearities and asymmetries. Its further development requires integration with machine learning, big data analytics, and the creation of models capable of taking into account the dynamics of market regimes and the impact of data flows.
Future research should focus on:
- adaptive multifractal models;
- stability of parameter estimates in noisy conditions;
- studying cause-and-effect relationships in market self-organization;
- searching for an "optimal range of complexity" as an indicator of market sustainability.
Translated from Russian by MetaQuotes Ltd.
Original article: https://www.mql5.com/ru/articles/18453
Warning: All rights to these materials are reserved by MetaQuotes Ltd. Copying or reprinting of these materials in whole or in part is prohibited.
This article was written by a user of the site and reflects their personal views. MetaQuotes Ltd is not responsible for the accuracy of the information presented, nor for any consequences resulting from the use of the solutions, strategies or recommendations described.

 Market Microstructure in MQL5 (Part 3): Estimating ARFIMA d with GPH
 Trading with the MQL5 Economic Calendar (Part 12): SQLite Storage and Deduplication
 Building a Megaphone Pattern Indicator in MQL5
 Price Action Analysis Toolkit Development (Part 70): Turning Flag Pattern Signals into Automated Trade Execution

- Free trading apps
- Over 8,000 signals for copying
- Economic news for exploring financial markets
You agree to website policy and terms of use
I did:
Consensus of opinions of forum members (at least then) - negative.
Testing of forecasting in practice through peiper-trading on EURUSD D1 for several months (according to V.A.Golovko - Neural Network Methods of Processing Chaotic Processes) showed mixed results. Then I did not return to this topic.
Imho, it is a question of multiple experiments and selection of the right features/pattern marking. Maybe you will be lucky, maybe not so lucky.
did it ever seem like Hearst was kind of a no-brainer when it was dynamic?
Did it ever seem like Hearst was kind of a no-brainer when it's all dynamic?
There is nothing stopping you from counting Hurst in a sliding window. It will be another extremely useful indicator.