

Low-Frequency Quantitative Strategies in MetaTrader 5 (Part 4): A Volatility-Adjusted Momentum-Based Intraday System
 4 024
4 024
 4
4

Introduction
In March 2024, the Swiss Finance Institute published a research paper aimed at assessing the "validity of day trading as a long-term consistent and uncorrelated source of income for traders and investors". To answer this question, they analysed the profitability of Opening Range Breakout (ORB) strategies across "more than 7,000 US stocks traded from 2016 to 2023".
A selected portfolio of 20 stocks from that universe "achieved a total net performance of over 1,600%, with a Sharpe ratio of 2.81, and an annualized alpha of 36%. Passive exposure in the S&P 500 would have achieved a total return of 198% during the same period."
Since the tests were conducted in both academic and commercial environments, the results are somewhat impressive. But why did the study authors choose ORB among thousands of possible intraday strategies? They say they chose ORB because it is one of the most important, well-studied, and well-documented day trading strategies. Furthermore, ORB strategies are built over a clear hypothesis about the market behavior. That is, they are based on an economic rationale, instead of a mere "retrospective optimization".
This rationale is that unpriced corporate news can act as a volatility catalyst at the session open. Examples include earnings surprises, layoffs, management changes, stock splits, buybacks, and high-impact announcements (eg, FDA approvals). They would prompt institutional investors to re-evaluate their positions in a specific stock, creating an imbalance between supply and demand, potentially triggering a trend that would persist until the end of the day.
According to the authors, the stocks most sensitive to the supply/demand imbalances prompted by corporate news are those characterized by
- high volatility
- significant relative volume
- and widespread trader interest
These are the most relevant criteria used for stock selection in ORB strategies.
While most research studies aim to improve the performance of institutional portfolios, one of the main goals of the ISF’s study was to empower retail traders. In particular, to help them compete in an unequal playing field against High-Frequency Trading (HFT).
"Most retail traders gravitate toward day trading or short-term swing trades. But there is a daunting challenge for retail traders who are competing with high-frequency trading (HFT) algorithms. They need access to proven strategies that can give them an edge and consistent advantage in the markets, often with technical analysis. Our previous research had been focused on informing retail traders and developing, testing, and refining day trading strategies that are useful for retail traders without access to the lowest commission tiers or HFT capabilities." [Zarattini et al., 2024]
Thus, we have an intraday trading system with proven results. It was evaluated by academic and industry professionals over multiple years and is intended to help retail day traders in markets dominated by HFT algorithms.
So, let’s see if we can make use of this edge and how to do so.
Trading only Stocks in Play
As noted, ORB is a well-known strategy. There is no novelty in trading the opening range breakout in sync with high-impact corporate news. These breakouts are part of any introductory day trading course. Also, it is a relatively common practice to use volume, usually by tracking the anchored VWAP (Volume Weighted Average Price), as a primary screening metric.
However, the authors attribute some degree of novelty in the choice to trade only "Stocks in Play", that is, stocks that show an unusual peak in relative volume in the first few minutes of the market opening.
"A new aspect of our study was the focus on Stocks in Play, which are stocks that show higher than normal trading activity on a specific day, mostly because of fundamental news about the company. Our results showed a significant benefit in limiting day trading only to those Stocks in Play (even after considering transaction costs)."
The relative volume is calculated by comparing a stock's current trading activity to its recent historical average, specifically on the opening range volume.
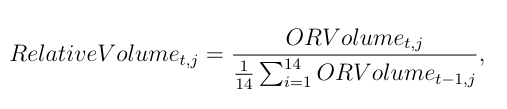
Fig. 1 - Relative Volume formula as presented in the original paper
ORVolumet,j represents the volume traded in stock j, during the opening range formation on day t.
The formula is for reference. The relative volume calculation is very simple and intuitive. It is reasonable to suppose that many of us, retail traders with several levels of experience and expertise, have already used it, or any variation of it, to calculate relative volume.
For a 5-minute opening range, for example:
- We take the current opening volume, that is, the total volume traded during the first 5 minutes of the current trading day.
- Calculate the historical baseline by finding the average volume traded during the first 5 minutes of the day over the previous 14 trading days.
- Then, we divide the current opening volume by the historical baseline.
This simple calculation detects any trading volume abnormality on the opening range, which may indicate the institutional supply/demand imbalance we are looking for. The SFI’s research found a strong positive correlation between high relative volume and actual profit.
By calculating the relative volume this way, we can select the top high-activity stocks, which is a key to the ORB system's profitability. In SFI’s research, they saw the total returns increase from 29% to 1,637% by applying the relative volume filter to target stocks with at least 100% relative volume and trading only the top 20 of them. Without this filter, the ORB strategies often trade stocks that lack the necessary volatility and volume to sustain a trend throughout the session.
Although the relative volume at the opening of the trading session is the core metric to decide if a stock is worth trading on the current day, not all stocks are evaluated all the time. This would not be effective or even practical. There is a pre-screening based on three criteria to filter out penny stocks and illiquid ones:
- Minimal opening price above US$5.00
- Minimal 14-day average daily volume of at least 1,000,000 shares per day
- Minimal 14-day Average True Range (ATR) above US$0.50
This pre-screening ensure the selected stocks have enough liquidity and volatility.
"This strategy aims to identify assets that exhibit an abnormal imbalance between demand and supply in the first few minutes of the trading session. The hypothesis is that this imbalance will persist throughout the session, creating exploitable intraday trends. While the direction of the demand-supply imbalance can be inferred from the opening range, its abnormality can be assessed by comparing its current opening range volume to its recent average." [Zarattini et al., 2024]
Like the swing trade system we saw in the previous Part of this series, this ORB is a volatility-based and adaptive system that filters the stocks based on the expected increase in volatility for the current day. Its main goal is to locate directional momentum driven by institutional re-positioning in response to overnight catalysts.
MQL5 implementation
The ORB system depends on precise timing. Synchronizing NYSE session time with the broker's server time is crucial for both the opening calculations and end-of-day position closure. Time-synchronization failures may cause losses if positions remain open after the session ends. Therefore, we do not rely on OnTick. Instead, we use a timer-based signal to make sure that the scan and trades trigger precisely at the end of the first candle, even if there are no new price ticks at that exact moment. Also, we include a kind of ‘safety net’ to close any position left open from the day before starting a new trading session. This simple measure has helped to avoid issues with synthetic bars while backtesting.
//+------------------------------------------------------------------+
//| Timer function                                                   |
//+------------------------------------------------------------------+
void OnTimer()
  {
   datetime now = TimeCurrent();
   MqlDateTime dt;
   TimeToStruct(now, dt);
//--- Reset session flags on new day
   if(dt.day != m_current_day)
     {
      //--- SAFETY: Close anything left from yesterday before starting the new day
      if(m_current_day != -1)
         CloseAll();
      m_current_day = dt.day;
      m_trades_placed = false;
      m_session_closed = false;
      m_session_start_server = ETToServer(InpMarketOpenET, now);
      m_session_end_server = ETToServer(InpMarketCloseET, now);
      m_or_end_server = m_session_start_server + PeriodSeconds(InpORTimeframe);
      Print("--- NEW TRADING DAY: ", TimeToString(now, TIME_DATE), " ---");
     }
//--- 1. End of Opening Range: Scan and Trade
   if(now >= m_or_end_server && now < m_session_end_server && !m_trades_placed)
     {
      ScanAndPlaceTrades();
      m_trades_placed = true;
     }
//--- 2. Market Close: Global Exit
   if(now >= m_session_end_server && !m_session_closed)
     {
      CloseAll();
      m_session_closed = true;
     }
  }
Dealing with different broker server times
The InpServerUTCOffset parameter is used to align the broker server time with the NYSE session (9:30 a.m. to 4:00 p.m. ET).
input int InpServerUTCOffset = 2; // Broker Server UTC Offset (2 for GMT+2)
InpServerUTCOffset must be set to the broker's Standard Time (winter) UTC offset. The EA handles Daylight Saving Time (DST) by checking the current date and adding 1 hour to the offset if it is in summer. In the example above from our attached sample, it will use 2 in the winter and 3 in the summer.
//+------------------------------------------------------------------+
//| Get Server Time offset to Eastern Time (ET)                      |
//+------------------------------------------------------------------+
int GetETOffset(datetime time)
  {
   MqlDateTime dt;
   TimeToStruct(time, dt);
   bool isDST = false;
   if(dt.mon > 3 && dt.mon < 11)
      isDST = true;
   else
      if(dt.mon == 3)
        {
         int secondSunday = 14 - ((dt.year * 5 / 4 + 1) % 7);
         if(dt.day > secondSunday)
            isDST = true;
        }
      else
         if(dt.mon == 11)
           {
            int firstSunday = 7 - ((dt.year * 5 / 4 + 1) % 7);
            if(dt.day < firstSunday)
               isDST = true;
           }
   int brokerCurrentUTC = InpServerUTCOffset + (isDST ? 1 : 0);
   int etCurrentUTC = (isDST ? -4 : -5);
   return brokerCurrentUTC - etCurrentUTC;
  }
While backtesting, we can run a multi-year backtest in the Strategy Tester, and the EA will identify 09:30 ET for every day in history, accounting for all US DST shifts from March to November.
There is an extensive explanation of managing datetimes and timezones in Dealing With Time, Part 1 and Part 2 articles.
The header fileAs good practice recommends, the main Expert Advisor file contains only the main event handlers, trade execution logic, and state management. The stateless calculations and trading filters are in a separate header file.
IsEligible is our main screening function. Only stocks that traded at a minimum price, volume, and volatility in the last 14 days are included in the relative volume calculation that follows.
//+------------------------------------------------------------------+
//| Eligibility Filters                                              |
//+------------------------------------------------------------------+
bool IsEligible(double price,
                double avgVolume,
                double atr,
                double minPrice,
                double minAvgVol,
                double minATR)
  {
   return (price >= minPrice && avgVolume >= minAvgVol && atr >= minATR);
  }
Since these parameters are all part of the EA input parameters, there is plenty of room for exploration and optimization here, including experimentation with different instruments/markets.
input double          InpPriceThreshold   = 5.0;           // Min Price
input long            InpMinVolume        = 1000000;       // Min 14-day Avg Volume
input double          InpMinATR           = 0.5;           // Min 14-day ATR
input double          InpRelVolThreshold  = 100.0;         // Min Relative Volume %
CalculateRelVol is where the stock's relative volume on the session opening is calculated. This is the main signal filter. Only stocks that go beyond the relative volume threshold (input parameter) are considered to be traded if we have an opening range breakout.
//+------------------------------------------------------------------+
//| Relative Volume Calculation                                      |
//+------------------------------------------------------------------+
double CalculateRelVol(long currentORVolume, const long &prevORVolumes[])
  {
   int count = ArraySize(prevORVolumes);
   if(count == 0)
      return 0.0;
   long sum = 0;
   for(int i = 0; i < count; i++)
      sum += prevORVolumes[i];
   double avg = (double)sum / count;
   if(avg == 0)
      return 0.0;
   return (currentORVolume / avg) * 100.0; // Return percentage
  }
CalculateLots ensures that a hit stop-loss results in, by default, a 1% loss of capital, capped by 4x leverage.
//+------------------------------------------------------------------+
//| Position Sizing                                                  |
//+------------------------------------------------------------------+
double CalculateLots(string symbol,
                     double accountEquity,
                     double riskPercent,
                     double stopLossPoints,
                     double leverage)
  {
   if(stopLossPoints <= 0)
      return 0.0;
   double tickValue = SymbolInfoDouble(symbol, SYMBOL_TRADE_TICK_VALUE);
   double lotSize = SymbolInfoDouble(symbol, SYMBOL_TRADE_CONTRACT_SIZE);
   double volStep = SymbolInfoDouble(symbol, SYMBOL_VOLUME_STEP);
   double volMin = SymbolInfoDouble(symbol, SYMBOL_VOLUME_MIN);
   double volMax = SymbolInfoDouble(symbol, SYMBOL_VOLUME_MAX);
   double price = SymbolInfoDouble(symbol, SYMBOL_ASK);
   double digits = (double)SymbolInfoInteger(symbol, SYMBOL_DIGITS);
   if(tickValue <= 0 || lotSize <= 0 || volStep <= 0 || price <= 0)
      return 0.0;
//--- 1. Calculate lots based on risk
   double riskAmount = accountEquity * (riskPercent / 100.0);
   double lots = riskAmount / (stopLossPoints * tickValue);
//--- 2. Apply leverage cap
   double maxLots = (accountEquity * leverage) / (price * lotSize);
   if(lots > maxLots)
      lots = maxLots;
//--- 3. Normalize to volume step
   lots = MathFloor(lots / volStep) * volStep;
//--- 4. Bounds check
   if(lots < volMin)
      lots = 0.0;
   if(lots > volMax)
      lots = volMax;
//--- 5. Normalize to symbol digits
//--- int digits = (int)MathMax(0, MathCeil(MathLog10(1.0 / volStep)));
   return NormalizeDouble(lots, (int)digits);
  }
Both (maximum risk and max leverage) are configurable input parameters.
input double          InpRiskPercent      = 1.0;           // Risk per trade %
input double          InpMaxLeverage      = 4.0;           // Max Leverage
Max leverage only applies if we were trading CFD stocks (not physical shares) on a broker that offers floating (or dynamic) leverage. Tipically, dynamic leverage is not available for the majority of non-professional retail traders. But let’s keep it here for fidelity with the original model proposed and tested by the SFI, and for documentation purposes.
GetOpeningBias is a very simple function to return the directional bias for the day/session. Despite its simplicity, it is the core of the system, because it is this directional bias that will define if the system is allowed to open only long positions (BIAS_BULLISH), only short positions (BIAS_BEARISH), or if the system must not trade this day (BIAS_NEUTRAL), when the first 5-minute candle is a doji.
//+------------------------------------------------------------------+
//| Opening Bias                                                     |
//+------------------------------------------------------------------+
ENUM_BIAS GetOpeningBias(double open, double close)
  {
   if(close > open)
      return BIAS_BULLISH;
   if(close < open)
      return BIAS_BEARISH;
   return BIAS_NEUTRAL;
  }
The functions above, plus some helpers, are called from the ScanAndPlaceTrades function in the main EA file.
//+------------------------------------------------------------------+
//| Scan symbols and place trades                                   |
//+------------------------------------------------------------------+
void ScanAndPlaceTrades()
  {
   int total = SymbolsTotal(true);
   SymbolRelVol results[];
   int count = 0;
   for(int i = 0; i < total; i++)
     {
      string symbol = SymbolName(i, true);
      MqlRates ratesD1[];
      //--- Fetch 15 bars to calculate 14 True Range values (starting from yesterday)
      if(CopyRates(symbol, PERIOD_D1, 1, 15, ratesD1) < 15)
         continue;
      double avgVol14 = 0;
      //--- Index 14 is the most recent (yesterday)
      for(int j = 1; j < 15; j++)
         avgVol14 += (double)ratesD1[j].real_volume;
      avgVol14 /= 14.0;
      double price = SymbolInfoDouble(symbol, SYMBOL_BID);
      double trSum = 0;
      //--- Index 0 is D-15, Index 14 is D-1 (newest).
      for(int j = 1; j < 15; j++)
         trSum += MathMax(ratesD1[j].high - ratesD1[j].low, MathMax(MathAbs(ratesD1[j].high - ratesD1[j - 1].close), MathAbs(ratesD1[j].low - ratesD1[j - 1].close)));
      double atr14 = trSum / 14.0;
      if(!IsEligible(price, avgVol14, atr14, InpPriceThreshold, InpMinVolume, InpMinATR))
         continue;
      MqlRates ratesOR[];
      if(CopyRates(symbol, InpORTimeframe, m_session_start_server, m_or_end_server, ratesOR) < 1)
         continue;
      long histORVols[];
      ArrayResize(histORVols, 14);
      int foundHist = 0;
      datetime now = TimeCurrent();
      for(int d = 1; d <= 30 && foundHist < 14; d++)
        {
         datetime targetDate = now - d * 86400;
         datetime histStart = ETToServer(InpMarketOpenET, targetDate);
         datetime histEnd = histStart + PeriodSeconds(InpORTimeframe);
         MqlRates r[];
         if(CopyRates(symbol, InpORTimeframe, histStart, histEnd, r) > 0)
            histORVols[foundHist++] = r[0].real_volume;
        }
      if(foundHist < 14)
         continue;
      ArrayResize(histORVols, foundHist);
      double relVol = CalculateRelVol(ratesOR[0].real_volume, histORVols);
      if(relVol < InpRelVolThreshold)
         continue;
      ArrayResize(results, count + 1);
      results[count].name = symbol;
      results[count].relVol = relVol;
      results[count].bias = GetOpeningBias(ratesOR[0].open, ratesOR[0].close);
      results[count].orHigh = ratesOR[0].high;
      results[count].orLow = ratesOR[0].low;
      results[count].atr14 = atr14;
      count++;
     }
   SortResults(results);
   int toTrade = MathMin(count, InpMaxSymbols);
   for(int i = 0; i < toTrade; i++)
      ExecuteORBTrade(results[i]);
  }
After a stock passes the eligibility filters and exceeds its 14-day average opening-range volume, we call ExecuteORBTrade to place orders.
//+------------------------------------------------------------------+
//| Execute Trade for a symbol                                       |
//+------------------------------------------------------------------+
void ExecuteORBTrade(SymbolRelVol &res)
  {
   if(res.bias == BIAS_NEUTRAL)
      return;
   double entry = (res.bias == BIAS_BULLISH) ? res.orHigh : res.orLow;
   double slDist = 0.1 * res.atr14;
   double sl = (res.bias == BIAS_BULLISH) ? entry - slDist : entry + slDist;
   double stopLossPoints = MathAbs(entry - sl) / SymbolInfoDouble(res.name, SYMBOL_POINT);
//--- Split risk across symbols: Pass the fractional risk directly to CalculateLots
   double splitRisk = InpRiskPercent / (double)InpMaxSymbols;
   double lots = CalculateLots(res.name, AccountInfoDouble(ACCOUNT_EQUITY), splitRisk, stopLossPoints, InpMaxLeverage);
   if(lots <= 0)
      return;
   double ask = SymbolInfoDouble(res.name, SYMBOL_ASK);
   double bid = SymbolInfoDouble(res.name, SYMBOL_BID);
//--- Use Market orders if price is already past the level
   if(res.bias == BIAS_BULLISH)
     {
      if(ask >= entry)
         m_trade.Buy(lots, res.name, ask, sl, 0, "ORB Market Entry");
      else
         m_trade.BuyStop(lots, entry, res.name, sl, 0, ORDER_TIME_GTC);
     }
   else
     {
      if(bid <= entry)
         m_trade.Sell(lots, res.name, bid, sl, 0, "ORB Market Entry");
      else
         m_trade.SellStop(lots, entry, res.name, sl, 0, ORDER_TIME_GTC);
     }
   Print("ORB Order placed for ", res.name, " Lots: ", lots, " RelVol: ", res.relVol);
  }
Entries
Usually, the trade is executed via buy/sell stop orders placed at the high/low of the 5-minute range, according to the day’s directional bullish/bearish bias. That is, we place a buy stop at the first 5-minute high if the bias is bullish; we place a sell stop at the first 5-minute low if the bias is bearish.
The stop-loss is based on the Average True Range (ATR) of the last 14 days. It is set at 10% of the 14-day ATR from the entry price. This means that our stop-loss is volatility-adjusted, a variable one. But remember that we have position sizing constraints that keep our risk-per-trade under control. As we saw above, our position size is dynamically adjusted such that if the stop-loss level is hit, this will represent a loss of exactly 1% of total capital.
ExitsIf the market moves according to our expectations and the stop-loss is not reached, all open positions are closed at 4:00 PM ET. All non-triggered orders are also closed at the end of the day. In our backtests, the profit/loss ratio is nearly 1:4, yet profitable due to the combination of a relatively small ATR-based stop-loss, with the end-of-day position close rule.
If the market moves against our expectations, our short stop-loss is reached early. On the other hand, when we have a favourable trend, we stay with it until the market closes. At the end of the day (literally), we can have several small losses, but we’ll secure large profits when the market goes with our expectations.
Backtests
The system can run on M5, M10, M15, M30, and H1 timeframes, but, as indicated by SIF’s research and by our own backtests, the best results were achieved on the M5 timeframe.
On M5, we had less than 6 days of market exposure each month, with 99 trades in 17 months, averaging 5.8 trades/month.
Since OHLC data is enough for our purposes here, the backtests use free exchange data from a MetaQuotes Demo account, so you can easily reproduce them. But if you are willing to take this model for real trading, you should consider running your backtests with an Exchange subscription.
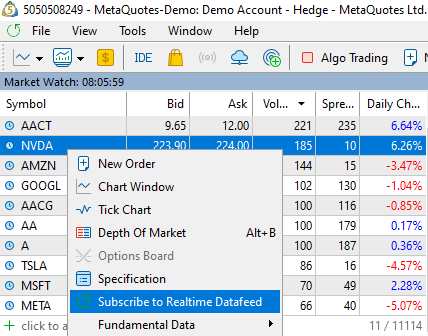
Fig. 2 - Screenshot showing the Market Watch context menu for real-time data feed subscription
Get the most liquid stocksWe started getting the 30 most liquid NASDAQ stocks. Unsurprisingly, they are those led by megacap technology leaders. There are only temporary changes in this list, depending on the day you look for them.
According to MetaTrader5 documentation, the volume shown in the Market Watch window is the volume of the last executed deal.

Fig. 3 - Screenshot showing the Market Watch window with the top 30 high-liquidity stocks sorted by volume
Run an optimization on Strategy TesterThen we ran a Strategy Tester optimization to rank the top 30 stocks by Sharpe ratio.
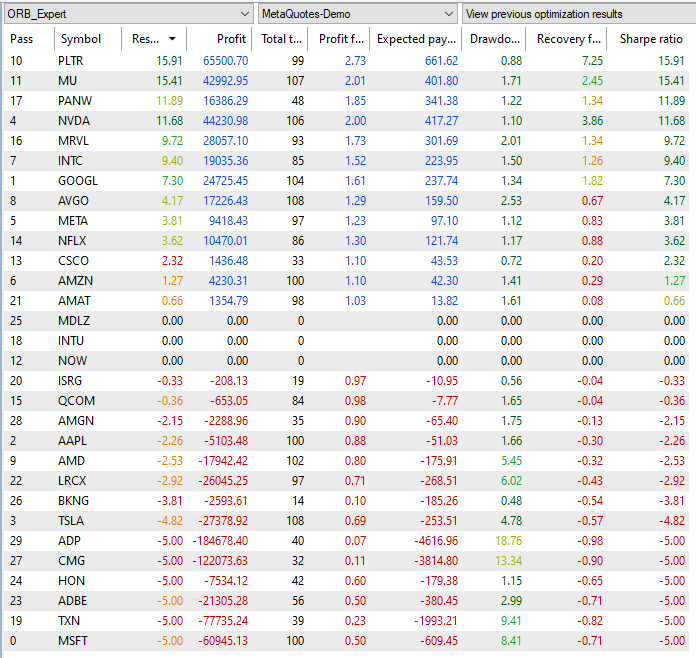
Fig. 4 - Screenshot with the MetaTrader 5 Strategy Test optimization results
I would like to draw your attention to the drawdown column. Note how it is controlled most of the time. This is arguably the ORB system’s most notable feature.
Also, note that there are three symbols with zero trades (MDLZ, INTU, NOW). They should be those that were not eligible to trade, according to the system rules (not enough volatility, price, or volume).
The Excel report of this optimization is part of the article’s attachments.
Run a single test on the top Sharpe ratioSingle test with the same settings used in the optimization above.
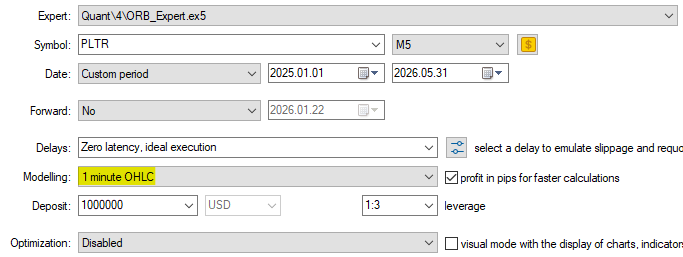
Fig. 5 - Screenshot showing the backtest settings for a single test on PLTR
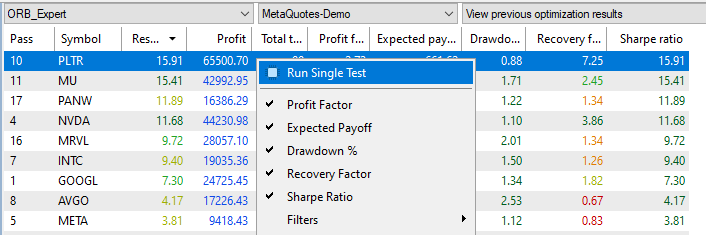
Fig. 6 - Screenshot showing the Strategy Tester contextual menu for running single tests after optimization
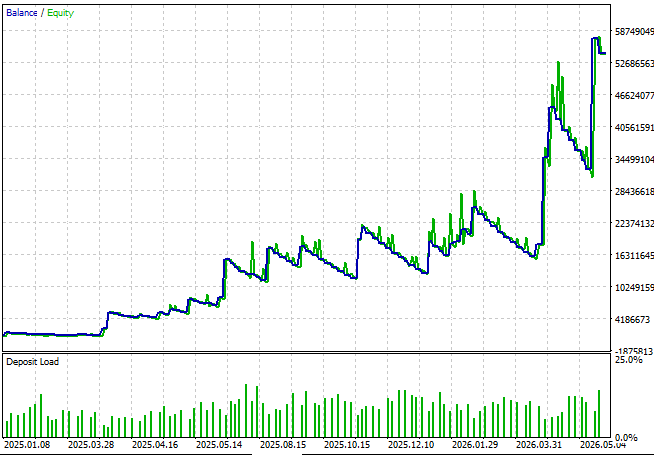
Fig. 7 - Screenshot showing the equity graph for the PLTR single test
Again, note the bounded drawdown. This is the intended main feature of this system.
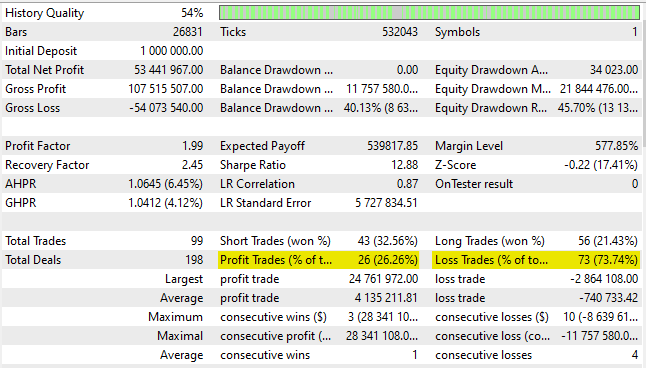
Fig. 8 - Screenshot showing stats for the PLTR single test
Note the low data quality reported. If you run this backtest on "Every tick", it will fail.
'History Quality — this value characterizes the quality of price data used for testing. It is determined as a percentage ratio of correct and incorrect one-minute data. Bars with a volume equal to 1 with different OHLC values are considered incorrect. Historical gaps are also considered incorrect data. Depending on size, the period of testing is divided into 1 — 199 intervals. The history quality is determined for each of them separately. The time intervals are shown in different colors on the graphical indicator of the history quality (the lighter tint of green means the better quality, the red color represents intervals with a quality lower than 50%).' (MetaTrader 5 Documentation)
The Sharpe Ratio should be taken with a grain of salt in the Tester, because in the Tester, the Risk-Free Rate is assumed to be zero.
'Sharpe Ratio — a classic measure that is commonly used to evaluate the performance of a portfolio manager, fund results, or a trading system. The ratio is calculated as (Return – Risk-Free Rate)/Standard Deviation of Return. In the strategy tester, the Risk-Free Rate is assumed to be zero.' (MetaTrader 5 Documentation)
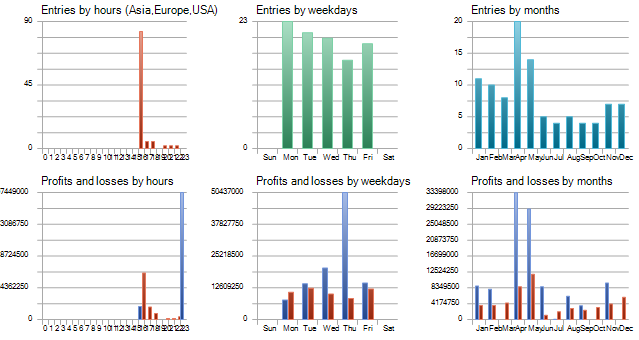
Fig. 9 - Screenshot showing entry times for PLTR single test
As expected, our entries are concentrated in the first hours of the USA trading session, although some limit orders may take time to be triggered. They are distributed equally throughout the week, but the profits peak in April and May, and on Thursdays. This is information that may be worth further analysis. Would it be a consistent pattern in related symbols?
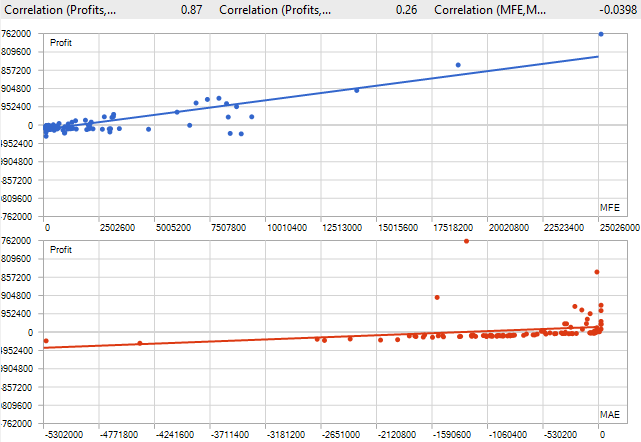
Fig. 10 - Screenshot showing MFE and MAE correlations for PLTR single test
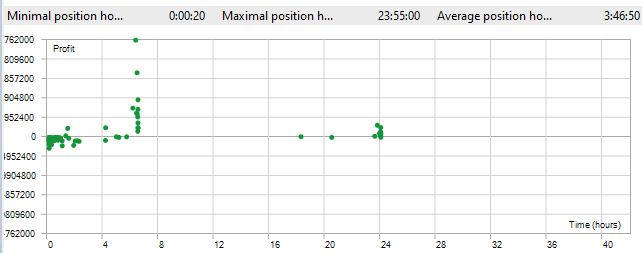
Fig. 11 - Screenshot showing position holding times for PLTR single test
The 20-second minimal position holding time reflects our tight stop-loss, while the maximal position holding time does not go beyond 24 hours, meaning our safety net mentioned above is working well on the backtest for some positions not closed intraday as expected.
Note that the average position holding time should be a bit distorted by these ‘leftovers’ not closed intraday.
Run some single tests with a forward periodSingle test with a 1/4 forward period.
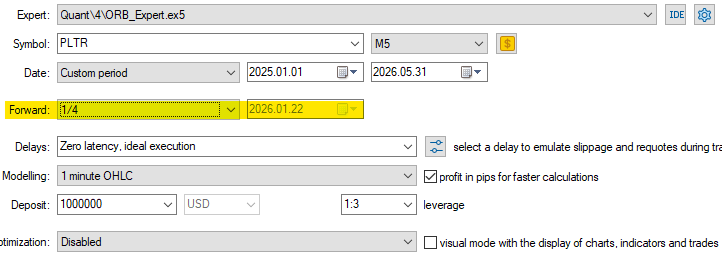
Fig. 12 - Screenshot showing the backtest with a forward sample for the PLTR single test
With the forward, we have this graph.
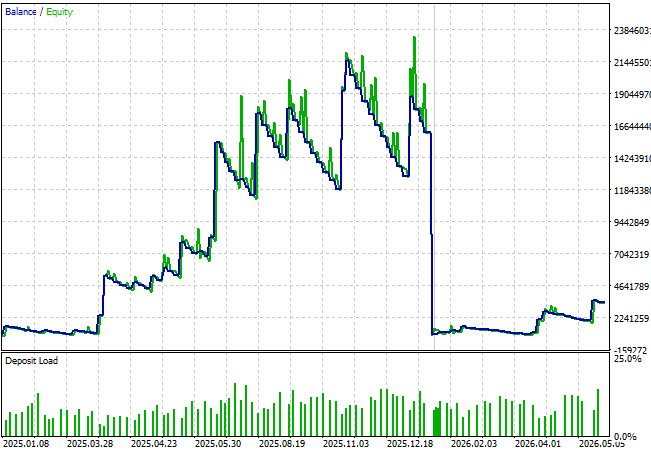
Fig. 13 - Screenshot showing the equity graph for the PLTR single test with forward sample
If you repeat this single-test/single-test-forward process with the other symbols included in the first screening, you will see similar results.
The main EA file
ORB_Expert.mq5
//+------------------------------------------------------------------+
//|                                                   ORB_Expert.mq5 |
//|                                  Copyright 2026, MetaQuotes Ltd. |
//|                                                     www.mql5.com |
//+------------------------------------------------------------------+
#property copyright "Copyright 2026, MetaQuotes Ltd"
#property link      "https://www.mql5.com"
#property version    "1.10"

#include <Trade\Trade.mqh>
#include "ORBMath.mqh"

//--- Input Parameters
input ENUM_TIMEFRAMES InpORTimeframe      = PERIOD_M5;     // Opening Range Timeframe
input int             InpMaxSymbols       = 20;            // Max Top Symbols to trade
input double          InpPriceThreshold   = 5.0;           // Min Price
input long            InpMinVolume        = 1000000;       // Min 14-day Avg Volume
input double          InpMinATR           = 0.5;           // Min 14-day ATR
input double          InpRelVolThreshold  = 100.0;         // Min Relative Volume %
input double          InpRiskPercent      = 1.0;           // Risk per trade %
input double          InpMaxLeverage      = 4.0;           // Max Leverage
input int             InpServerUTCOffset  = 2;             // Broker Server UTC Offset (2 for GMT+2)
input string          InpMarketOpenET     = "09:30";       // Market Open (ET)
input string          InpMarketCloseET    = "16:00";       // Market Close (ET)


//--- Global Variables
CTrade      m_trade;
datetime    m_session_start_server;
datetime    m_or_end_server;
datetime    m_session_end_server;
bool        m_trades_placed = false;
bool        m_session_closed = false;
int         m_current_day = -1;

struct SymbolRelVol
  {
   string            name;
   double            relVol;
   ENUM_BIAS         bias;
   double            orHigh;
   double            orLow;
   double            atr14;
  };
//+------------------------------------------------------------------+
//| Get Server Time offset to Eastern Time (ET)                      |
//+------------------------------------------------------------------+
int GetETOffset(datetime time)
  {
   MqlDateTime dt;
   TimeToStruct(time, dt);
   bool isDST = false;
   if(dt.mon > 3 && dt.mon < 11)
      isDST = true;
   else
      if(dt.mon == 3)
        {
         int secondSunday = 14 - ((dt.year * 5 / 4 + 1) % 7);
         if(dt.day > secondSunday)
            isDST = true;
        }
      else
         if(dt.mon == 11)
           {
            int firstSunday = 7 - ((dt.year * 5 / 4 + 1) % 7);
            if(dt.day < firstSunday)
               isDST = true;
           }
   int brokerCurrentUTC = InpServerUTCOffset + (isDST ? 1 : 0);
   int etCurrentUTC = (isDST ? -4 : -5);
   return brokerCurrentUTC - etCurrentUTC;
  }
//+------------------------------------------------------------------+
//| Convert ET HH:MM to Server Time for a specific date              |
//+------------------------------------------------------------------+
datetime ETToServer(string etTimeStr, datetime date)
  {
   int offset = GetETOffset(date);
   datetime base = StringToTime(TimeToString(date, TIME_DATE) + " " + etTimeStr);
   return base + offset * 3600;
  }
//+------------------------------------------------------------------+
//| Expert initialization function                                   |
//+------------------------------------------------------------------+
int OnInit()
  {
   m_trade.SetExpertMagicNumber(123456);
   EventSetTimer(1);
   Print("ORB Expert initialized. Version 1.10. DST Automation Active.");
   return(INIT_SUCCEEDED);
  }
//+------------------------------------------------------------------+
//| Expert deinitialization function                                 |
//+------------------------------------------------------------------+
void OnDeinit(const int reason)
  {
   EventKillTimer();
  }
//+------------------------------------------------------------------+
//| Timer function                                                   |
//+------------------------------------------------------------------+
void OnTimer()
  {
   datetime now = TimeCurrent();
   MqlDateTime dt;
   TimeToStruct(now, dt);
//--- Reset session flags on new day
   if(dt.day != m_current_day)
     {
      //--- SAFETY: Close anything left from yesterday before starting new day
      if(m_current_day != -1)
         CloseAll();
      m_current_day = dt.day;
      m_trades_placed = false;
      m_session_closed = false;
      m_session_start_server = ETToServer(InpMarketOpenET, now);
      m_session_end_server = ETToServer(InpMarketCloseET, now);
      m_or_end_server = m_session_start_server + PeriodSeconds(InpORTimeframe);
      Print("--- NEW TRADING DAY: ", TimeToString(now, TIME_DATE), " ---");
     }
//--- 1. End of Opening Range: Scan and Trade
   if(now >= m_or_end_server && now < m_session_end_server && !m_trades_placed)
     {
      ScanAndPlaceTrades();
      m_trades_placed = true;
     }
//--- 2. Market Close: Global Exit
   if(now >= m_session_end_server && !m_session_closed)
     {
      CloseAll();
      m_session_closed = true;
     }
  }
//+------------------------------------------------------------------+
//| Scan symbols and place trades                                   |
//+------------------------------------------------------------------+
void ScanAndPlaceTrades()
  {
   int total = SymbolsTotal(true);
   SymbolRelVol results[];
   int count = 0;
   for(int i = 0; i < total; i++)
     {
      string symbol = SymbolName(i, true);
      MqlRates ratesD1[];
      //--- Fetch 15 bars to calculate 14 True Range values (starting from yesterday)
      if(CopyRates(symbol, PERIOD_D1, 1, 15, ratesD1) < 15)
         continue;
      double avgVol14 = 0;
      //--- Index 14 is the most recent (yesterday)
      for(int j = 1; j < 15; j++)
         avgVol14 += (double)ratesD1[j].real_volume;
      avgVol14 /= 14.0;
      double price = SymbolInfoDouble(symbol, SYMBOL_BID);
      double trSum = 0;
      //--- Index 0 is D-15, Index 14 is D-1 (newest).
      for(int j = 1; j < 15; j++)
         trSum += MathMax(ratesD1[j].high - ratesD1[j].low, MathMax(MathAbs(ratesD1[j].high - ratesD1[j - 1].close), MathAbs(ratesD1[j].low - ratesD1[j - 1].close)));
      double atr14 = trSum / 14.0;
      if(!IsEligible(price, avgVol14, atr14, InpPriceThreshold, InpMinVolume, InpMinATR))
         continue;
      MqlRates ratesOR[];
      if(CopyRates(symbol, InpORTimeframe, m_session_start_server, m_or_end_server, ratesOR) < 1)
         continue;
      long histORVols[];
      ArrayResize(histORVols, 14);
      int foundHist = 0;
      datetime now = TimeCurrent();
      for(int d = 1; d <= 30 && foundHist < 14; d++)
        {
         datetime targetDate = now - d * 86400;
         datetime histStart = ETToServer(InpMarketOpenET, targetDate);
         datetime histEnd = histStart + PeriodSeconds(InpORTimeframe);
         MqlRates r[];
         if(CopyRates(symbol, InpORTimeframe, histStart, histEnd, r) > 0)
            histORVols[foundHist++] = r[0].real_volume;
        }
      if(foundHist < 14)
         continue;
      ArrayResize(histORVols, foundHist);
      double relVol = CalculateRelVol(ratesOR[0].real_volume, histORVols);
      if(relVol < InpRelVolThreshold)
         continue;
      ArrayResize(results, count + 1);
      results[count].name = symbol;
      results[count].relVol = relVol;
      results[count].bias = GetOpeningBias(ratesOR[0].open, ratesOR[0].close);
      results[count].orHigh = ratesOR[0].high;
      results[count].orLow = ratesOR[0].low;
      results[count].atr14 = atr14;
      count++;
     }
   SortResults(results);
   int toTrade = MathMin(count, InpMaxSymbols);
   for(int i = 0; i < toTrade; i++)
      ExecuteORBTrade(results[i]);
  }
//+------------------------------------------------------------------+
//| Execute Trade for a symbol                                       |
//+------------------------------------------------------------------+
void ExecuteORBTrade(SymbolRelVol &res)
  {
   if(res.bias == BIAS_NEUTRAL)
      return;
   double entry = (res.bias == BIAS_BULLISH) ? res.orHigh : res.orLow;
   double slDist = 0.1 * res.atr14;
   double sl = (res.bias == BIAS_BULLISH) ? entry - slDist : entry + slDist;
   double stopLossPoints = MathAbs(entry - sl) / SymbolInfoDouble(res.name, SYMBOL_POINT);
//--- Split risk across symbols: Pass the fractional risk directly to CalculateLots
   double splitRisk = InpRiskPercent / (double)InpMaxSymbols;
   double lots = CalculateLots(res.name, AccountInfoDouble(ACCOUNT_EQUITY), splitRisk, stopLossPoints, InpMaxLeverage);
   if(lots <= 0)
      return;
   double ask = SymbolInfoDouble(res.name, SYMBOL_ASK);
   double bid = SymbolInfoDouble(res.name, SYMBOL_BID);
//--- Use Market orders if price is already past the level
   if(res.bias == BIAS_BULLISH)
     {
      if(ask >= entry)
         m_trade.Buy(lots, res.name, ask, sl, 0, "ORB Market Entry");
      else
         m_trade.BuyStop(lots, entry, res.name, sl, 0, ORDER_TIME_GTC);
     }
   else
     {
      if(bid <= entry)
         m_trade.Sell(lots, res.name, bid, sl, 0, "ORB Market Entry");
      else
         m_trade.SellStop(lots, entry, res.name, sl, 0, ORDER_TIME_GTC);
     }
   Print("ORB Order placed for ", res.name, " Lots: ", lots, " RelVol: ", res.relVol);
  }
//+------------------------------------------------------------------+
//| Sort Results Descending by RelVol                               |
//+------------------------------------------------------------------+
void SortResults(SymbolRelVol &arr[])
  {
   int n = ArraySize(arr);
   for(int i = 0; i < n - 1; i++)
      for(int j = i + 1; j < n; j++)
         if(arr[i].relVol < arr[j].relVol)
           { SymbolRelVol temp = arr[i]; arr[i] = arr[j]; arr[j] = temp; }
  }
//+------------------------------------------------------------------+
//| Close all positions and orders                                  |
//+------------------------------------------------------------------+
void CloseAll()
  {
   Print("ORB: Global Close at ", TimeToString(TimeCurrent()));
// 1. Close Positions
   for(int i = PositionsTotal() - 1; i >= 0; i--)
     {
      ulong ticket = PositionGetTicket(i);
      if(PositionSelectByTicket(ticket) && PositionGetInteger(POSITION_MAGIC) == 123456)
        {
         string sym = PositionGetString(POSITION_SYMBOL);
         if(!m_trade.PositionClose(ticket))
            Print("FAILED close ", sym, " Error: ", GetLastError());
         else
            Print("Closed position for ", sym);
        }
     }
//--- 2. Delete Pending Orders
   for(int i = OrdersTotal() - 1; i >= 0; i--)
     {
      ulong ticket = OrderGetTicket(i);
      if(OrderSelect(ticket) && OrderGetInteger(ORDER_MAGIC) == 123456)
        {
         string sym = OrderGetString(ORDER_SYMBOL);
         if(!m_trade.OrderDelete(ticket))
            Print("FAILED delete order ", sym, " Error: ", GetLastError());
         else
            Print("Deleted pending order for ", sym);
        }
     }
  }
//+------------------------------------------------------------------+
Conclusion
While in the third part of this series, we described the implementation of a relatively complex swing trade system based on relative prices, the Opening Range Breakout (ORB) presented in this article is a very simple intraday system based on relative volume. It is based on a fundamental economic principle of stock markets: corporate news may generate unusual trading volume in related tickers/symbols, leading to an imbalance in institutional supply and demand, which in turn generates exploitable trends.
The system presents no novelty and zero complexity. Instead, it is a very simple, well-known system that has been studied for a long time in academic and commercial environments. It has been extensively tested by professional traders and researchers with proven results, including the most recent research by the Swiss Finance Institute in 2023-2024. It is designed to capture institutional supply/demand imbalances during early price discovery in US equities. It does so by comparing the first five minutes' relative volume with the 14-day average.
It is a good example of a profitable trading system with a win rate below 30%, due to a highly favourable risk-reward ratio. Although it requires robust capital to start, its institutional-grade drawdowns, simplicity, and robustness offer valuable learning opportunities.
References
Zarattini, Carlo, et al. “A Profitable Day Trading Strategy for The U.S. Equity Market.” Swiss Finance Institute Research Paper Series, no. 24-98, 16 Feb. 2024
| Filename | Description |
|---|---|
| Experts/ORB/ORB_Expert.mq5 | MQL5 Expert Advisor |
| Experts/ORB/ORBMath.mqh | MQL5 header |
| optimization_settings.ini | Backtest optimization settings |
| backtest_settings_PLTR_.ini | Backtest single test settings |
| ReportOptimizer-5050508249.xml | Excel report for the optimization step |
Warning: All rights to these materials are reserved by MetaQuotes Ltd. Copying or reprinting of these materials in whole or in part is prohibited.
This article was written by a user of the site and reflects their personal views. MetaQuotes Ltd is not responsible for the accuracy of the information presented, nor for any consequences resulting from the use of the solutions, strategies or recommendations described.

 CSV Data Analysis (Part 6): Multi-Broker Result Normalization and Cross-Platform CSV Reconciliation
 Automating Classic Market Methods in MQL5 (Part 3): Stan Weinstein Stage Analysis
 Building Automated Daily Trading Reports with the SendMail Function
 Feature Engineering for ML (Part 10): Structural Break Tests in MQL5

- Free trading apps
- Over 8,000 signals for copying
- Economic news for exploring financial markets
You agree to website policy and terms of use
maybe a STDV and ATR would make the EA profitable
I liked the article. I used AI to improve the code (attached). The claim that "the draw down are small," is not present in my tests though.
Nice! I'll check it this weekend or next week.
Could you publish your tests here?