

Building a Megaphone Pattern Indicator in MQL5
 2 661
2 661
 0
0

Introduction
Although MetaTrader 5 provides basic tools for manual chart analysis, it does not offer an automated solution for identifying and validating expanding formations like the megaphone pattern. As a result, traders are forced to analyze swing structures manually, create widening trend lines, and track breakout behavior continuously, which can reduce efficiency and introduce inconsistency into the analysis process. In this article, we will build a custom megaphone pattern indicator in MQL5 capable of automatically detecting bullish and bearish expanding structures directly on the chart. The implementation will cover swing detection, structure refinement, trend line validation, breakout confirmation, and stop loss and take profit projection.
Project Overview and Implementation Plan
Before implementing this in MQL5, it is important to clearly define what we are building. The development process becomes considerably more intentional and seamless when the outcome is clearly understood from the beginning. It also makes it easier to follow the logic and understand how each component of the indicator connects throughout the implementation process. In this chapter, we will focus on the project overview and discuss the step-by-step implementation plan.
What We Are Building
In this project, we are building an indicator that detects the megaphone pattern, also known as a broadening formation. It is called a megaphone pattern because the structure visually resembles a loudspeaker or megaphone on the chart, where price action becomes increasingly wide as the market progresses.
When price swings grow more aggressive and result in greater gaps between successive swing highs and swing lows, the megaphone pattern emerges. The broadening structure that gives the pattern its name is created as a result of the trend line boundaries progressively moving wider apart due to this expansion. With neither a bullish nor bearish trend establishing steady dominance, this increasing behavior frequently indicates increased uncertainty in the direction of the market.
Four crucial swing points are used in the creation of the structure. We first spot a swing high and then a swing low in a bullish megaphone pattern.
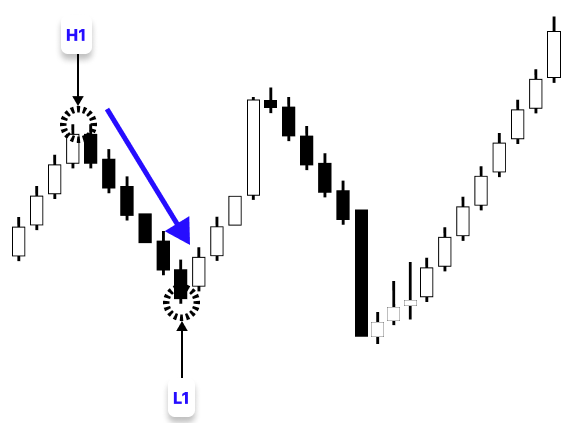
To validate upward growth, we then search for a second swing high that is higher than the previous swing high, and a swing low that is lower than the first swing low at the end of the series confirms downward expansion.
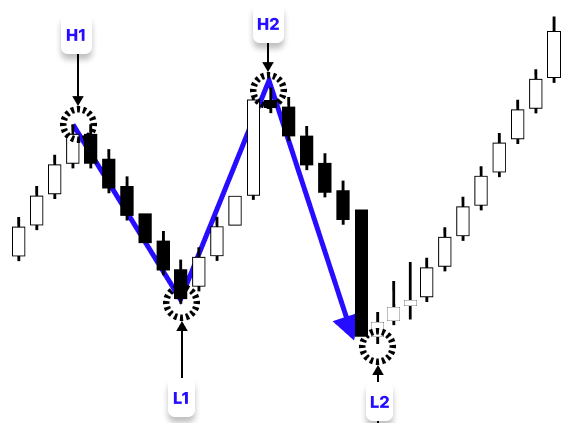
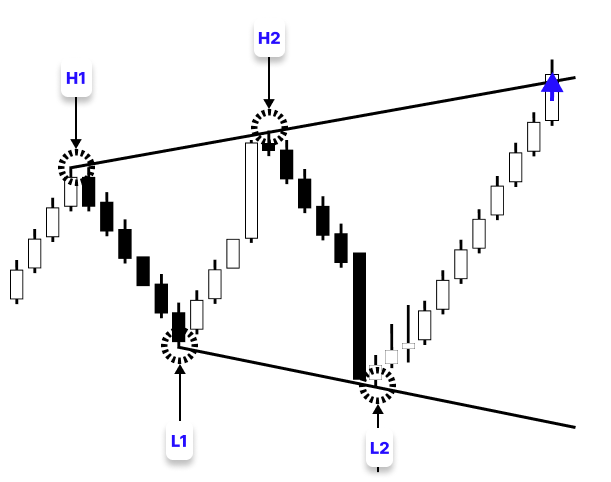
Along with this structure, we also impose a proportionate distance requirement, which states that the range between the second swing high and the second swing low cannot grow significantly in comparison to the original range between the first swing high and the swing low. A broader range is expected, but it must not exceed a predefined threshold (e.g., 150% of the original range). This preserves pattern validity and prevents distortion. The entire bullish megaphone pattern is formed by this alternating structure of higher highs and lower lows, with the trend lines getting wider with each consecutive swing.
The series has the same structural logic in a bearish megaphone pattern; however, it first shows downward expansion. A swing low comes first, then a swing high. Next, we validate deeper downside extension by finding a second swing low that is lower than the initial swing low. Stronger upside rejection is confirmed by the final swing's swing high, which is higher than the first swing high.
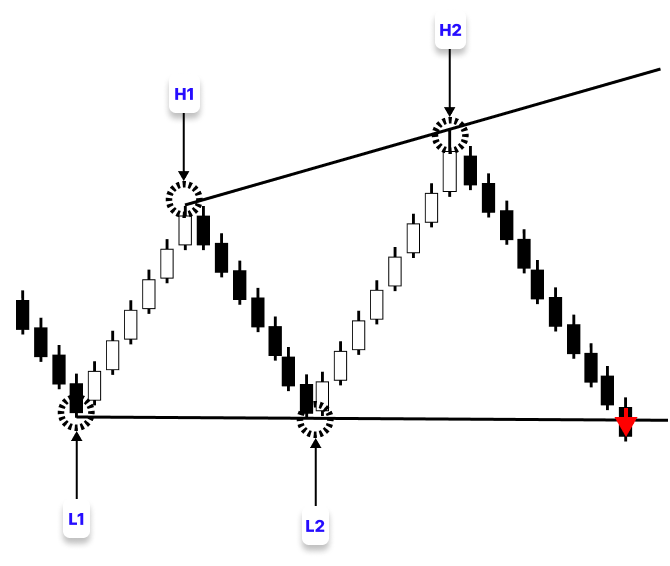
To maintain the structure's validity and balance, the range between the second swing high and low must not surpass a predetermined percentage of the initial swing range. This is where the same proportional rule also applies. The bearish variant of the pattern is produced by this alternating creation of lower lows and higher highs; as the structure develops, expanding trend lines move farther apart.
Our indicator will automatically identify these swing structures, validate the formation conditions, draw the expanding trend lines, and monitor the market for potential breakout opportunities.
Note: To avoid repetition, we will focus on explaining the detection process for the bullish megaphone pattern, since the bearish pattern follows a very similar logic.
Implementation Plan
In this section, we will outline the step-by-step process we will follow to implement the megaphone pattern detection system in MQL5. This section provides a roadmap from raw price data to swing points, validated structures, and a working pattern-recognition indicator with charted trend lines and signals.
Identifying Swing Points:
In this first step, we focus on identifying valid swing highs and swing lows from historical price data, because these points form the foundation of the entire pattern detection process. Without correctly isolating real market turning points, it becomes impossible to build a reliable structure or validate any meaningful formation. This is accomplished by scanning through a predetermined lookback range of candles, which establishes the amount of historical price data that the indicator will consider when looking for legitimate structures. For instance, the algorithm will just examine the last 100 candles on the chart rather than analyzing the complete price history if the lookback parameter is set to 100.
We employ a swing validation logic with a fixed confirmation depth within this scanning range. For example, if this depth is set to 3, a swing high is only deemed legitimate if the high of the current candle exceeds the highs of the three candles that came before and after it. In a similar vein, a swing low is verified when the low of the candle is lower than the lows of the three candles on either side. Smaller price swings are filtered out, ensuring that only significant and powerful market turning points are recorded.
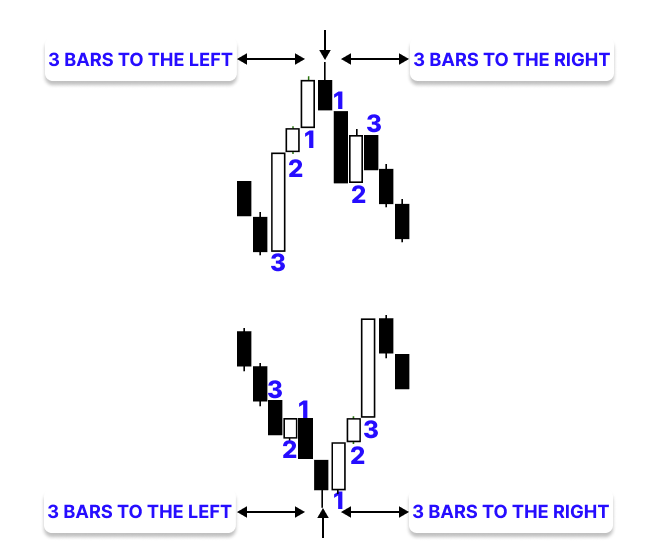
The process moves through the selected historical window in a structured manner, evaluating each candle sequentially to detect these confirmed swing points. Once a valid swing is identified, it is stored as a reference point using its price and timestamp so it can be used later in building the full market structure. To improve efficiency, the detection runs only once per completed candle. This ensures that the analysis is only performed when a new bar is confirmed, keeping the system stable, efficient, and aligned with real market structure formation.
Refining Swing Points to True Extremes:
Refining these points to reflect the actual extreme values within each swing leg comes after determining the first swing highs and swing lows. This is significant because, although the initial swing points are determined by confirmation logic, they might not always represent the movement's highest high or lowest low.
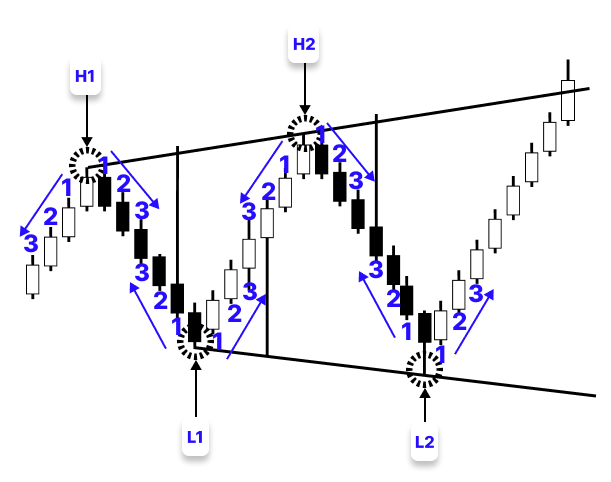
To improve accuracy, we examine the full range of price movement between each swing segment. Instead of relying only on the initial swing candle, we search within the entire leg of price action between two confirmed swing points to locate the actual extreme value. This means finding the highest high or lowest low that truly represents the peak or trough of that movement.
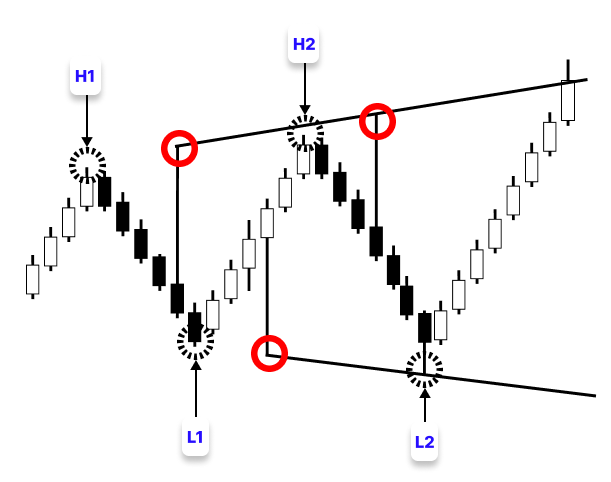
For example, once a swing high is detected, we look forward within the next swing leg to determine if there is a higher high that better represents the true peak of that structure. The same logic applies to swing lows, where we identify the lowest point within the relevant segment of price movement. In a bullish megaphone pattern, the final swing low remains fixed as the last confirmed boundary. Starting from this point, we refine the previous swings step by step to obtain the true market extremes. First, between the second swing high and the second swing low, we search for the highest price within that entire swing leg and replace the original second swing high with this refined extreme.
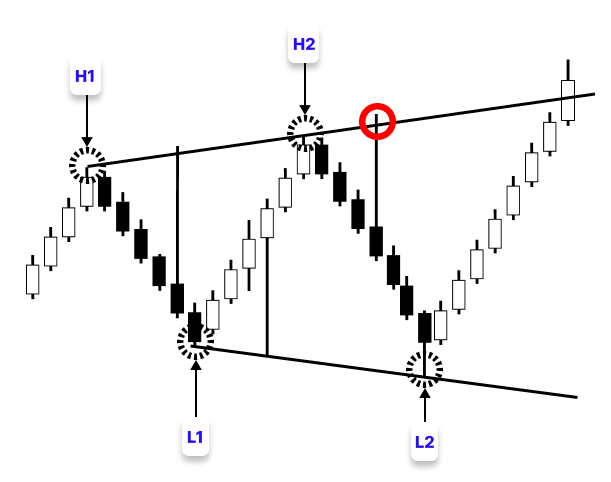
Next, between the first swing low and the newly refined second swing high, we search for the lowest price and replace the original first swing low with this new extreme.
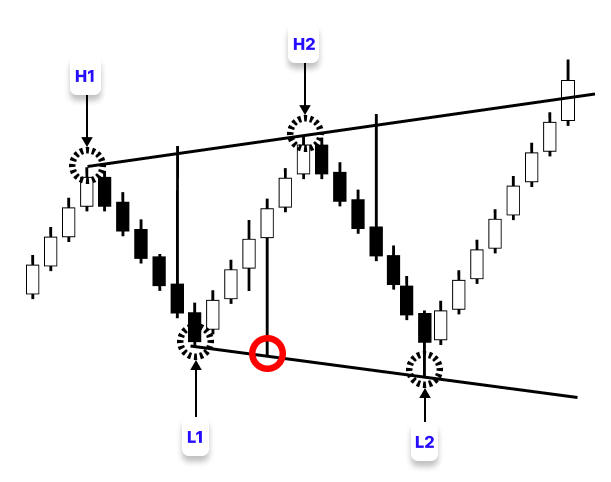
Lastly, we look for the highest price once more and use it as the new refined first swing high between the first swing high and the refined first swing low.
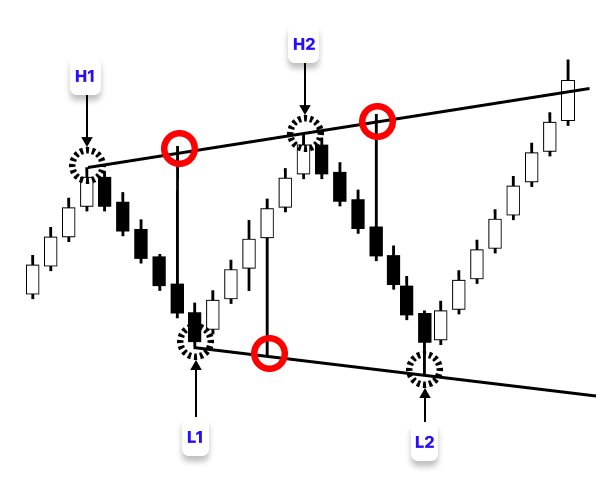
A more precise and structurally sound pattern is produced as a result of this successive refinement process, which guarantees that each swing anchor reflects the actual extreme of its corresponding market leg.
Validating Trend Line Integrity:
After refining the swing points, the next step is to validate the integrity of the megaphone structure using the trend line boundaries formed by the swing anchors. At this stage, only structures with properly respected and diverging trend lines are considered valid.
The first and second swing highs form the top boundary of a bullish structure, while the first and second swing lows define the bottom boundary. We look for candles that have crossed and closed above the upper trend line between the first and second swing highs during validation. The structure is deemed invalid since the boundary has already been crossed if such a close takes place at any time before the second swing high.
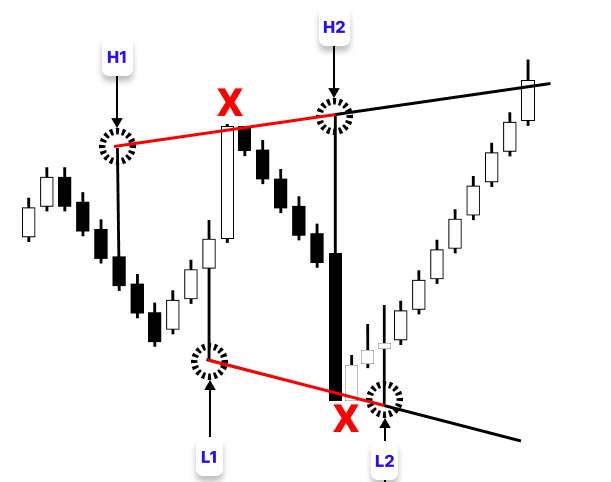
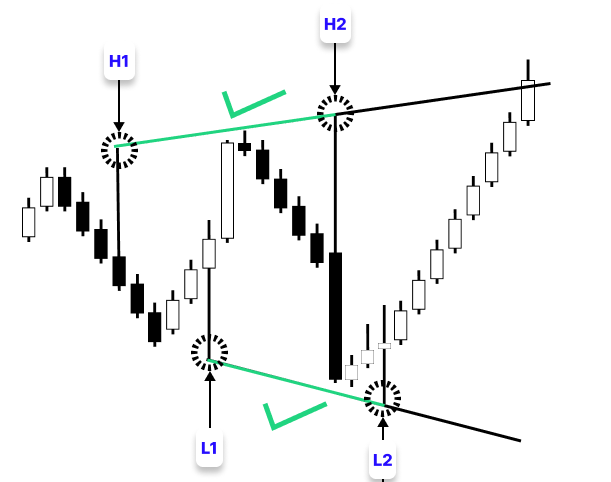
The same process is applied to the lower boundary. We check whether any candle between the first and second swing lows has crossed and closed below the lower trend line. If this occurs, the structure is rejected. We also apply a proportional expansion check to ensure that the second expansion leg does not become excessively larger than the initial structure. This helps filter out distorted formations and ensures that only balanced and structurally valid megaphone patterns proceed to the breakout confirmation stage.
Structural Breakout Confirmation:
After validating the megaphone structure, the final step is to monitor the market for a confirmed breakout beyond the pattern boundary. At this stage, the structure is already considered valid, so the focus shifts toward detecting the actual breakout confirmation that will trigger the trading signal. For a bullish setup, price is continuously monitored after the fourth swing point forms. A breakout is confirmed only when a candle closes above the upper trend line connecting the swing highs.
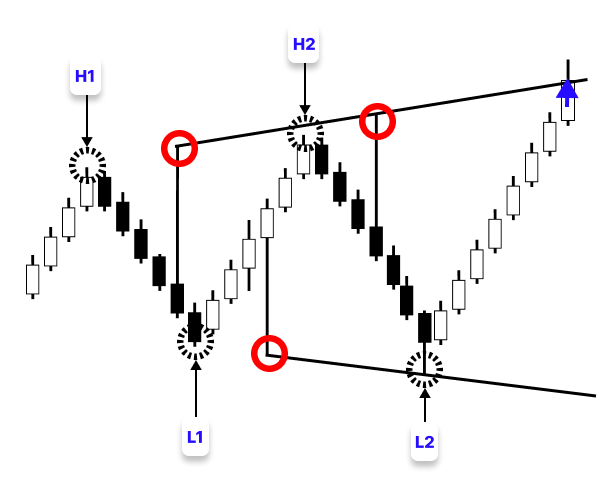
However, before accepting the breakout, we perform an additional integrity check on the lower boundary to ensure that no candle has previously closed below the lower trend line during the breakout development phase. If the lower boundary has already been violated, the structure becomes invalid.
Stop Loss and Take Profit Placement:
After a valid breakout has been confirmed, the final step is to define the trade management levels, which include the stop loss and take profit. These levels are derived directly from the structure of the megaphone pattern, ensuring that risk and reward are based on actual market geometry rather than arbitrary values. The stop loss is calculated using the distance between the two trend lines at the breakout region. Specifically, it is positioned at the midpoint of the structure’s vertical range, providing a balanced risk buffer between both boundaries. This ensures that the trade is protected while still respecting the natural structure of the pattern.
The take profit is projected using the same structural range but extended beyond the breakout point. This projection is based on the distance between the trend line boundaries, effectively mirroring the height of the structure to estimate a realistic price target. To make these levels visually clear on the chart, both SL and TP are represented using chart objects. A horizontal line is drawn at each level, and a corresponding text label ("SL" and "TP") is added to mark their positions clearly. This allows traders to visually track risk and reward directly on the chart after a breakout signal is generated.
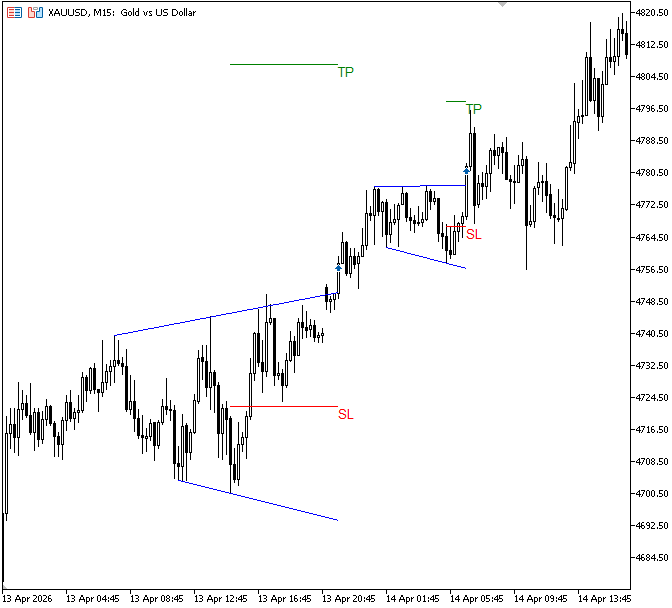
Note: This project discussed in the article is entirely project-based and intended to teach readers MQL5 through real-world, hands-on application. It is not a guaranteed method for making profits in live trading.
Implementation in MQL5
In this chapter, we will move from the theoretical design of the Megaphone Pattern detection system into its practical implementation in MQL5. Using the logic established in the previous sections, we will gradually build the indicator step by step, translating each component into working MQL5 functionality.
Identifying Swing Points
Just as discussed in the implementation plan, we will begin by identifying valid swing highs and swing lows, since they form the foundation of the entire megaphone pattern detection process.
Example:
#property indicator_chart_window
#property indicator_buffers 0
#property indicator_plots   0
#define OBJ_PREFIX      "MG_"  // Prefix for all chart objects

int look_back     = 300;              // number of candles to scan for pattern detection
int SwingLookback = 3;                // swing validation range (left and right candles)
int window_start;                     // starting index of scan window
datetime lastTradeBarTime = 0;        // ensures logic runs once per new bar

//--- Bullish Megaphone Pattern Swing Structure Variables (Pattern Anchors)
double s1_h;                         // first swing high price (S1)
datetime s1_h_t;                     // first swing high time
double s2_l;                         // first swing low price (S2)
datetime s2_l_t;                     // first swing low time
double s3_h;                         // second swing high price (S3)
datetime s3_h_t;                     // second swing high time
double s4_l;                         // second swing low price (S4)
datetime s4_l_t;                     // second swing low time

//+------------------------------------------------------------------+
//| Custom indicator initialization function                         |
//+------------------------------------------------------------------+
int OnInit()
  {
//--- indicator buffers mapping

//---
   return(INIT_SUCCEEDED);
  }
//+------------------------------------------------------------------+
//| Custom indicator iteration function                              |
//+------------------------------------------------------------------+
int OnCalculate(const int32_t rates_total,
                const int32_t prev_calculated,
                const datetime &time[],
                const double &open[],
                const double &high[],
                const double &low[],
                const double &close[],
                const long &tick_volume[],
                const long &volume[],
                const int32_t &spread[])
  {
//--- ensure enough history is available before processing
   if(rates_total < look_back)
      return 0;

   window_start = rates_total - look_back + SwingLookback; // define scanning window
   datetime currentBarTime = iTime(_Symbol, PERIOD_CURRENT, 0); // current candle time

//--- execute logic only once per new candle
   if(currentBarTime != lastTradeBarTime)
     {
      //--- loop through candles within lookback window
      for(int i = window_start; i < rates_total - SwingLookback - 2; i++)
        {
         //--- detect first swing high (S1)
         if(IsSwingHigh(high, i, SwingLookback))
           {
            s1_h = high[i];              // store S1 price
            s1_h_t = time[i];           // store S1 time

            //--- search for first swing low (S2)
            for(int j = i; j < rates_total - SwingLookback - 2; j++)
              {
               if(IsSwingLow(low, j, SwingLookback))
                 {
                  s2_l = low[j];        // store S2 price
                  s2_l_t = time[j];     // store S2 time

                  //--- search for second swing high (S3)
                  for(int k = j; k < rates_total - SwingLookback - 2; k++)
                    {
                     if(IsSwingHigh(high, k, SwingLookback) && high[k] > s1_h)
                       {
                        s3_h = high[k];       // store S3 price
                        s3_h_t = time[k];     // store S3 time

                        //--- search for second swing low (S4)
                        for(int l = k; l < rates_total - SwingLookback - 2; l++)
                          {
                           if(IsSwingLow(low, l, SwingLookback) && low[l] < s2_l)
                             {
                              s4_l = low[l];   // store S4 price
                              s4_l_t = time[l]; // store S4 time

                              break;
                             }
                          }
                        break;
                       }
                    }
                  break;
                 }
              }
           }
        }

      lastTradeBarTime = currentBarTime; // update last processed bar
     }

//--- return value of prev_calculated for next call
   return(rates_total);
  }
//+------------------------------------------------------------------+
//| FUNCTION FOR SWING LOW                                           |
//+------------------------------------------------------------------+
bool IsSwingLow(const double &low_price[], int index, int lookback)
  {
   for(int i = 1; i <= lookback; i++)
     {
      if(low_price[index] > low_price[index - i] || low_price[index] > low_price[index + i])
         return false;
     }
   return true;
  }
//+------------------------------------------------------------------+
//| FUNCTION FOR SWING HIGH                                          |
//+------------------------------------------------------------------+
bool IsSwingHigh(const double &high_price[], int index, int lookback)
  {
   for(int i = 1; i <= lookback; i++)
     {
      if(high_price[index] < high_price[index - i] || high_price[index] < high_price[index + i])
         return false;
     }
   return true;
  }
//+------------------------------------------------------------------+
Explanation:
To decide how many historical candles the indicator will examine when looking for a megaphone pattern, the process starts with the definition of a fixed lookback range. In this instance, the value restricts the scan to the last 300 candles, guaranteeing that the algorithm concentrates on pertinent market information while avoiding needless computation on past price history. The SwingLookback value is then used to introduce a swing validation depth. This regulates the number of candles on the left and right sides that are utilized to determine whether a candle is a swing high or swing low. While a higher value filters out noise and concentrates mainly on more important market turning points, a smaller value increases the system's sensitivity to small fluctuations.
The starting point of the scanning operation inside the lookback range is then specified using the window_start variable. This guarantees that the function doesn't begin too early in the dataset, when a lack of surrounding candles would make swing validation unreliable. It successfully establishes a secure limit for structured analysis. The logic is made to operate just once for every newly produced candle to guarantee efficiency. The most recent processed bar's time is stored in the lastTradeBarTime variable, which is used to regulate this.
The system avoids doing the entire detection process on each tick by comparing it with the current candle time, which helps preserve efficiency and eliminates repeated computations. The indicator starts looking through historical candles within the specified window after the execution criteria are satisfied. It searches price data sequentially for possible swing highs that could be the beginning of a bullish megaphone formation. The indicator records a valid swing high as S1, the beginning anchor point of the bullish megaphone structure. After that, it advances in quest of a legitimate swing low (S2) and a second swing high (S3). S3 must be greater than S1, indicating that the price is expanding rather than contracting, for the structure to continue to be legitimate.
The system searches for S4, a second swing low that must be lower than S2. The four-point structure needed for a bullish megaphone pattern is now complete. Every break statement guarantees that the search proceeds sequentially without overlapping or repeating structure detection once a legitimate swing point is identified. Throughout the process, dedicated swing validation functions are used to confirm whether a candle is truly a swing high or swing low.
A swing high is only accepted if its high is greater than the highs of surrounding candles within the defined lookback range, while a swing low must be lower than the lows of its neighboring candles. This ensures that only meaningful market turning points are used in building the pattern structure. To effectively perceive the structure we are working with on the chart, it is crucial that we start sketching the trend lines as part of the development process. This enables us to verify that swing points are accurately identified and that the pattern formation is consistent with the real structure of the market.
Example://--- Trendline Object Variables string line_s1_3; string line_s2_4; //+------------------------------------------------------------------+ //| Create or update a trendline | //| Returns true if a new object was created | //+------------------------------------------------------------------+ bool DrawTrend(const string name, datetime x1t, double x1, datetime x2t, double x2, color fillCol) { bool created = false; //--- Create object only if it does not exist if(ObjectFind(0, name) < 0) { ObjectCreate(0, name, OBJ_TREND, 0, x1t, x1, x2t, x2); //--- Set object properties ObjectSetInteger(0,name,OBJPROP_COLOR,fillCol); created = true; } return created; } //+------------------------------------------------------------------+ //| Custom indicator initialization function | //+------------------------------------------------------------------+ int OnInit() { //--- indicator buffers mapping //--- return(INIT_SUCCEEDED); } //+------------------------------------------------------------------+ //| OnDeinit - runs when indicator is removed | //+------------------------------------------------------------------+ void OnDeinit(const int reason) { ObjectsDeleteAll(0,OBJ_PREFIX); // delete all indicator's objects }
//+------------------------------------------------------------------+
//| Custom indicator iteration function                              |
//+------------------------------------------------------------------+
int OnCalculate(const int32_t rates_total,
                const int32_t prev_calculated,
                const datetime &time[],
                const double &open[],
                const double &high[],
                const double &low[],
                const double &close[],
                const long &tick_volume[],
                const long &volume[],
                const int32_t &spread[])
  {
//--- ensure enough history is available before processing
   if(rates_total < look_back)
      return 0;

   window_start = rates_total - look_back + SwingLookback; // define scanning window
   datetime currentBarTime = iTime(_Symbol, PERIOD_CURRENT, 0); // current candle time

   bool need_redraw = false;
//--- execute logic only once per new candle
   if(currentBarTime != lastTradeBarTime)
     {
      //--- loop through candles within lookback window
      for(int i = window_start; i < rates_total - SwingLookback - 2; i++)
        {
         //--- detect first swing high (S1)
         if(IsSwingHigh(high, i, SwingLookback))
           {
            s1_h = high[i];              // store S1 price
            s1_h_t = time[i];           // store S1 time

            //--- search for first swing low (S2)
            for(int j = i; j < rates_total - SwingLookback - 2; j++)
              {
               if(IsSwingLow(low, j, SwingLookback))
                 {
                  s2_l = low[j];        // store S2 price
                  s2_l_t = time[j];     // store S2 time

                  //--- search for second swing high (S3)
                  for(int k = j; k < rates_total - SwingLookback - 2; k++)
                    {
                     if(IsSwingHigh(high, k, SwingLookback) && high[k] > s1_h)
                       {
                        s3_h = high[k];       // store S3 price
                        s3_h_t = time[k];     // store S3 time

                        //--- search for second swing low (S4)
                        for(int l = k; l < rates_total - SwingLookback - 2; l++)
                          {
                           if(IsSwingLow(low, l, SwingLookback) && low[l] < s2_l)
                             {
                              s4_l = low[l];   // store S4 price
                              s4_l_t = time[l]; // store S4 time

                              line_s1_3 = OBJ_PREFIX + "Line S13" + TimeToString(time[i]) + TimeToString(time[k]);
                              if(DrawTrend(line_s1_3,s1_h_t,s1_h,s3_h_t,s3_h,clrBlue))
                                {
                                 need_redraw = true;
                                }

                              line_s2_4 = OBJ_PREFIX + "Line S24" + TimeToString(time[j]) + TimeToString(time[l]);
                              if(DrawTrend(line_s2_4,s2_l_t,s2_l,s4_l_t,s4_l,clrBlue))
                                {
                                 need_redraw = true;
                                }

                              break;
                             }
                          }
                        break;
                       }
                    }
                  break;
                 }
              }
           }
        }

      lastTradeBarTime = currentBarTime; // update last processed bar
     }

//--- Redraw only if something changed
   if(need_redraw)
      ChartRedraw(0);

//--- return value of prev_calculated for next call
   return(rates_total);
  }
Output:
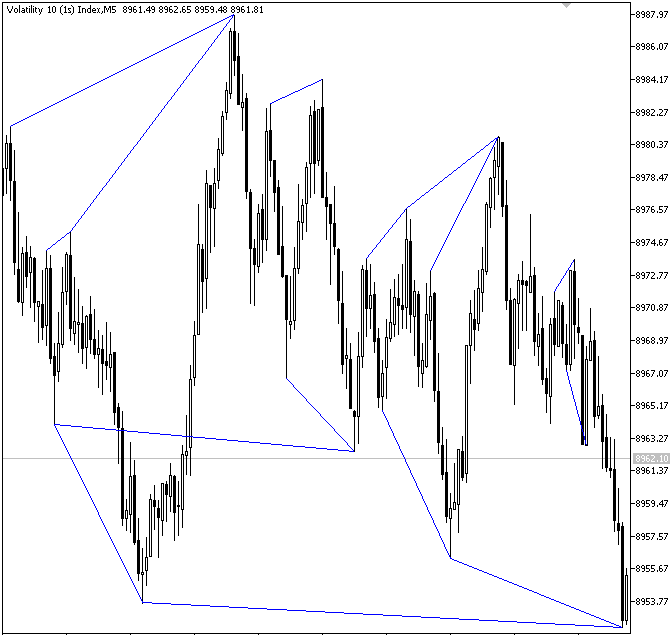
Explanation:
By creating the corresponding trend lines, the algorithm starts managing the bullish megaphone structure's visual depiction in this step. Two string variables, line_s1_3 and line_s2_4, are declared before the creation of any object to distinguish the upper and lower trend lines. Each megaphone structure is kept under independent control, and conflicts among chart objects are avoided by using distinct object names. The creation of the trend lines required to depict the bullish megaphone structure is the main duty of the DrawTrend function. It creates a chart trend line object by connecting two anchor points using their time and price coordinates.
To prevent continually drawing the same trend lines during indicator execution, the function first uses ObjectFind to look for an existing object with the same name to preserve clean object management. The core responsibility of the DrawTrend function is to create the trend lines used to represent the bullish megaphone structure. It works by linking two anchor points through their time and price coordinates to produce a chart trend line object. To maintain clean object management, the function first checks for an existing object with the same name using ObjectFind, which helps avoid repeatedly drawing identical trend lines during indicator execution.
To keep the chart tidy, the OnDeinit method is also included. All objects created by this system are erased using the shared prefix when the indicator is removed. After the indicator is unloaded, this keeps any remaining trend lines from clogging the chart. The first swing high (S1) and second swing high (S3) constitute the upper trend line in the primary logic, while the first swing low (S2) and second swing low (S4) form the lower trend line. To guarantee that every pattern found on the chart stays unique, each line is given a unique identity created from the object prefix and the swing timestamps. The need_redraw flag is set to true following each drawing operation that is successful. This indicates that an update is required since the chart's state has changed. Lastly, ChartRedraw(0) is called to refresh the chart and make the newly constructed structure instantly apparent when at least one new object has been created or altered.
Refining Swing Points to True Extremes
The next step focuses on refining the initially detected swing points to their true market extremes within each swing leg.
Example:
//--- S3 to S4 refinement (upper expansion leg)
int s3_s4_hbars;        // bars between S3 and S4 for extreme search
double s3_highest;      // highest price between S3 and S4
datetime s3_highest_t;  // time of highest price between S3 and S4
int s3_highest_index;   // index of highest price between S3 and S4

//--- S2 to S3 refinement (middle structure leg)
int s2_s3_lbars;        // bars between S2 and S3 for extreme search
double s2_lowest;       // lowest price between S2 and S3
datetime s2_lowest_t;   // time of lowest price between S2 and S3
int s2_lowest_index;    // index of lowest price between S2 and S3

//--- S1 to S2 refinement (initial structure leg)
int s1_s2_hbars;        // bars between S1 and S2 for extreme search
double s1_highest;      // highest price between S1 and S2
datetime s1_highest_t;  // time of highest price between S1 and S2
int s1_highest_index;   // index of highest price between S1 and S2
//--- search for second swing low (S4)
for(int l = k; l < rates_total - SwingLookback - 2; l++)
  {
   if(IsSwingLow(low, l, SwingLookback) && low[l] < s2_l)
     {
      s4_l = low[l];   // store S4 price
      s4_l_t = time[l]; // store S4 time

      //--- refine S3 by locating the true highest high between S3 and S4
      s3_s4_hbars = Bars(_Symbol, PERIOD_CURRENT, s3_h_t, s4_l_t); // total bars between S3 and S4
      s3_highest = high[ArrayMaximum(high, k, s3_s4_hbars)]; // highest price within S3 to S4 range
      s3_highest_t = time[ArrayMaximum(high, k, s3_s4_hbars)]; // time of refined S3 high
      s3_highest_index = ArrayMaximum(high, k, s3_s4_hbars); // index of refined S3 high

      //--- refine S2 by locating the true lowest low between S2 and refined S3
      s2_s3_lbars = Bars(_Symbol, PERIOD_CURRENT, s2_l_t, s3_highest_t); // total bars between S2 and refined S3
      s2_lowest_index = ArrayMinimum(low, j, s2_s3_lbars); // index of refined S2 low
      s2_lowest = low[s2_lowest_index]; // lowest price within S2 to S3 range
      s2_lowest_t = time[s2_lowest_index]; // time of refined S2 low

      //--- refine S1 by locating the true highest high between S1 and refined S2
      s1_s2_hbars = Bars(_Symbol, PERIOD_CURRENT, s1_h_t, s2_lowest_t); // total bars between S1 and refined S2
      s1_highest_index = ArrayMaximum(high, i, s1_s2_hbars); // index of refined S1 high
      s1_highest = high[s1_highest_index]; // highest price within S1 to S2 range
      s1_highest_t = time[s1_highest_index]; // time of refined S1 high

      //--- create trend line connecting first swing high (S1) and second swing high (S3)
      line_s1_3 = OBJ_PREFIX + "Line S13" + TimeToString(time[i]) + TimeToString(time[k]);

      //--- draw upper trend line of bullish megaphone structure (S1 to S3)
      if(DrawTrend(line_s1_3, s1_highest_t, s1_h, s3_highest_t, s3_highest, clrBlue))
        {
         need_redraw = true; // flag chart for update after successful drawing
        }

      //--- create trend line connecting first swing low (S2) and second swing low (S4)
      line_s2_4 = OBJ_PREFIX + "Line S24" + TimeToString(time[j]) + TimeToString(time[l]);

      //--- draw lower trend line of bullish megaphone structure (S2 to S4)
      if(DrawTrend(line_s2_4, s2_lowest_t, s2_lowest, s4_l_t, s4_l, clrBlue))
        {
         need_redraw = true; // flag chart for update after successful drawing
        }
      break;
     }
  }
Output:
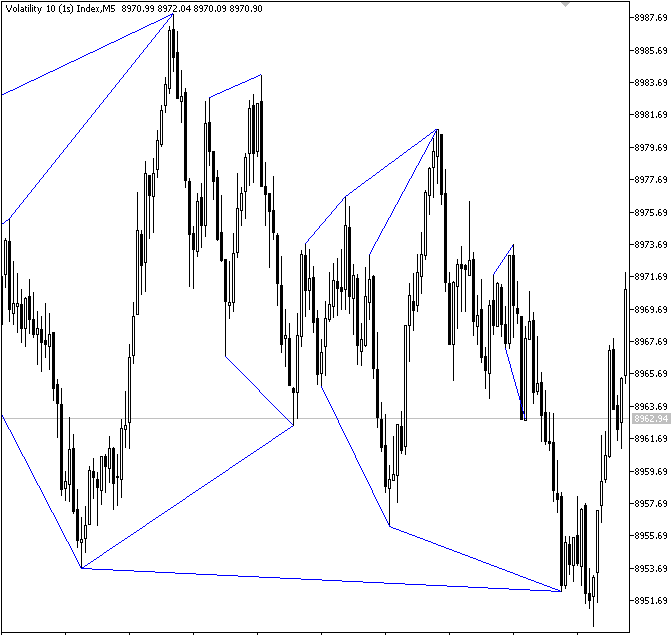
Explanation:
This section performs the refinement process discussed earlier by replacing the initially detected swing points with the true market extremes found within each swing leg. Instead of relying only on the first detected swing points, the algorithm scans inside each segment of the structure to locate the actual highest highs and lowest lows that better represent the bullish megaphone pattern. The second swing high (S3) is the first step in the procedure. First, the system uses the Bars() function to determine how many bars are between the identified S3 and S4 points. This indicates how many candles there are in that swing leg overall. The highest price is then found by searching through the high price array within that range using ArrayMaximum().
The index location of the actual highest point between S3 and S4 is represented by the returned value. Next, the algorithm uses this index to retain the exact index point, the refined highest price, and its timestamp. The refining then proceeds to the initial swing low (S2). After that, the system determines the number of candles between S2 and the recently refined S3 high after acquiring the refined S3 point. The low price array inside that region is then scanned using ArrayMinimum() to determine the actual lowest low. Once located, the algorithm saves the array index, timestamp, and refined low price. The final refinement stage updates the first swing high (S1). The algorithm now scans between the original S1 and the newly refined S2 low to locate the true highest high within that leg. Using ArrayMaximum(), it extracts the refined S1 index, then uses that position to retrieve the corresponding price and time values.
As a result of this refinement process, the trend line drawing logic is also updated. Instead of connecting the original swing points, the upper trend line now connects the refined S1 high and refined S3 high, while the lower trend line connects the refined S2 low and the existing S4 low. This produces a more accurate representation of the bullish megaphone structure because the trend lines are now anchored to the true market extremes rather than the initially detected swing points.
Validating Trend Line Integrity
The next step focuses on validating the integrity of the bullish megaphone trend lines to ensure that no candle closes improperly across the structure boundaries before breakout confirmation occurs.
Example://--- Trend line integrity validation variables bool is_line_s13_break; // tracks if any candle closed below upper trend line (S1 to S3) bool is_line_s24_break; // tracks if any candle closed above lower trend line (S2 to S4) double line_s13_value; // stores upper trend line price at a specific candle double line_s24_value; // stores lower trend line price at a specific candle //--- validation thresholds for structural integrity of bullish megaphone pattern double s1_2_limit; // maximum allowed expansion limit between S1 and S2 leg double s2_4_interval; // measured distance between S2 and S4 swing legs
//--- search for second swing low (S4)
for(int l = k; l < rates_total - SwingLookback - 2; l++)
  {
   if(IsSwingLow(low, l, SwingLookback) && low[l] < s2_l)
     {
      s4_l = low[l];   // store S4 price
      s4_l_t = time[l]; // store S4 time

      //--- refine S3 by locating the true highest high between S3 and S4
      s3_s4_hbars = Bars(_Symbol, PERIOD_CURRENT, s3_h_t, s4_l_t); // total bars between S3 and S4
      s3_highest = high[ArrayMaximum(high, k, s3_s4_hbars)]; // highest price within S3 to S4 range
      s3_highest_t = time[ArrayMaximum(high, k, s3_s4_hbars)]; // time of refined S3 high
      s3_highest_index = ArrayMaximum(high, k, s3_s4_hbars); // index of refined S3 high

      //--- refine S2 by locating the true lowest low between S2 and refined S3
      s2_s3_lbars = Bars(_Symbol, PERIOD_CURRENT, s2_l_t, s3_highest_t); // total bars between S2 and refined S3
      s2_lowest_index = ArrayMinimum(low, j, s2_s3_lbars); // index of refined S2 low
      s2_lowest = low[s2_lowest_index]; // lowest price within S2 to S3 range
      s2_lowest_t = time[s2_lowest_index]; // time of refined S2 low

      //--- refine S1 by locating the true highest high between S1 and refined S2
      s1_s2_hbars = Bars(_Symbol, PERIOD_CURRENT, s1_h_t, s2_lowest_t); // total bars between S1 and refined S2
      s1_highest_index = ArrayMaximum(high, i, s1_s2_hbars); // index of refined S1 high
      s1_highest = high[s1_highest_index]; // highest price within S1 to S2 range
      s1_highest_t = time[s1_highest_index]; // time of refined S1 high


      //--- create trend line connecting first swing high (S1) and second swing high (S3)
      line_s1_3 = OBJ_PREFIX + "Line S13" + TimeToString(time[i]) + TimeToString(time[k]);

      //--- draw upper trend line of bullish megaphone structure (S1 to S3)
      if(DrawTrend(line_s1_3, s1_highest_t, s1_h, s3_highest_t, s3_highest, clrBlue))
        {
         ObjectSetInteger(0, line_s1_3, OBJPROP_TIMEFRAMES, OBJ_NO_PERIODS);
         need_redraw = true; // flag chart for update after successful drawing
        }

      //--- create trend line connecting first swing low (S2) and second swing low (S4)
      line_s2_4 = OBJ_PREFIX + "Line S24" + TimeToString(time[j]) + TimeToString(time[l]);

      //--- draw lower trend line of bullish megaphone structure (S2 to S4)
      if(DrawTrend(line_s2_4, s2_lowest_t, s2_lowest, s4_l_t, s4_l, clrBlue))
        {
         ObjectSetInteger(0, line_s2_4, OBJPROP_TIMEFRAMES, OBJ_NO_PERIODS);
         need_redraw = true; // flag chart for update after successful drawing
        }

      //--- validate upper trend line integrity (S1 to S3)
      is_line_s13_break = false;

      //--- scan candles between refined S1 and refined S3
      for(int y = s1_highest_index; y <= s3_highest_index; y++)
        {
         // retrieve upper trend line price at current candle time
         line_s13_value = ObjectGetValueByTime(0, line_s1_3, time[y], 0);

         // check if candle closed above the upper trend line
         if(close[y] > line_s13_value)
           {
            is_line_s13_break = true; // invalidate structure if breakout occurs inside pattern
            break;
           }
        }

      //--- validate lower trend line integrity (S2 to S4)
      is_line_s24_break = false;

      //--- scan candles between refined S2 and S4
      for(int z = s2_lowest_index; z <= l; z++)
        {
         // retrieve lower trend line price at current candle time
         line_s24_value = ObjectGetValueByTime(0, line_s2_4, time[z], 0);

         // check if candle closed below the lower trend line
         if(close[z] < line_s24_value)
           {
            is_line_s24_break = true; // invalidate structure if breakout occurs inside pattern
            break;
           }
        }

      //--- calculate maximum allowed structure expansion limit (based on S1 to S2 range)
      s1_2_limit = (s1_highest - s2_lowest) * 1.5;

      //--- measure actual expansion between upper and lower refined swings (S3 to S4)
      s2_4_interval = s3_highest - s4_l;

      //--- confirm bullish megaphone structure validity conditions
      if(is_line_s13_break == false && is_line_s24_break == false && s2_lowest < s1_highest && s3_highest > s1_highest
         && s4_l < s2_lowest && s2_4_interval <= s1_2_limit)
        {
         //--- temporarily activate trend lines across all timeframes once structure is validated
         ObjectSetInteger(0, line_s1_3, OBJPROP_TIMEFRAMES, OBJ_ALL_PERIODS);
         ObjectSetInteger(0, line_s2_4, OBJPROP_TIMEFRAMES, OBJ_ALL_PERIODS);

        }

      break;
     }
  }
Explanation:
The trend lines for the bullish megaphone formation are immediately obscured from the chart upon creation. This is done deliberately to prevent the user from seeing incomplete or unconfirmed structures. The system has not yet verified the validity of the structure; it has merely detected possible swing points and drawn the relevant upper and lower bounds. The trend lines are used internally for validation and reference when the display attribute is set to "no periods," but they are not visible until all requirements are met.
Validation starts by checking the integrity of the upper trend line connecting S1 and S3. Every candle between these two refined swing points is scanned by the algorithm, which then compares the closing price of each candle to the trend line's value at that particular moment. Any candle that closes above the upper trend line shows that the formation is no longer valid because the price has prematurely broken the predicted structure. In that instance, the structure is promptly identified as damaged and is not subject to additional verification. The lower trend line that joins S2 and S4 undergoes a similar process.
Every candle between these locations is examined by the system, which determines whether any candles close below the bottom border. If this criterion is met, the pattern is deemed invalid, and the structure has been violated on the downside. This guarantees that the only price fluctuations that are recognized as legitimate megaphone formations are those that are clear and continuous inside the bounds. The method assesses the pattern's overall expansion behavior after structural integrity has been verified. It applies a limit to prevent the structure from being unduly stretched by measuring the initial swing range and comparing it with the full expansion between subsequent swing positions. This aids in removing erratic patterns that don't accurately depict a megaphone pattern.
Finally, when all conditions are satisfied, including no internal breakouts and proper expansion on both sides, the previously hidden trend lines are activated and made visible across all timeframes. At this point, the structure is considered fully validated, and the market formation is officially recognized as a complete bullish megaphone pattern.
Structural Breakout Confirmation
In this step, we confirm the actual breakout of the validated megaphone structure by monitoring price movement beyond the trend lines to identify a final directional move that signals a potential trading opportunity.
Example:
//-- object variables
string buy_obj;

//+------------------------------------------------------------------+
//| Create buy and sell objects                                      |
//+------------------------------------------------------------------+
bool DrawObject(const string name,
                datetime xt, double x,
                ENUM_OBJECT obj_type)
  {
   bool created = false;

//--- Create object only if it does not exist
   if(ObjectFind(0, name) < 0)
     {
      ObjectCreate(0,name,obj_type,0,xt,x);
      created = true;
     }

   return created;
  }
//--- confirm bullish megaphone structure validity conditions
if(is_line_s13_break == false && is_line_s24_break == false && s2_lowest < s1_highest && s3_highest > s1_highest
   && s4_l < s2_lowest && s2_4_interval <= s1_2_limit)
  {

//--- hide trend lines from chart
   ObjectSetInteger(0, line_s1_3, OBJPROP_TIMEFRAMES, OBJ_NO_PERIODS);
   ObjectSetInteger(0, line_s2_4, OBJPROP_TIMEFRAMES, OBJ_NO_PERIODS);

//--- extend trend lines to the right for real-time breakout monitoring
   ObjectSetInteger(0, line_s1_3, OBJPROP_RAY_RIGHT, true);
   ObjectSetInteger(0, line_s2_4, OBJPROP_RAY_RIGHT, true);

//--- scan forward from pattern completion point to detect breakout event
   for(int m = l; m <= rates_total - 2; m++)
     {
      //--- get current upper and lower trend line values at candle time
      line_s13_cross_value = ObjectGetValueByTime(0, line_s1_3, time[m], 0);
      line_s24_cross_value = ObjectGetValueByTime(0, line_s2_4, time[m], 0);

      //--- check if price breaks above upper trend line (bullish breakout trigger)
      if(close[m] > line_s13_cross_value)
        {
         //--- move trend lines forward to breakout point for accurate alignment
         ObjectMove(0, line_s1_3, 1, time[m], line_s13_cross_value);
         ObjectMove(0, line_s2_4, 1, time[m], line_s24_cross_value);

         //--- reset revalidation flag for lower structure check
         is_line_s24_break_check = false;

         //--- confirm lower trend line has not been violated before breakout
         for(int x = l; x <= m; x++)
           {
            line_s24_break_check = ObjectGetValueByTime(0, line_s2_4, time[x], 0);

            //--- invalidate breakout if price closed below lower trend line earlier
            if(close[x] < line_s24_break_check)
              {
               is_line_s24_break_check = true;
               break;
              }
           }

         //--- confirm valid bullish breakout (no internal structure violation)
         if(is_line_s24_break_check == false)
           {
            //--- finalize trend line state and make it visible across all timeframes
            ObjectSetInteger(0, line_s1_3, OBJPROP_RAY_RIGHT, false);
            ObjectSetInteger(0, line_s2_4, OBJPROP_RAY_RIGHT, false);

            ObjectSetInteger(0, line_s1_3, OBJPROP_TIMEFRAMES, OBJ_ALL_PERIODS);
            ObjectSetInteger(0, line_s2_4, OBJPROP_TIMEFRAMES, OBJ_ALL_PERIODS);

            //--- generate bullish entry signal at breakout candle
            buy_obj = OBJ_PREFIX + "Buy OBJ" + TimeToString(time[m]);

            if(DrawObject(buy_obj, time[m], close[m], OBJ_ARROW_BUY))
              {
               need_redraw = true; // refresh chart after signal creation
              }
           }

         break; // stop scanning after first valid breakout
        }
     }

  }
Output:
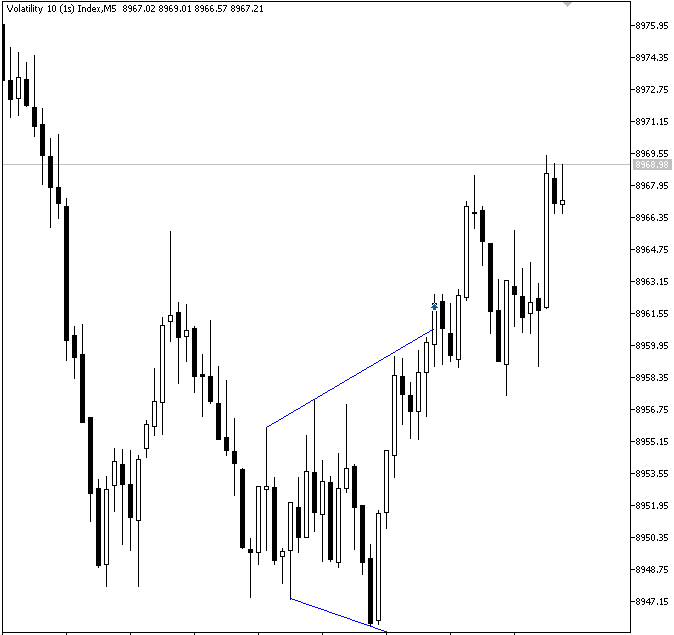
Explanation:
The DrawObject function handles these signal markers by taking in the object type, price level, time of the signal candle, and a unique name. First, the code checks the chart to see if an object with the same identification already exists. By doing this, duplicate signal markers are avoided. The function returns true to indicate that the drawing was successful if the object does not already exist and is produced at the specified price and time location.
At this stage, the trend lines are first hidden from the chart using the timeframe control. This removes them from being displayed across all chart timeframes, even though they still exist internally in the indicator. The purpose of this is to prevent premature or misleading visualization of a structure that has not yet confirmed a valid breakout. We are essentially keeping the pattern "in observation mode" without showing it to the user. Even though the lines are hidden, they are not inactive. Instead, they are extended to the right using ray extension so that they continue projecting forward in time. This is important because it allows the indicator to monitor live price movement against the structure boundaries in real time. In other words, the lines are invisible but still actively functional for breakout detection.
After this setup, the system begins scanning forward from the point where the full swing structure is completed. This loop represents the transition from pattern formation to breakout monitoring. For each new candle after the pattern completion, the indicator retrieves the current value of both the upper and lower trend lines at that time. This allows it to continuously compare price action against the evolving structure. A possible bullish breakout is identified if the price closes above the top trend line. The trade is not instantly confirmed by the system at that point. Rather, it initially realigns the structure by shifting both trend lines' second anchor points to the breakout candle. This keeps the trend lines aligned with the actual breakout point.
However, before confirming the breakout, an additional validation is performed. The system checks whether any candle between the completion of the pattern and the breakout has violated the lower trend line. This step is critical because a valid bullish breakout must not have previously broken the opposite boundary. If any candle closes below the lower trend line during this period, the structure is considered invalid, and the breakout is rejected.
Only when the structure passes this integrity check is the breakout accepted as valid. At that point, the trend lines are finalized by disabling the ray extension and making them visible across all timeframes again. This marks the transition from a hidden, analytical structure into a confirmed chart pattern. A buy signal object is created at the breakout candle. This object represents the confirmed entry point of the bullish megaphone pattern and is displayed on the chart as the final output of the detection process.
Stop Loss and Take Profit Placement
In this final step, we calculate and place the stop loss and take profit levels based on the confirmed breakout structure and display them on the chart using objects for clear risk and reward visualization.
Example://-- object variables string buy_obj; double sl; string sl_line_obj; string sl_txt_obj; double tp; string tp_line_obj; string tp_txt_obj;
//--- scan forward from pattern completion point to detect breakout event
for(int m = l; m <= rates_total - 2; m++)
  {
//--- get current upper and lower trend line values at candle time
   line_s13_cross_value = ObjectGetValueByTime(0, line_s1_3, time[m], 0);
   line_s24_cross_value = ObjectGetValueByTime(0, line_s2_4, time[m], 0);

//--- check if price breaks above upper trend line (bullish breakout trigger)
   if(close[m] > line_s13_cross_value)
     {
      //--- move trend lines forward to breakout point for accurate alignment
      ObjectMove(0, line_s1_3, 1, time[m], line_s13_cross_value);
      ObjectMove(0, line_s2_4, 1, time[m], line_s24_cross_value);

      //--- reset revalidation flag for lower structure check
      is_line_s24_break_check = false;

      //--- confirm lower trend line has not been violated before breakout
      for(int x = l; x <= m; x++)
        {
         line_s24_break_check = ObjectGetValueByTime(0, line_s2_4, time[x], 0);

         //--- invalidate breakout if price closed below lower trend line earlier
         if(close[x] < line_s24_break_check)
           {
            is_line_s24_break_check = true;

            break;
           }
        }

      //--- confirm valid bullish breakout (no internal structure violation)
      if(is_line_s24_break_check == false)
        {
         //--- finalize trend line state and make it visible across all timeframes
         ObjectSetInteger(0, line_s1_3, OBJPROP_RAY_RIGHT, false);
         ObjectSetInteger(0, line_s2_4, OBJPROP_RAY_RIGHT, false);

         ObjectSetInteger(0, line_s1_3, OBJPROP_TIMEFRAMES, OBJ_ALL_PERIODS);
         ObjectSetInteger(0, line_s2_4, OBJPROP_TIMEFRAMES, OBJ_ALL_PERIODS);

         //--- generate bullish entry signal at breakout candle
         buy_obj = OBJ_PREFIX + "Buy OBJ" + TimeToString(time[m]);

         if(DrawObject(buy_obj, time[m], close[m], OBJ_ARROW_BUY))
           {
            need_redraw = true; // refresh chart after signal creation
           }

         //--- calculate stop loss at midpoint of breakout structure range
         sl = ((line_s13_cross_value - line_s24_cross_value) / 2) + line_s24_cross_value;

         //--- create stop loss trend line object identifier
         sl_line_obj = OBJ_PREFIX + "SL line" + TimeToString(time[l]) + TimeToString(time[m]);

         //--- draw stop loss level on chart
         if(DrawTrend(sl_line_obj, time[l], sl, time[m], sl, clrRed))
           {
            need_redraw = true; // refresh chart after SL line is drawn
           }

         //--- create stop loss label object at breakout candle
         sl_txt_obj = OBJ_PREFIX + "SL Text" + TimeToString(time[m]);

         //--- display "SL" text on chart at calculated stop loss level
         if(DrawTxt(sl_txt_obj, time[m], sl, "SL", clrRed))
           {
            need_redraw = true; // refresh chart after SL label is drawn
           }

         //--- calculate take profit based on full height of breakout structure
         tp = (line_s13_cross_value - line_s24_cross_value) + line_s13_cross_value;

         //--- create take profit trend line object identifier
         tp_line_obj = OBJ_PREFIX + "TP line" + TimeToString(time[l]) + TimeToString(time[m]);

         //--- draw take profit level on chart
         if(DrawTrend(tp_line_obj, time[l], tp, time[m], tp, clrGreen))
           {
            need_redraw = true; // refresh chart after TP line is drawn
           }

         //--- create take profit label object at breakout candle
         tp_txt_obj = OBJ_PREFIX + "TP Text" + TimeToString(time[m]);

         //--- display "TP" text on chart at calculated take profit level
         if(DrawTxt(tp_txt_obj, time[m], tp, "TP", clrGreen))
           {
            need_redraw = true; // refresh chart after TP label is drawn
           }
        }

      break; // stop scanning after first valid breakout
     }
  }
Output:
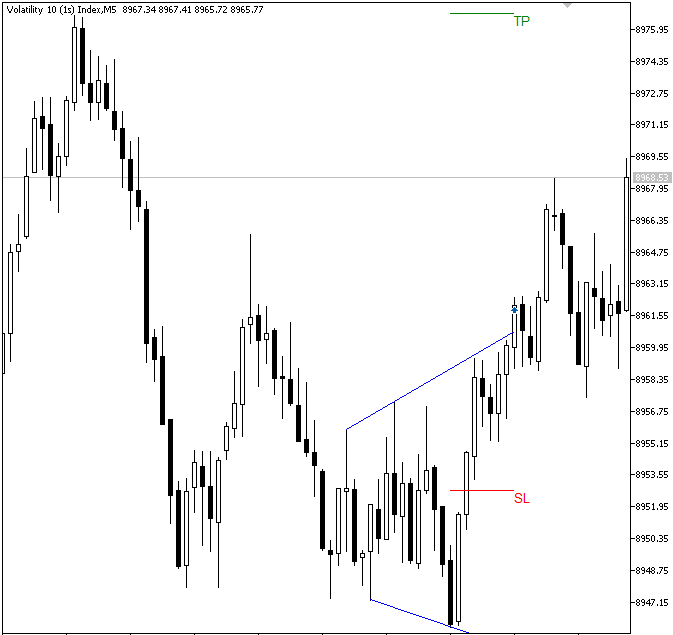
Explanation:
The strategy uses the midpoint of the difference between the breakout structure's upper and lower trend lines to calculate the stop loss. The entire distance between the two limits is measured, divided by two, and added to the lower level. By positioning the stop loss in the middle of the structure, this strategy ensures that it is in line with the volatility of the pattern and stays away from being too near or too far from price action.
Once the stop loss value is determined, a unique object name is generated for it, and a horizontal line is drawn on the chart at that price level. This visual representation helps clearly mark the risk boundary. A text label is also placed at the same level, displaying “SL” so the trader can easily identify it on the chart. Each time these objects are successfully created, the chart is flagged for redraw to ensure the updates are visible.
Next, the take profit is calculated based on the full height of the breakout structure. The distance between the upper and lower trend lines is projected upward from the upper boundary, effectively creating a measured move target. This approach assumes that the price will extend by a similar magnitude after the breakout. A trend line is then drawn at the take profit level using another unique object identifier, followed by a text label marked “TP” to indicate the profit target. Just like with the stop loss, the chart is updated to reflect these new objects.
Conclusion
By completing this article, we have established a complete and structured framework for detecting the megaphone pattern in MQL5, designed as a practical and verifiable approach before full implementation. The focus was on breaking the detection process into clear, logical stages that ensure accuracy, consistency, and easier debugging throughout development. The system is built around the following key components:
- swing detection for identifying valid market turning points;
- swing refinement to extract true price extremes within each leg;
- trend line creation and integrity validation;
- breakout confirmation based on candle close rules;
- stop loss and take profit projection derived from structure geometry.
This framework provides a structured and rule-based approach to detecting megaphone patterns in MQL5, improving reliability and clarity in pattern recognition.
The project is supported in Algo Forge.
Warning: All rights to these materials are reserved by MetaQuotes Ltd. Copying or reprinting of these materials in whole or in part is prohibited.
This article was written by a user of the site and reflects their personal views. MetaQuotes Ltd is not responsible for the accuracy of the information presented, nor for any consequences resulting from the use of the solutions, strategies or recommendations described.

 How to Detect and Normalize Chart Objects in MQL5 (Part 1): Building a Chart Object Detection Engine
 Market Microstructure in MQL5 (Part 3): Estimating ARFIMA d with GPH
 Building the Market Structure Sentinel Indicator in MQL5
 An Introduction to the Study of Fractal Market Structures Using Machine Learning

- Free trading apps
- Over 8,000 signals for copying
- Economic news for exploring financial markets
You agree to website policy and terms of use