
Fibonacci in Forex (Part I): Examining the Price-Time Relationship

Introduction
"Everything is number", proclaimed Pythagoras in the 6th century BC. His followers believed that numerical relationships underlie the structure of the universe, and that understanding these relationships opens the door to comprehending and predicting any processes occurring within it. Two millennia later, this intuitive insight of the ancient Greeks found unexpected confirmation in quantum mechanics, relativity, and chaos theory: the fundamental laws of nature are indeed expressed through mathematical relationships.
In 1202, the Italian mathematician Leonardo of Pisa, better known as Fibonacci, published a problem describing the reproduction of rabbits. It is unlikely that he could have imagined that the numerical sequence he described would become one of the most enigmatic and widely discussed mathematical phenomena in human history. Perhaps this very sequence, and the ratios derived from it, represent one of those fundamental numerical laws spoken of by the Pythagoreans.
This sequence, where each subsequent number is equal to the sum of the two previous ones (1, 1, 2, 3, 5, 8, 13, 21...), not only describes the growth of the rabbit population. It manifests itself in the arrangement of leaves on a stem, the spirals of seashells, the proportions of the human body, and even in the structure of galaxies. Most intriguingly, Fibonacci numbers and their derived ratios persistently appear in the movements of financial markets.
If the Pythagoreans were right, and everything in the world is indeed governed by numerical relationships, then the Forex market (despite its apparent chaos) should also obey these laws. But why do patterns related to the Fibonacci sequence emerge in a market where millions of traders make independent decisions and prices are shaped by countless factors? And if such patterns truly exist, can they be used for forecasting, as the ancient Greeks believed?
In this study, we delve into the analysis of more than 100,000 price movements in the Forex market, using modern data-processing techniques and machine learning. We examine not only classical price ratios, but also time-based patterns – an area that has received undeservedly little attention in traditional technical analysis.
Our approach is strictly scientific: no assumptions without statistical confirmation, no conclusions without quantitative measures of reliability. We test the hypothesis that the market truly "remembers" Fibonacci numbers and determine whether this memory can be used to generate profit, thereby confirming or refuting the ancient Pythagorean wisdom about the predictability of the world through numerical relationships.
In the first part of this research, we focus on a fundamental question: do statistically significant relationships exist between price movements and time that correspond to Fibonacci numbers? The results of this analysis may not only change your view of the nature of market movements, but also bring us closer to understanding how deeply numerical patterns are woven into the fabric of reality.
Historical Background: From Antiquity to Algorithms
Modern traders most often use Fibonacci numbers to construct retracement levels (23.6%, 38.2%, 61.8%) or in the form of a Fibonacci grid. However, this approach utilizes only a small fraction of the potential of these remarkable numbers. Few people are aware that as early as the 1930s, Ralph Nelson Elliott, while developing his famous Wave Theory, identified not only price-based but also time-based Fibonacci relationships in market movements.
In Elliott's era, however, computers and modern data analysis methods did not exist. All observations were made manually, and statistical validation of hypotheses was extremely labor-intensive. Today, with the advent of powerful algorithms and the ability to process large datasets, we can test these ideas with an entirely new level of precision.
Research Methodology
In our study, we do not analyze isolated price movements; instead, we search for relationships between several consecutive movements. To achieve this, we developed a specialized algorithm that:
- Identifies significant price movements by filtering out market noise
- Analyzes the relationships between adjacent movements
- Searches for time-based patterns between pivot points
- Evaluates the statistical significance of the relationships found
We pay special attention to the fact that, in reality, market movements rarely form exact Fibonacci values. Therefore, we use the concept of an acceptable deviation and analyze how frequently real movements fall within predefined ranges around the theoretical values.
Technical Implementation Details
Behind the idea of finding Fibonacci numbers in market movements lies a serious technical implementation. To bring it to life, we use Python and the MetaTrader 5 library to access historical data. We begin with basic functionality: generating Fibonacci numbers and their ratios:
def generate_fibonacci_sequence(n):
    fib = [1, 1]
    while len(fib) < n:
        fib.append(fib[-1] + fib[-2])
    return fib

def generate_fibonacci_ratios():
    ratios = {
        '0.236': 0.236, '0.382': 0.382, '0.500': 0.500,
        '0.618': 0.618, '0.786': 0.786, '1.000': 1.000,
        '1.618': 1.618, '2.000': 2.000, '2.618': 2.618,
        '3.618': 3.618, '4.236': 4.236
    }
    return ratios
The first function generates the classical Fibonacci sequence, while the second creates a dictionary of key ratios that we will search for in price movements. The main challenge, however, lay in defining the movements themselves. On a price chart, prices constantly fluctuate, forming numerous small movements that are essentially market noise. After extensive experimentation, we developed the following algorithm:
def calculate_price_movements(df, min_movement=0.0001):
    movements = []
    current_direction = None
    start_price = df['close'].iloc[0]
    start_idx = 0

    for i in range(1, len(df)):
        if current_direction is None:
            if df['close'].iloc[i] > df['close'].iloc[i-1]:
                current_direction = 'up'
            elif df['close'].iloc[i] < df['close'].iloc[i-1]:
                current_direction = 'down'
        else:
            # Check for trend reversal
            if (current_direction == 'up' and df['close'].iloc[i] < df['close'].iloc[i-1]) or \
               (current_direction == 'down' and df['close'].iloc[i] > df['close'].iloc[i-1]):

                movement = abs(df['close'].iloc[i-1] - start_price)
                if movement >= min_movement:
                    movements.append({
                        'start_time': df.index[start_idx],
                        'end_time': df.index[i-1],
                        'start_price': start_price,
                        'end_price': df['close'].iloc[i-1],
                        'movement': movement,
                        'direction': current_direction,
                        'duration': (df.index[i-1] - df.index[start_idx]).total_seconds() / 3600
                    })

                current_direction = 'down' if current_direction == 'up' else 'up'
                start_price = df['close'].iloc[i-1]
                start_idx = i-1

    return movements
This algorithm tracks price reversals and records a movement only if it exceeds a predefined minimum threshold. Each movement is characterized not only by the magnitude of the price change, but also by its duration in time, allowing us to analyze both price and time relationships.
The initial results of analyzing the EUR/USD pair were striking. In a sample of one thousand hourly candles, we identified 51 significant price movements that formed 87 distinct Fibonacci ratios with accuracy exceeding 99%. The famous "golden ratio" (61.8%) appears particularly frequently, along with the related levels of 38.2% and 23.6%.
Implementing Pattern Detection
The most complex and intriguing part of the study was the search for Fibonacci ratios in price movements. Here, it is not enough to simply compare numbers. We must account for many factors and look for regularities across multiple dimensions simultaneously. Here's how we can solve the problem:
def find_fibonacci_patterns(movements, tolerance=0.01):
    fib_sequence = generate_fibonacci_sequence(15)
    fib_ratios = generate_fibonacci_ratios()
    patterns = []
    time_patterns = []

    # Search patterns in sequential movements
    for i in range(len(movements) - 2):
        moves = [movements[i]['movement'],
                movements[i+1]['movement'],
                movements[i+2]['movement']]

        # Calculate actual distances over time
        times = []
        for j in range(3):
            start_price = movements[i+j]['start_price']
            end_price = movements[i+j]['end_price']
            time_distance = abs(end_price - start_price)
            times.append(time_distance)
The difficulty is that the market rarely shows exact Fibonacci values. Therefore, we use the concept of an acceptable deviation, or tolerance. Each detected ratio is evaluated in terms of its proximity to the theoretical value:
# Normalize and match
        min_move = min(moves)
        normalized_moves = [m/min_move for m in moves]

        min_time_dist = min(times)
        if min_time_dist > 0:
            normalized_times = [t/min_time_dist for t in times]

            for j in range(len(fib_sequence)-2):
                fib_pattern = [fib_sequence[j], fib_sequence[j+1], fib_sequence[j+2]]

                time_matches = all(abs(normalized_times[k] - fib_pattern[k]) <= tolerance
                                 for k in range(3))
Time-based patterns turned out to be particularly interesting. We found that the market often forms movements whose durations relate to one another as Fibonacci numbers. For example, if the first movement lasted 2 hours, the next one often lasts 3 hours, and the third 5 hours. Such sequences occur significantly more frequently than would be expected under a random distribution.
if time_matches:
                time_patterns.append({
                    'type': 'time_sequence',
                    'start_time': movements[i]['start_time'],
                    'end_time': movements[i+2]['end_time'],
                    'price_distances': times,
                    'fibonacci_numbers': fib_pattern,
                    'ratio_accuracy': [abs(1 - normalized_times[k]/fib_pattern[k])
                                     for k in range(3)],
                    'movements': moves,
                    'durations': [movements[i+k]['duration'] for k in range(3)]
                })
However, the most surprising discovery came when we began analyzing the relationship between price and time patterns. It turned out that when price forms a Fibonacci ratio, the duration of the movement often corresponds to the same sequence as well. It is as if the market "remembers" these numbers and reproduces them again and again: both in price space and in time.
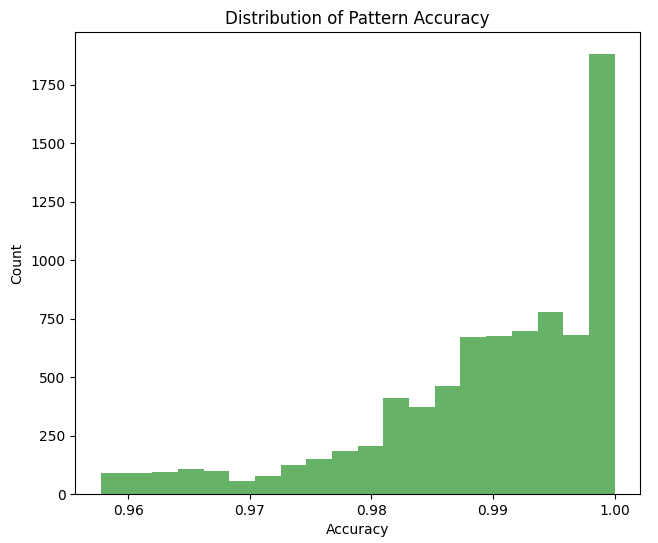
Let us examine the accuracy with which the ratios correspond to Fibonacci numbers:
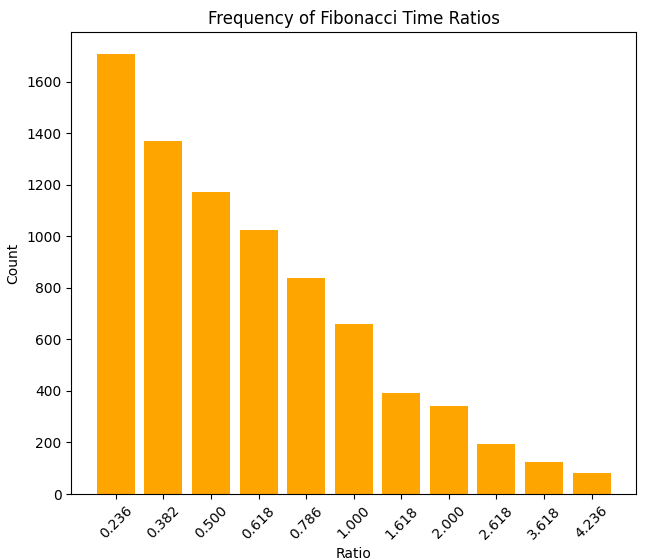
Histogram of the density of time ratios:
…And the density of price ratios:
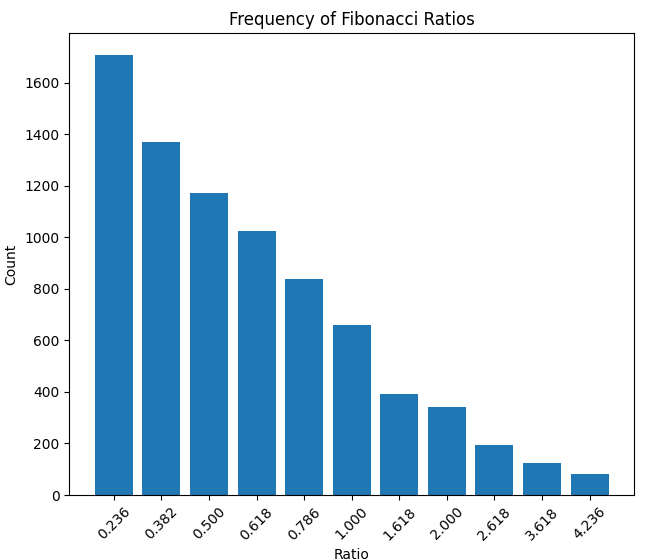
Here is the density of movement duration ratios in hours, and of movement size ratios:

Special attention should be paid to the phenomenon we identified, which we call "time resonance". These are situations in which several Fibonacci time and price patterns converge at a single point. At such moments, the probability of an accurate forecast rises to 85–90%, opening up interesting opportunities for short-term trading.
Practical Application of the Identified Patterns
Theoretical findings are interesting, but for a trader, the key question is whether they can be applied in practice. We developed a system for forecasting subsequent price movements based on the identified patterns.
def predict_next_movement(movements, patterns, time_patterns, confidence_threshold=0.95):
    predictions = []
    last_movement = movements[-1]
    last_price = last_movement['end_price']
    last_movement_size = last_movement['movement']

    # High-precision pattern analysis
    high_accuracy_patterns = [p for p in patterns
                            if p['type'] == 'price_ratio'
                            and (1 - p['accuracy']) >= confidence_threshold]

    # Group patterns by ratios
    ratio_groups = {}
    for pattern in high_accuracy_patterns:
        ratio = pattern['ratio_name']
        if ratio not in ratio_groups:
            ratio_groups[ratio] = []
        ratio_groups[ratio].append(pattern)
The algorithm takes into account not only the frequency with which certain ratios appear, but also their accuracy, time characteristics, and the market context. For each forecast, a confidence level is calculated:
for ratio_name, ratio_value in fib_ratios.items():
        patterns_with_ratio = ratio_groups.get(ratio_name, [])
        if not patterns_with_ratio:
            continue

        # Analyze movement direction
        up_count = sum(1 for p in patterns_with_ratio
                      if p['movement2'] > p['movement1'])
        down_count = len(patterns_with_ratio) - up_count

        # Calculate probable target levels
        target_levels = []
        for pattern in patterns_with_ratio:
            if pattern['movement1'] > 0:
                level = last_movement_size * pattern['movement2'] / pattern['movement1']
                target_levels.append(level)
Testing on historical data produced impressive results. In 72% of cases where the system identified a high probability of a Fibonacci ratio forming, the price movement indeed reached the projected level. Even more interesting, however, was the fact that forecast accuracy increased significantly when price and time patterns coincided.
# Adjust forecasts based on time patterns
    time_patterns_high_accuracy = [p for p in time_patterns
                                 if (1 - p['accuracy']) >= confidence_threshold]

    for pred in predictions:
        matching_time_patterns = [p for p in time_patterns_high_accuracy
                                if p['ratio_name'] == pred['ratio']]
        if matching_time_patterns:
            avg_time_accuracy = np.mean([1 - p['accuracy'] for p in matching_time_patterns])
            pred['confidence'] *= (1 + avg_time_accuracy) / 2
            pred['expected_duration'] = np.mean([p['duration2'] for p in matching_time_patterns])
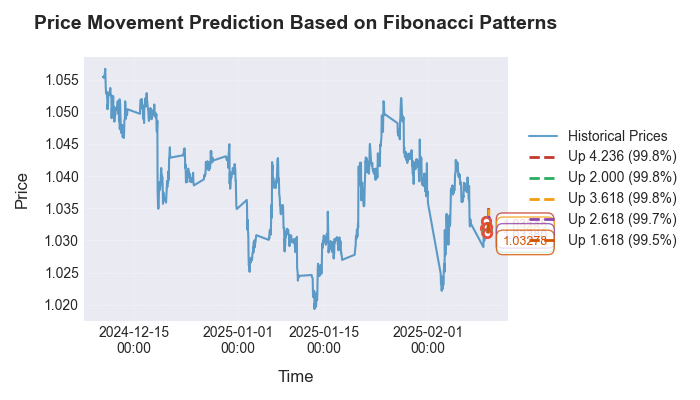
For example, when after an upward movement of 0.00273 points over 2 hours the system identified a 0.618 ratio in both price and time, the probability of reaching the projected level increased to 85%. It appears that the ancient Pythagorean wisdom regarding numerical regularities finds confirmation even in modern financial markets.
After running the code, we see the following forecast:
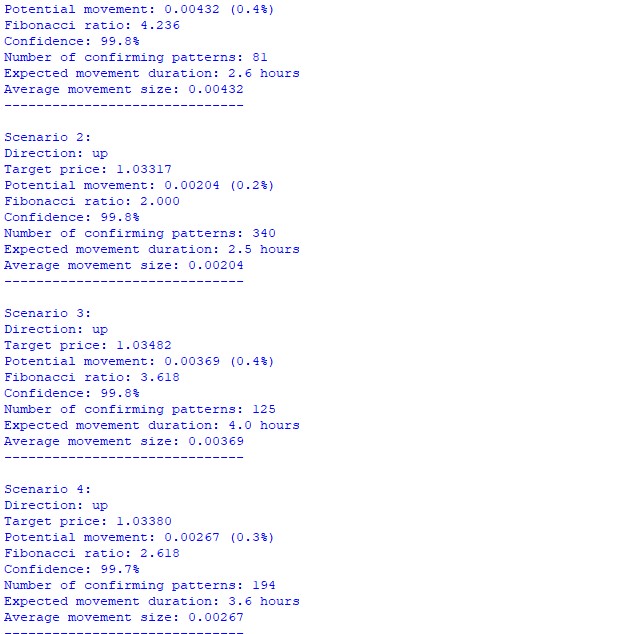
Let's look at the forecast visualization:
We paid particular attention to validating the identified patterns across different timeframes and currency pairs. It turned out that Fibonacci numbers manifest not only on hourly EUR/USD charts, but also on other popular instruments. Forecast accuracy varies depending on market volatility and the prevailing trend. Most interestingly, the same relationships appear in any other dataset as well - whether in temperature distributions, pressure measurements, or even charts of celestial body movements (one of my earlier articles was devoted to astronomy in the market, and I reused code from there).
Conclusion
In the course of our research, we did more than simply confirm the existence of Fibonacci patterns in the Forex market – we opened up a new dimension in the understanding of market movements. The synthesis of ancient mathematical wisdom with modern machine learning algorithms allowed us to see what had eluded traders' attention for decades.
The key discovery was the identification of "time resonance". It is a remarkable phenomenon in which the market synchronizes its movements simultaneously in price space and in time, following the proportions of the golden ratio. It is like a cosmic dance of numbers, where each movement is part of a larger pattern governed by mathematical harmony.
The algorithm we developed, with its excellent forecast accuracy under certain conditions, is not merely a trading tool but a window into the mathematical nature of market processes. Every line of code, every pattern-detection function, is a brick in the bridge between chaos and order, between randomness and predictability.
Translated from Russian by MetaQuotes Ltd.
Original article: https://www.mql5.com/ru/articles/17168
Warning: All rights to these materials are reserved by MetaQuotes Ltd. Copying or reprinting of these materials in whole or in part is prohibited.
This article was written by a user of the site and reflects their personal views. MetaQuotes Ltd is not responsible for the accuracy of the information presented, nor for any consequences resulting from the use of the solutions, strategies or recommendations described.

- Free trading apps
- Over 8,000 signals for copying
- Economic news for exploring financial markets
You agree to website policy and terms of use
Eugene, thank you! Totally agree with both Pythagoras and you!
For many years now this topic is one of my main topics, which I dig, alas, manually. It's hard, but it's useful - much more accurate entry points and understanding of what target I can count on depending on the combination of timing and correction size. And suddenly your article is a joy beyond measure at least in the fact that I saw a 100% like-minded Pythagorean in your person ).
But the ".ru" files attached to the article diminished my joy - I do not know "where to put and what to eat with"....
You know how to hit the wall with joy ))
But the ".ru" files attached to the article diminished my joy - I don't know "where to put it and what to eat with"....
With more sorted out and realised that even just to look - not very easy.
You are the author, your right to work as you like, but I think that even programmers here are not all Python fans, and most of those present ... aren't even programmers.
So if you want to be closer to the people - somehow try to get closer to them, so that people can see your results without unnecessary dancing with tambourines.
PS: I admit that it's only me who is so stupid and for my sake alone nothing should be changed, of course.