TD Sequential Scanner Metatrader 5
- Indikatoren
- Version: 1.0
- Aktivierungen: 20

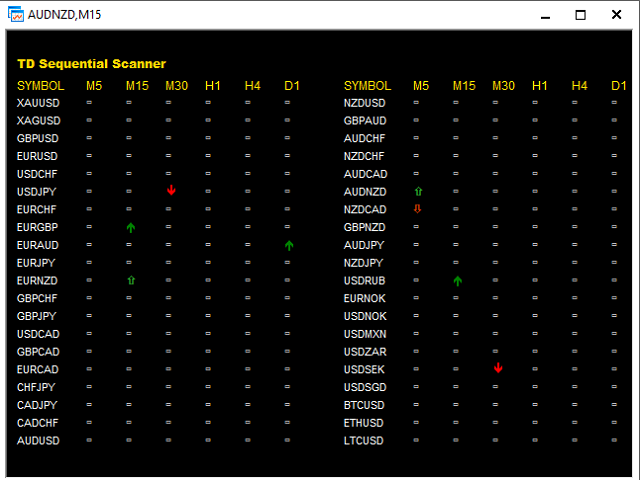
Der Indikator sucht nach TD Sequential Signalen in mehreren Zeitrahmen für alle gefilterten Märkte und zeigt die Ergebnisse auf dem Dashboard an.
Hauptmerkmale
- Das Dashboard kann für alle Märkte verwendet werden
- Es kann nach Signalen in den Zeitrahmen MN1, W1, D1, H4, H1, M30, M15, M5 und M1 suchen.
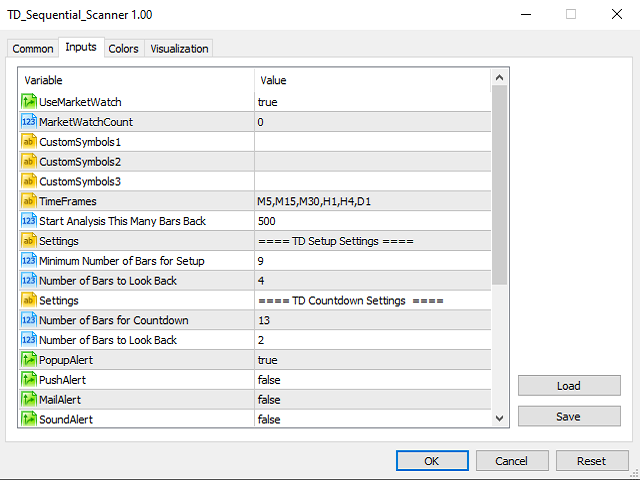
Parameter
- Marktbeobachtung verwenden: Setzen Sie true, um alle im MarketWatch verfügbaren Symbole zu kopieren
- MarketWatchCount : Legen Sie die Anzahl der Symbole fest, die Sie aus der Marktbeobachtungsliste kopieren möchten.
- BenutzerdefinierteSymbole: Geben Sie die benutzerdefinierten Symbole ein, die im Dashboard verfügbar sein sollen.
- Zeitrahmen: Legen Sie die Zeitrahmen für das Dashboard fest.
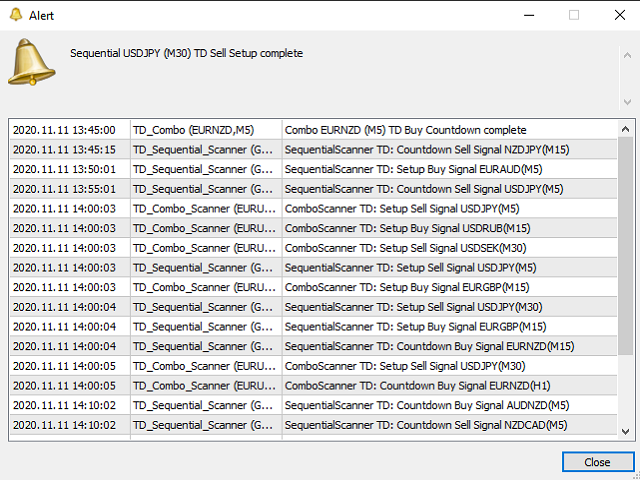
- Popup-Alarm: Setzen Sie True, um ein Popup-Fenster und einen akustischen Alarm auf dem Terminal zu aktivieren, wenn ein neues Signal generiert wird. Setzen Sie False, um sie zu deaktivieren.
- E-Mail-Benachrichtigung: Stellen Sie True ein, um E-Mail-Benachrichtigungen zu erhalten, wenn ein neues Signal generiert wird. Zum Deaktivieren setzen Sie False.
- Push-Benachrichtigung: Stellen Sie True ein, um Push-Benachrichtigungen auf Ihren Apple- oder Android-Geräten zu erhalten, wenn ein neues Signal generiert wird. Zum Deaktivieren stellen Sie False ein.
Für die MT4-Version; besuchen Sie bitte ► https://www.mql5.com/en/market/product/59023
Für meine anderen Produkte; besuchen Sie bitte ► https://www.mql5.com/en/users/samil34/seller