TD Sequential Scanner Metatrader 5
- Indicadores
- Versión: 1.0
- Activaciones: 20

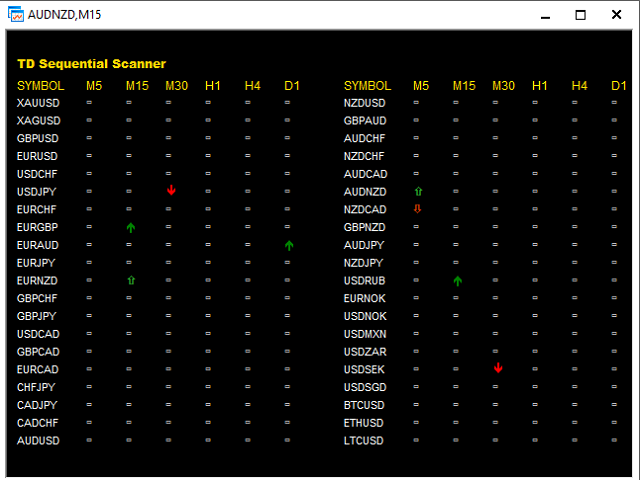
El indicador busca señales secuenciales de TD en múltiples marcos temporales para todos los mercados filtrados y muestra los resultados en el panel de control.
Características principales
- Dashboard se puede utilizar para todos los mercados
- Puede buscar señales en MN1, W1, D1, H4, H1, M30, M15 ,M5, M1 timeframes
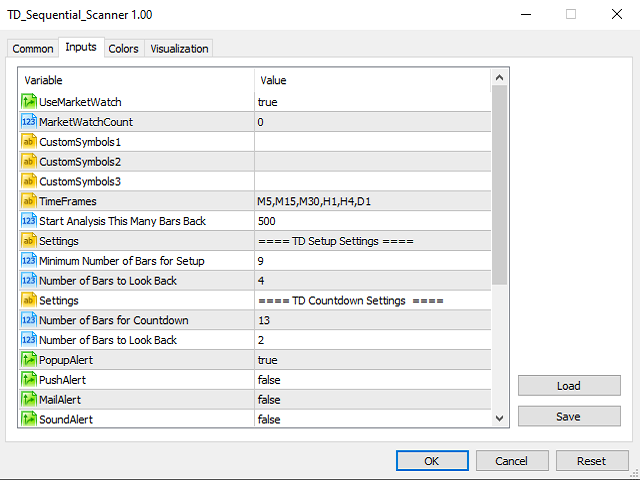
Parámetros
- UseMarketWatch: Establezca true para copiar todos los símbolos disponibles en market watch
- MarketWatchCount : Establezca el número de símbolos que desea copiar de la lista de vigilancia del mercado.
- CustomSymbols: Introduzca los símbolos personalizados que desea que estén disponibles en el cuadro de mandos.
- Plazos: Establezca los plazos para el panel de control.
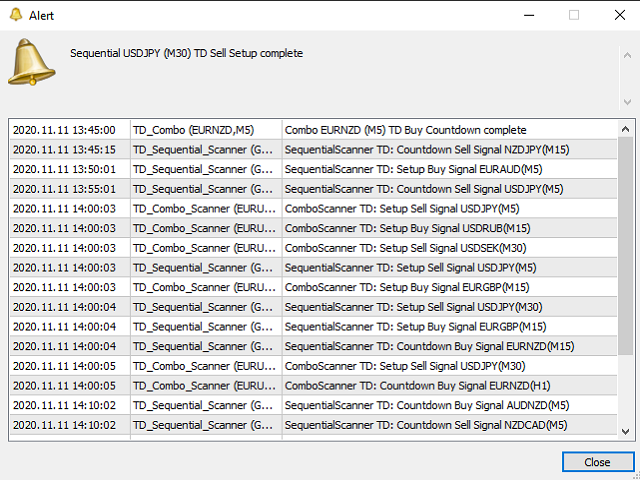
- Alerta emergente: Establezca Verdadero para activar la ventana emergente y la alerta sonora en el terminal cuando se genere una nueva señal. Configure False para desactivarlas.
- Alerta por correo electrónico: Establezca Verdadero para recibir notificaciones por correo electrónico cuando se genere una nueva señal. Fije False para desactivar.
- Alerta push: Establezca Verdadero para recibir notificaciones push en sus dispositivos Apple o Android cuando se genere una nueva señal. Establecer Falso para desactivar
Para la versión MT4; por favor visite ► https://www.mql5.com/en/market/product/59023
Para Mis Otros Productos; por favor visite ► https://www.mql5.com/en/users/samil34/seller