Macroeconomic Analyzer
- Indikatoren
- DARIO GALLIONE
- Version: 1.0
- Aktivierungen: 5
Für die Preisentwicklung gibt es viele Gründe, und diese können von einem Marktteilnehmer zum anderen variieren: Software, private und institutionelle Händler tragen gleichzeitig zur Preisbildung bei, was eine Vorhersage sehr schwierig macht. Es gibt jedoch messbare Faktoren, die den Preis an einen zugrunde liegenden Trend binden, der mit der physischen Realität, die der finanzielle Vermögenswert darstellt, übereinstimmt: Dies sind die makroökonomischen Indikatoren. Großanleger nutzen diese Informationen klug, um ihre Strategien festzulegen. Das Verständnis dieser Mechanismen, angewandt auf den täglichen Handel, kann zu verblüffenden Ergebnissen führen.
Die praktische Anwendung findet ihren maximalen Ausdruck in der Verwendung dieser Informationen als operativer Filter, der eine Neuausrichtung der Preise an den makroökonomischen Informationen anstrebt, wenn ein gegenläufiger Trend eingetreten ist, und zwar auf einem täglichen und wöchentlichen Zeithorizont.
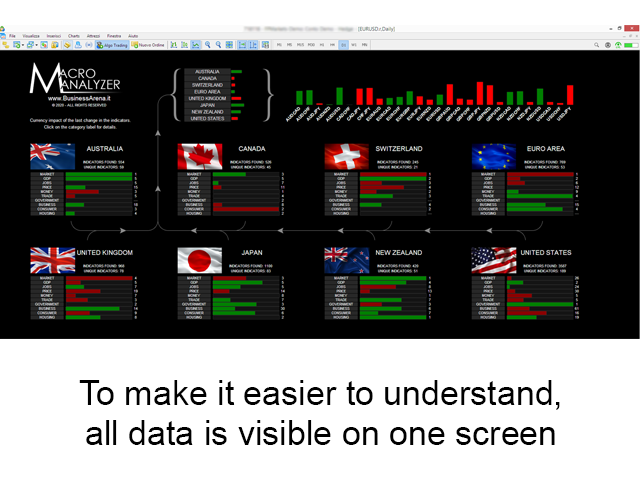
Für jedes Land wird ein ganzes Jahr des Wirtschaftskalenders analysiert, um alle verfügbaren Indikatoren zu erhalten. Das Ergebnis sind Tausende von Daten, die auf einem einfachen und intuitiven Bildschirm analysiert und sortiert werden. Jeder makroökonomische Indikator wird in seinen neuesten Variationen ausgewertet, auf seine Auswirkungen hin gewichtet und auf die Art der Korrelation mit der Währung, auf die er sich bezieht, interpretiert. Diese Daten werden dann in Kategorien eingeteilt, um ihre Bedeutung in einem Gesamtbild auszubalancieren, und aus diesen wird jedem Land eine Endnote zugewiesen. Aus diesen Werten ergibt sich schließlich ein Index, der den einzelnen Währungspaaren zugeordnet wird ... und fertig ist der Zauber!
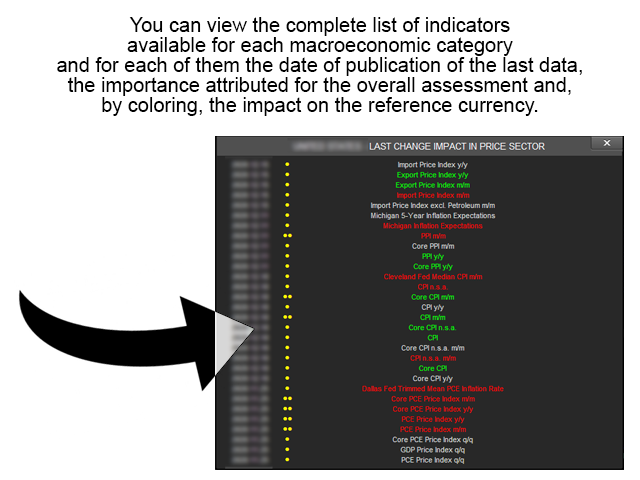
Zum besseren Verständnis können Sie durch Anklicken der Kategoriebezeichnung die vollständige Liste der verfügbaren Indikatoren und für jeden von ihnen das Datum der Veröffentlichung der letzten Daten, die Bedeutung, die ihm für die Gesamtbewertung beigemessen wird, und, durch Einfärbung, die Auswirkungen auf die Referenzwährung einsehen.
Erforderliche Voraussetzungen
Der Indikator funktioniert auf der Plattform Metatrader5 (Version 4 unterstützt diese Art von Informationen nicht).
Minimale Bildschirmauflösung: Full HD 1920 x 1080 Pixel.
Er ist nicht kompatibel mit 4K-Displays und Laptops mit High-Density-Displays, wenn ein anderer Windows-Vergrößerungswert als 100% eingestellt ist.