VaviStar retracement indicator
- Indikatoren
- Version: 1.41
- Aktualisiert: 25 Januar 2023
- Aktivierungen: 5

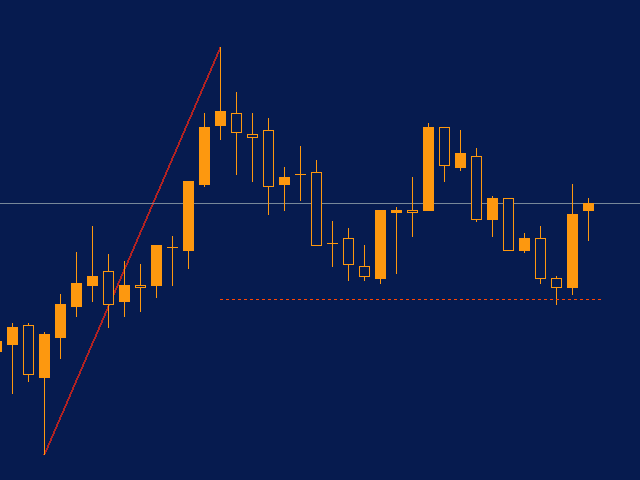
VaviStar ist ein Indikator, der auf Trend-Retracements basiert, die durch ZigZag-Segmente bestimmt werden.
Es gibt Theorien und Statistiken, die bestätigen, dass Aktien auf bestimmte Retracement-Niveaus reagieren. Viele verwenden Fibonacci-Retracement-Levels (23,6%, 38,2%, 61,8%).
Es wird davon ausgegangen, dass man bereits von einer Trendumkehr sprechen kann, wenn der Kurs das 61,8%-Retracement überschreitet.
Mit diesem Indikator können Sie bequem ein Segment des ZigZag mit den gewählten relativen Kursniveaus darstellen.
Mit einer Umkehrmentalität können Sie ihn nutzen, um zwischen Stop-Loss und Retracement-Levels (vielleicht 61,8%) zu handeln.
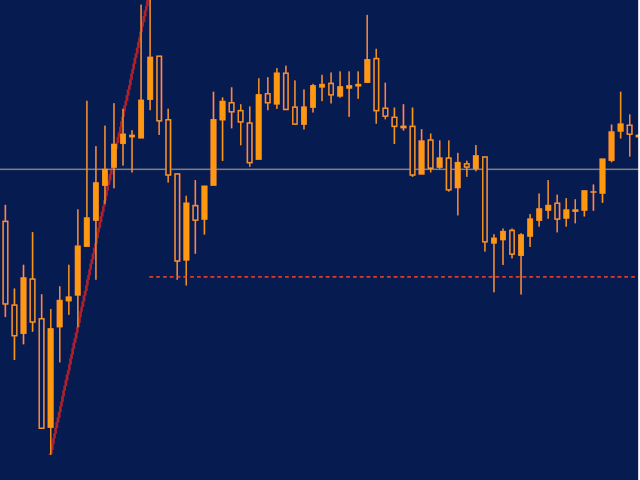
Mit einer Trendfolger-Mentalität kann man nach dem Abprallen vom Retracement-Level (vielleicht 23,6 % oder 38,2 %) nach einem Neustart suchen.
Bei solchen Strategien ist es ratsam, die Anzeige des Stop-Loss-Levels zu deaktivieren.
Verwendung in Echtzeit.
Wenn wir das aktuelle Segment auswerten und "StopLoss-Linie anzeigen" auf "wahr" setzen, werden wir Tick für Tick aktualisiert, wenn das Ziel immer noch in Betracht gezogen wird, da es noch näher als das Retracement-Level ist.
Grafisch wird auf das zuletzt generierte Segment verwiesen und die relativen Niveaus werden bei jeder Kursänderung aktualisiert.
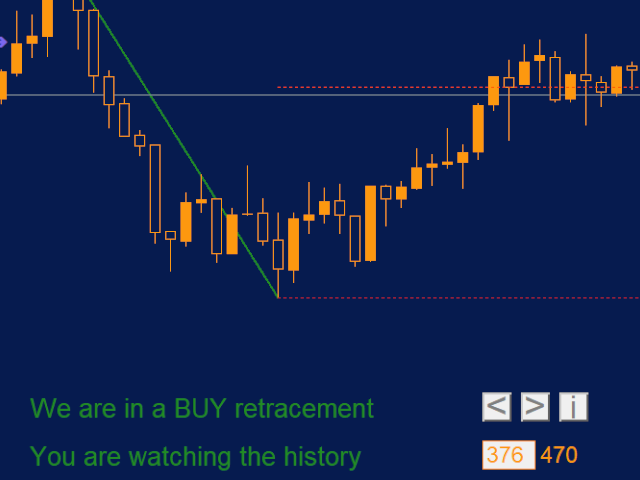
Historische Verwendung.
Der Indikator eignet sich perfekt für die Suche in der Historie. Mit dem Tastenfeld und den Schaltflächen "<" und ">" können wir durch alle Segmente blättern und prüfen, wie unsere Strategie funktioniert hätte, oder wir können uns auf die Suche nach Schlüsselebenen machen.
Wir können verschiedene Zeitrahmen verwenden, um Unterstützungs- und Widerstandsniveaus zu finden.
Je nachdem, wie wir die Maus auf dem Diagramm platzieren (mit Blick auf den potenziellen Einstiegspunkt in den Markt und auf den Stop-Loss - wenn "StopLoss-Linie anzeigen" auf "wahr" gesetzt ist), wird uns in der Historie angezeigt, wo das Zielniveau platziert worden wäre.
Durch Zurückblättern des Diagramms können wir auch Preisniveaus finden, die nie erreicht und nie berührt wurden. Wenn wir die Standardparameter beibehalten, können wir diejenigen finden, die wir mit POCs vergleichen können. Zur Erklärung: POCs (Point of Control) werden von starken Volumina abgeleitet; mit VaviStar verwenden wir keine Volumina, sondern Niveaus, die statistisch gesehen den Preis reagieren lassen.
Grafische Anpassung.
Neben den Farben kann auch die Position aller Elemente angepasst werden.
Eingabe-Parameter:
ZigZag-Parameter
ZZ Depth: Hier wird der Parameter "Depth" des ZigZag eingestellt;
ZZ Abweichung: Hier wird der Parameter "Abweichung" des ZigZag eingestellt;
ZZ BackStep: Dient zur Einstellung des Parameters "BackStep" des ZigZag;
Strategie-Parameter
Retracement %: Hier wird eingestellt, bei welchem Retracement-Prozentsatz eine Marktreaktion erwartet wird;
Stop-Loss-Linie anzeigen: Wenn auf "true" gesetzt, wird die Stop-Loss-Linie vom rechten Ende des ZigZag-Segments aus gezeichnet;
StopLoss-Verschiebung: Legt fest, um wie viele Punkte die Stop-Loss-Linie gegenüber dem durch das ZigZag-Segment angegebenen Maximum und Minimum verschoben werden soll;
Rendite-Multiplikator: Wird verwendet, um das Ziel auf der Grundlage des Abstands zum Stop-Loss festzulegen;
Grafische Parameter
Schriftgröße: Mit diesem Parameter wird die Schriftgröße eingestellt; die Größe aller grafischen Elemente hängt von diesem Parameter ab;
Abstand X Zeile 1: Hier wird der Abstand der Textzeile 1 von der Ordinatenachse eingestellt;
AbstandY Zeile 1: Hier wird der Abstand der Textzeile 1 von der Abszissenachse eingestellt;
Abstand X Linie 2: Er wird verwendet, um den Abstand der Textzeile 2 von der Ordinatenachse einzustellen;
AbstandY Zeile 2: Er wird verwendet, um den Abstand der Textzeile 2 von der Abszissenachse einzustellen;
Textfarbe wenn BUY: Dient zur Einstellung der Textfarbe in bullischen Situationen;
Textfarbe bei VERKAUF: Dient zur Einstellung der Textfarbe in bärischen Situationen;
Farbe der StopLoss-Linie: Dient zur Einstellung der Farbe der Linie, die das Stop-Loss-Niveau anzeigt;
Farbe der Retracements %-Linie: Hier kann die Farbe der Linie eingestellt werden, die das Retracement-Niveau anzeigt;
Farbe der Target-Linie: Hier können Sie die Farbe der Linie einstellen, die das Target-Niveau anzeigt;
Textfarbe bearbeiten: Hier können Sie die Farbe des Textes im Bearbeitungsfenster einstellen;
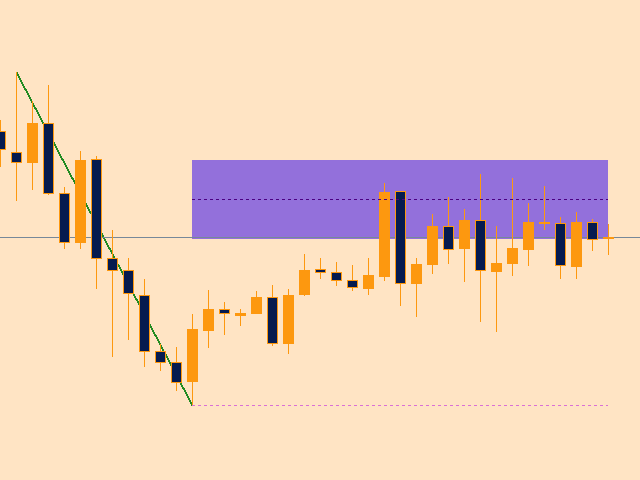
Bereich anzeigen: Wenn diese Option aktiviert ist, wird ein Bereich um die Retracement-Linie gezeichnet;
Bereichsbreite in %: Hier können Sie die Breite des Bereichs um die Retracement-Linie in Prozent angeben;
Farbe des Bereichs: Hier können Sie die Farbe des Bereichs um die Retracement-Linie festlegen;
Schaltflächen Abstand X: Hier können Sie den Abstand des Tastenfeldes von der Ordinatenachse einstellen;
Abstand Y-Tasten: Mit diesen Tasten wird der Abstand des Tastenfeldes von der Ordinatenachse eingestellt.
Wenn Sie weitere Informationen oder Vorschläge zur Bedienung benötigen, schreiben Sie uns an info@followthegainstar.com.