Смотри обучающее видео по маркету на YouTube
Как купить торгового робота или индикатор
Запусти робота на
виртуальном хостинге
виртуальном хостинге
Протестируй индикатор/робота перед покупкой
Хочешь зарабатывать в Маркете?
Как подать продукт, чтобы его покупали
Технические индикаторы для MetaTrader 4 - 23

Introduction
The Convergence Divergence Suite contains 17 indicators , built-in MT4 technical indicators and custom ones . The list will be increased in subsequent versions as per users' requests. Any selected indicator is loaded on your chart then automatic Convergence and Divergence trend lines are drawn on the chart and indicator. This tool is important if you use any of the listed indicators or convergence/divergence in your strategy. Advantages With the Convergence Divergence Suite you d

Welcome to the world of SMC (Smart Money Concepts) Trading, where we empower traders with the tools and knowledge to make smarter trading decisions. Our latest addition to our suite of trading tools is the SMC Trading Pro indicator, version 1.0. Key Features: Major Market Structure Identification with BODY break. Order Block must be in Major Swing ( not Small Swing ). Order Block with Fair Value Gap Detection. Order Block in Discount | Premium zone. Filter for only Bullish, Bearish or All Order

Fully featured Pivots and Levels indicator Pivots: Floor (normal), Woody, Camarilla, Fibonacci Levels: ATR, Historical Volatility with standard deviations, Close Price Volatility with standard deviations
Features: 4 +/- levels MTF, pivots/levels based on Daily, Weekly, 4hr or even 15min Hour and minute time offset
Texts with prices and pip distances to central pivot/level Inputs for Camarilla/Fibonacci/ATR/Volatility levels
Alerts, popup, push, email, sound, live or completed candles on level c
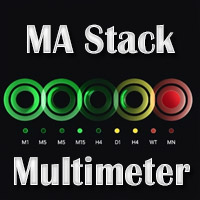
Basic MA Stack Indicator: This is a single timeframe & single currency indicator. It looks at MAs and show 3 possible states on chart: When all MA Align Upwards: Stack Up When all MA Align Downwards: Stack Down If MAs not aligned: Stack None Available for free here: https://www.mql5.com/en/market/product/69539
You can position the small block on your chart. And get current status of the Stack. It is simplistic and very eash to use and can guide you to find good trends in your strategies. Buy St
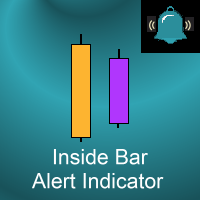
This indicator marks Inside Bars (bars with a lower high and a higher low than the previous bar) on your chart. It will also send alerts when one forms, including via e-mail or push notification to your phone . It's ideal for when you want to be notified of an inside bar set-up but don't want to have to sit in front of your chart all day. You can configure all the settings including: What symbol (if any) is plotted to highlight an inside bar Whether the symbol is plotted above the bar or below t
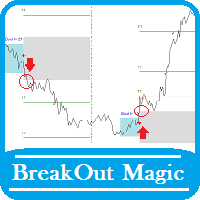
<< See how it works on YouTube >> You can also download the script of this indicator for free here: BreakOutMagic_EA.ex4 Then copy it to the following address: ...\MetaTrader 4\MQL4\Experts Note that in order for the script to work, it must have already downloaded and activated the Break Out Magic indicator from the market. Possibilities:
Arrow signal to buy, sell and hit the targets Alert signal send mail Execute custom audio file The Break Out Magic indicator monitors price fluctuations over

The GGP Wave Trend Oscillator MT4 Indicator is a volatility and momentum tool designed to help traders optimize their trading performance and providing traders find the most accurate market reversals. This indicator is MT4 conversion of the Indicator: WaveTrend Oscillator [WT] by “ LazyBear “ in Trading View website and some alert methods are added to provide real-time alerts when a trading signal is generated, in order to allow traders to act quickly and efficiently. When the oscillator is ab

Индикатор отображает основной тренд, зоны входа и зоны выхода. Это мульти-таймфреймовый индикатор, поэтому на текущем периоде старшего таймфрейма он перерисовывается.
Особенности Цветная гистограмма: указывает на основной тренд, красный означает медвежий рынок, голубой - бычий рынок. Внутренние синие полосы: зона входа в рынок, означает, что рынок относительно безопасен для входа. Наружные желтые полосы: зона выхода из рынка, рынок перепродан или перекуплен.
Параметры AutoMatchTimeFrame : при

The UT Bot Alert MT5 Indicator is an advanced technical analysis tool designed to help traders optimize their trading performance. This indicator is MT5 conversion of the UT Bot alerts indicator by “QuantNomad “ in Trading View website and some alert methods are added to provide real-time alerts when a trading signal is generated, in order to allow traders to act quickly and efficiently. Key Features: Alert Types: in addition to the terminal pop-up alerts, the mobile notification sends the alert
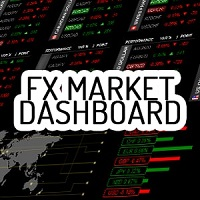
Fx Market Dashboard is a very innovative tool that features very professional graphics. Simplifying the reading of the market has always been our prerogative and we believe that with this tool everyone can better understand the market. This tool is mainly concerned with giving us a clear view of what are the strongest and weakest currencies, through this information we can begin to better understand where the market puts money or takes away money. The reading of the percentage logic serves to h

Индикатор Super oscillator является осциллятором, предназначенным для поиска точек разворота. Набор вычислений баров и набор алгоритмов расчета разворота тренда. Система поиска уровней с высоковероятными трендами. Все эти функции в совокупности облегчают инвесторам поиск трендов.
Рекомендации и возможности В индикаторе Super Oscillator имеется два уровня. Они находятся на уровнях 0,5 и -0,5. Для обнаружения восходящего тренда столбики осциллятора должны находится ниже уровня -0.5. Синие столбик

Этот советник не совершает никаких сделок, но он сканирует все символы в ваших обзорах рынка и сканирует каждую акцию одну за другой в разных таймфреймах, и в конце он показывает вам, какой символ в каком таймфрейме имеет мощную поглощающую свечу. Кроме того, вы можете определить период MA и верхний и нижний пределы RSI, и он показывает вам, какие символы, на каком таймфрейме, будут пересекать скорректированную скользящую среднюю, и какой символ, на каком таймфрейме, будет пересекать верхний или
FREE
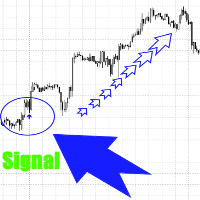
Данный индикатор не перерисовывает сигналы и это значит , что там, где он нарисует стрелку там она и останется. Сигналы рисуются здесь и сейчас, а не спустя время , когда цена прошла уже далеко.
Индикатор отлично подойдёт для трендового рынка.
Индикатор является помощником в торговле, он даёт сигнал на покупку или продажу, а вы принимаете решение использовать рекомендации индикатора или нет.
Цена на индикатор минимальна и может вырасти в любое время.
Работает на любых инструментах,таймфрейм

"The trend is your friend" is one of the oldest and best-known sayings in financial markets. However, this message only represents half of the picture. The correct saying should be, "The trend is your friend only until it ends." KT Trend Filter solves this problem by clearly indicating the start of an Uptrend and Downtrend using an averaging equation on the price series. If the trend direction is not clear, it shows the trend as sideways showing the uncertainty in the market.
Features
Get a big

Smooth Heikin Ashi provides a more smoothed signal of bull or bearish trends than regular Japanese candlesticks, or even the standard Heikin Ashi candles. Heikin Ashi as an alternative candlestick pattern that has been in use since its invention in Japan back in the 1700s. On normal Japanese candlesticks, there is a lot noise with mixed bearish and bullish candles side by side, even during trends. Heikin Ashi reduces this noise leaving an easier visual representation of trends. This indicator is

KT Trend Magic shows the trend depiction on chart using the combination of market momentum and volatility. A smoothing coefficient is used to smooth out the noise from the signal.It can be used to find out the new entries or confirm the trades produced by other EA/Indicators.
Usage
Drag n drop MTF scanner which scans for the new signals across multiple time-frames. Find new entries in the trend direction. Improve the accuracy of other indicators when used in conjunction. Can be used as a dynami

Contact me after payment to send you the User-Manual PDF File.
Double Top/Bottom Pattern
Double top and bottom patterns are chart patterns that occur when the underlying investment moves in a similar pattern to the letter "W" (double bottom) or "M" (double top). Double top and bottom analysis are used in technical analysis to explain movements in a security or other investment, and can be used as part of a trading strategy to exploit recurring patterns. Searching for this pattern among the cha
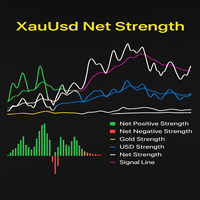
The XauUsd Net Strength indicator is a professional-grade market strength tool designed to track and compare the relative performance of Gold (XAU) against the U.S. Dollar (USD) across a diversified basket of currency pairs. Instead of relying on a single chart, it aggregates information from multiple gold- and dollar-based pairs, applies weighting factors, and translates the results into an easy-to-read strength comparison. The indicator plots six components in a separate window: Green & Red Hi

RSI Signals is a simple dashboard type indicator that displays the values of the RSI (Relative Strength Index) oscillator on various instruments and time frames chosen by the user. In addition, it can be configured by the trader to show signals when the RSI is in an overbought/oversold condition, when it crosses these levels or when it crosses the 50 level, which is important in some strategies. It is simple and easy to set up. By itself, it should not be used as a trading system since RSI signa
The Ichimoku indicator is an entire system by itself with an amazing win rate many traders feel that the chart looks like a mess when we add the indicator to the chart this is because there are too many elements present in the indicator we have a solution for that now "TT Ichimoku on off button indicator" ABOUT THIS INDICATOR This is an Ichimoku indicator that has the toggle feature separately for every element ie. Kumo cloud button, kijun button, etc... you can also hide/show the indicator

Display your Local Time on your charts
Display your local time instead of (or along with) MT4 server time.
Display crosshair which highlights current candle time.
Automatically adjusts based on chart zoom (zooming in or out).
Displays on every timeframe (M1 – Month), and auto-adjusts as chart timeframe is changed.
Handles special ½ hour time zones , such as India.
Renders fast (no lag) as you scroll charts.
Customize the font family, font size, background color, and crosshair col

Введение в алгоритм GARCH Improved Nelder Mead GARCH - это сокращение от Generalized Autoregressive Conditional Heteroskedasticity (Обобщенная авторегрессионная условная гетероскедастичность). Представляет собой модель прогнозирования волатильности, обычно применяемую в финансовой сфере. Модель GARCH впервые появилась в работе датского экономиста Тима Петера Боллерслева (Tim Peter Bollerslev) в 1986 году. Лауреат Нобелевской премии 2003 года Роберт Ф. Энгл внес огромный вклад в усовершенствовани
FREE
Chart Pattern Strategies Signals Indicator Version: 1.02
Overview The Chart Pattern Strategies Signals Indicator is a comprehensive dashboard for MetaTrader 4 designed to give traders a powerful, at-a-glance view of potential chart pattern setups across multiple markets. It monitors a customizable list of instruments in real-time, displaying clear, actionable information directly on your chart. This tool is built to assist manual traders by identifying and organizing high-probability trading si

Усовершенствованная мультитаймфреймовая версия скользящей средней Хала (Hull Moving Average) - дальнейшее развитие семейства индикаторов на базе HMA.
Особенности Графическая панель с данными индикатора HMA на всех таймфреймах одновременно. Если на каком-либо таймфрейме HMA переключил свое направление, на панели отображается вопросительный или восклицательный знак с текстовым и звуковым сообщением. Сообщения можно настраивать отдельно для каждого таймфрейма с помощью соответствующих чекбоксов.
Просматривайте и сравнивайте свопы всех символов, представленных в окне "Обзор рынка", в одной панели. Это полезная утилита для трейдеров, которые предпочитают использовать своп в своих интересах или просто избегают торговли против высоких свопов. Утилита может отображать нескорректированные значения свопов, свопы в процентах от среднего истинного диапазона (Average True Range, ATR) или в виде суммы валюты, которую вы будете получать при торговле на данном символе с заданным размером лота. Нажми

Трендовый индикатор МТ4 с вероятностью достижения прибыли 70-90%! Работает без перерисовки и запаздываний. Индикатор показывает хорошие результаты на всех торговых инструментах: валюты, металлы, индексы, акции, криптовалюты. Рекомендуемый таймфрейм: H1-H4.
Подробная информация об индикаторе здесь : https://www.mql5.com/ru/blogs/post/744634
Рекомендации по использованию
Используйте автоматическое определение периода Главной особенностью индикатора является функция самооптимизации.
Algorithmic & Quant Strategies Signals Dashboard for MT4 Take your forex trading to the next level with the AQS Signals Dashboard , a comprehensive and powerful tool designed for serious traders. This indicator eliminates the need to constantly switch between charts by providing a centralized, all-in-one dashboard that monitors the entire forex market for you. Built on a foundation of proven algorithmic and quantitative trading principles, the AQS Dashboard delivers clear, actionable trade signa
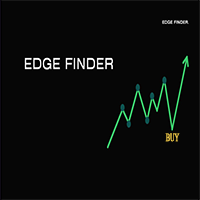
(Strikingly Simple, Powerfully Profitable) Edge Finder i s your all-in-one visual trading assistant, designed to cut through the market noise and highlight high-probability trading opportunities at a glance. How It Works (The Core Idea): Instead of overloading your chart with complex numbers, Edge Finder uses a unique, color-coded system to paint the market picture clearly. Trend & Momentum Visualization: The indicator analyzes the market and dynamically colors the price bars. Specific colors

Индикатор Институционального Потока Умный инструмент на основе объёма, который определяет зоны активности институциональных игроков через прямые паттерны потока ордеров.
Он показывает, где действуют крупные игроки. Продвинутый индикатор объёма, который фильтрует шум, чтобы выявлять вероятные институциональные паттерны. Основные характеристики Интеллектуальное обнаружение кластеров Автоматическая идентификация Классификация сигналов: Фиолетовый / Желтый – Институциональная зона – Сильная и устойч

Мультитаймфреймовый индикатор фракталов, который показывает фрактальные точки старшего таймфрейма на младших таймфреймах.
Параметры Fractal_Timeframe : старший таймфрейм для фракталов. Maxbar : максимальное количество свечей для вычислений. Up_Fractal_Color, Up_Fractal_Symbol, Down_Fractal_Color, Down_Fractal_Symbol : настройки цветов и стилей фрактальных точек. Extend_Line : рисовать горизонтальную линию из предыдущей фрактальной точки до перекрывающей ее свечи или до указанной длины. Extend_L
FREE
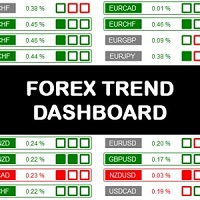
The Forex Trend Dashboard is a truly exceptional tool for analyzing and operating the choice of which exchange to try to trade. The analysis of currency baskets allows you to better understand the real situation of the market and better evaluate your own operational ideas. The dashboard analyzes the trend over different time horizons such as: daily, weekly and monthly. The resulting considerations are very simple, the session opening price and its strength condition are analyzed by recognizing t
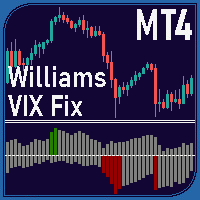
Overview The Williams VIX Fix Indicator is a MetaTrader 4 tool designed to help traders identify potential market tops and bottoms. By analyzing price extremes relative to recent highs and lows, it highlights overbought and oversold conditions using two histograms displayed in a separate window. The indicator combines the Williams VIX Fix calculation with Bollinger Bands and percentile-based thresholds to provide clear signals for potential reversals. Key Features Market Tops and Bottoms Market

Volume Oscilator is a popular indicator available in trading view which is very popular among traders Definition The Volume Oscillator is an indicator made up of two Moving Averages (MA) surrounding volume, one being fast and the other slow. The slow volume MA value is then subtracted from the value of the fastlow Moving Average. The Volume Oscillator measures volume by analyzing the relationship between the two Moving Averages mentioned. When combined with other indicators it provides a very st
FREE
Major FX Signal Panel ( AI Trade Planner's) - Professional Intraday Signal Dashboard Unlock Your Intraday Trading Potential with a Powerful, All-in-One Signal Dashboard. Are you tired of switching between charts and struggling to find high-probability intraday setups? This Panel is a professional-grade MetaTrader 4 indicator designed to give you a decisive edge. It scans seven major currency pairs in real-time and delivers a complete, data-driven trade plan directly on your chart. Stop guessin

MT5 Version MA Ribbon MT4 MA Ribbon is an enhanced indicator with 8 moving averages of increasing periods. MA Ribbon is useful to recognize trend direction, reversals and continuation points in the market as well as potential entry, partial take profit and exit points. Entry points for long and shorts position can be found when the price entries or leaves the Ribbon, at retest or a defined number of MA crossovers. It offers a good combination with mostly any volume or momentun indicators to f

简介
不重绘入场信号的趋势指标 显示精确的价格反转指标。是可以添加到任何图表中的交易武器。 反转信号有高度准确性,适合在5分钟进行剥头皮交易,或在30分钟波段交易。买入和卖出箭头在图表上显示为进入信号,但在K线结束后形成带有警报的确认选项。 很多交易者在Super Trend MT4指标的帮助下,在第一个交易周内改善了交易结果。 优点
不重新绘制仪表板箭头 仅适用于台式机MT5 适合剥头皮 适合波段交易 仪表板箭头输入警报 仪表板箭头信号严格警告“蜡烛图收盘关闭” 移动警报、桌面警报、电子邮件警报 显示任意时间段的箭头 适用于任何Mt4货币对 适合新手和专家交易员 设置 Period: 周期 Multiplier: 倍增器 Show Trend Line : 显示趋势线 Show Arrow: 显示箭头 关于我们 欲了解更多我们产品信息,请 点击这里
FREE

Индикатор Camarilla Pivots Historical строит на графике исторические данные по уровням пивотов Камарилья. Уровни пивотов Камарилья были разработаны в 1989 году Ником Скоттом. Эти уровни используются в качестве основных уровней поддержки и сопротивления при внутридневной торговле. Уровни вычисляются по следующей формуле: R4 = C + RANGE * 1.1/2 R3 = C + RANGE * 1.1/4 R2 = C + RANGE * 1.1/6 R1 = C + RANGE * 1.1/12 PP = (HIGH + LOW + CLOSE) / 3 S1 = C - RANGE * 1.1/12 S2 = C - RANGE * 1.1/6 S3 = C -
FREE
25% off. Original price: $40 RSI Scanner is a multi symbol multi timeframe RSI dashboard that monitors Relative Strength Index indicator for price entering and exiting overbought and oversold in up to 28 symbols and 9 timeframes.
Download Demo here (Scans only M1 and M5) Settings description here MT5 version here
RSI Scanner features: Signals RSI entering and exiting the overbought and oversold zones. Monitors 28 customizable instruments and 9 timeframes at the same time. You can choose

Не перерисовывающийся канал для трендовой торговли. Строится по ATR и имеет противоположную границу волатильности. Индикатор хорошо зарекомендовал себя в стратегии по импульсным уровням и ложным пробоям. Точку входа следует искать на коррекции к линии индикатора, а тейк-профит устанавливать на противоположной границе. Blog-Link - Retest and Fake Breakout with UPD1 .
Входные параметры.
Bars Count - история для отображения. ATR - период для расчёта. Coefficient - коэффициент, влияющий н
FREE

Поведение разных валютных пар взаимосвязано. Индикатор Visual Correlation позволяет на 1 графике отображать разные инструменты с сохранением масштаба. Вы можете определить положительную, отрицательную корреляцию или ее отсутствие. Некоторые инструменты начинают движение раньше остальных. Такие моменты можно определить при наложении графиков. Для отображения инструмента на графике в поле Symbol необходимо ввести его название. Версия для МТ5 https://www.mql5.com/ru/market/product/109155
FREE

The indicator is based on the concept of price channels, which are formed by plotting the highest high and lowest low prices over a specified period of time. The Donchian Channel Indicator consists of three lines: an upper channel line, a lower channel line, and a middle channel line. The upper channel line represents the highest high over a specified period, while the lower channel line represents the lowest low. The middle channel line is the average of the two and can be used as a reference f
FREE

This indicator plots another symbol on the current chart. A different timeframe can be used for the symbol, with an option to display in multiple timeframe mode (1 overlay candle per several chart candles). Basic indicators are provided. To adjust scaling of prices from different symbols, the overlay prices are scaled to the visible chart price space.
Features symbol and timeframe input MTF display option to vertically invert chart, eg overlay USDJPY, invert to show JPYUSD
data window values; o
FREE

MASi Three Screens основан на торговой стратегии Доктора Александра Элдера. Данный индикатор является сборником алгоритмов. Алгоритмы основаны на анализе графиков нескольких таймфреймов. Вы можете применить любой из предоставленных.
Список версий алгоритмов ThreeScreens v1.0 - Простая реализация, с анализом MACD линии; ThreeScreens v1.1 - Простая реализация, с анализом MACD гистограммы; ThreeScreens v1.2 - Совмещение двух первых алгоритмов в одной версии; ThreeScreens v1.2.1 - В алгоритм внедре
FREE

Dominate the Market with CCI Crossover Master! Stop guessing and start trading with confidence ! The CCI Crossover Master indicator is your secret weapon for capturing high-probability moves based on proven momentum and trend analysis. It simplifies the complex " CCI Crossover Master " strategy, giving you crystal-clear Buy and Sell signals directly on your chart. Key Advantages That Drive Your Success: Precision Entry Signals: Never miss a high-potential trade again. The indicator generates sh
FREE

This indicator applies the biquad high pass filter to the price-chart data, and displays the filter output for the OHLC as candlesticks. The candlesticks corresponds to the actual calculations of the filter value during the formation of each price bar (not from all historical highs lows or closes). The shape of the bars therefore corresponds directly to the shape of each price bar. High pass filters are an underappreciated type of oscillator that are seldom used in technical analysis in the st
FREE

Индикатор фрактал - один из основных в различных стратегиях. Индикатор Volume Fractals расширил функциональность стандартной версии, получил настройки фильтрации фракталов и отображение объемных фракталов, где объемный фрактал - это экстремум не только по цене, но и максимум по объему.
Применение Установка стоп-лоссов Сигнал на разворот Установка отложенных ордеров на пробой фрактала
Настройки Bars of history - количество баров графика, для которых рисуется индикатор Left side minimum bars - м
FREE
Download the free USDJPY version here.
MACD Indicator The Moving Average Convergence and Divergence (MACD) is a trend following momentum indicator which shows the relationship between two moving averages that we chose and configure them on the indicator. The MACD is calculated by subtracting the 26-period exponential moving average and the 12 period D.A.M. These are the default parameters when you put the MACD indicator on the charts, and the period is usually 9 which means the last 9 candles

"Как хорошо было бы иметь индикатор, который подсказывает, входит ли цена актива в тренд или находится во флете, позволяя игнорировать ложные прорывы и рыночный "шум" и сконцентрироваться на реальном движении!" Choppiness Index – ненаправленный индикатор для определения флетовости/трендовости рынка. Он осциллирует между значениями -50 (очень трендовый) и +50 (очень флетовый). Индикатор Choppiness Index позволяет реализовать несколько стратегий: 1. 1. Покупка/продажа на прорыве при отскоке от экс

The indicator displays two Moving Average lines on the chart with parameters specified in the settings. It issues a signal in the form of arrows and a sound at the intersection of these Moving Average. In the indicator settings, you can set the period of fast Moving Average ( Fast MA Period ) and slow Moving Average ( Slow MA Period ). And also Shift, Applied Price, Method and Timeframe for two Moving Averages separately. Important:
The main difference from othe
FREE

MT5 Version Elliot Wave Oscillator MT4 Elliot Wave Oscillator MT4 is an indicator designed to support Elliot Wave counts. The default settings help filtering out the noise in the market allowing a clear perception for the waves counts in differnt timeframes. Elliot Wave Oscillator high customization level allows the you to optimize this indicator to your personal preferences. Shorter Periods and faster reactive MAs will provide more infomation but will require a higher level of experience for

Название продукта Smart Bollinger Bands (MT4) – часть серии SmartView Краткое описание Индикатор Bollinger Bands с уникальным пользовательским опытом на платформе MetaTrader. Предоставляет расширенные возможности, ранее недоступные, такие как открытие настроек двойным кликом, скрытие и отображение индикаторов без удаления, и отображение окна индикатора на весь размер графика. Разработан для работы вместе с остальными индикаторами серии SmartView. Обзор Серия SmartView предлагает уникальный и отл
FREE

Donchian通道(唐奇安通道指标)是用于交易突破的最古老、最简单的技术指标之一。 一般来说,唐奇安通道的宽度越宽,市场波动就越大,而唐奇安通道越窄,市场波动性也就越小 。此外,价格走势可以穿过布林带,但你看不到唐奇安通道的这种特征,因为其波段正在测量特定时期的最高价和最低价。 交易实用必备工具指标 波浪自动计算指标,通道趋势交易 完美的趋势-波浪自动计算通道计算 , MT4版本 完美的趋势-波浪自动计算通道计算 , MT5版本 本地跟单复制交易 Easy And Fast Copy , MT4版本 Easy And Fast Copy , MT5版本 本地跟单复制交易 模拟试用 Easy And Fast Copy , MT4 模拟账号运行 Easy And Fast Copy , MT5 模拟账号运行 唐奇安通道指标计算: 唐奇安上阻力线 - 由过去N天的当日最高价的最大值形成。 唐奇安下支撑线 - 由过去N天的当日最低价的最小值形成。 中心线 - (上线 + 下线)/ 2 唐奇安通道信号 唐奇安通道常用作突破指标。它提供了两种主要类型的突破信号,一个是上阻力线或下支撑线
FREE

This indicator is very useful for day traders or short term traders. No need to calculate the number of pips manually, just look at the chart and you will see the Virtual Take Profit / Virtual Stop Loss target line and evaluate whether the entry point is feasible to reach the intended target or not.
Enter the intended Take Profit / Stop Loss pips for your trade. The indicator will display Virtual Take Profit / Virtual Stop Loss lines for you to easily see if the target is feasible or not.
FREE

This Indicator is based on Mr. Dan Valcu ideas.
Bodies of candles(open-close) are the main component used to indicate and assess trend direction, strength, and reversals.
The indicator measures difference between Heikin Ashi close and open.
Measuring the height of candle bodies leads to extreme values that point to trend slowdowns. Thus quantifies Heikin Ashi to get earlier signals.
I used this indicator on Heiken Ashi charts but, it's possible to choose to calculate Body size based on Heik
FREE

40% off. Original price: $50
Ichimoku Trend Finder is a multi symbol multi timeframe trend dashboard that helps traders to monitor and identify potential market trends from one chart. This panel scans the Ichimoku Kinko Hyo indicator in 28 configurable instruments and 9 timeframes for classic Ichimoku trend signals with a deep scan feature to scan all market watch symbols (up to 1000 instruments!).
Download Demo here (Scans only M1 and M5) Settings description here MT5 version here

Easily access to a deep knowledge of the market movement with "M.M. Deepness Arrows"!! This indicator will give you advices on buys and sells after having analized the deepness of the market. The entrance "trigger" will be given after studying each candles' max and min avoiding, this way, the misleading data released by the opening and closure prices (given by the brokers). Thanks to the use of these arrows you'll be able to easily understand if i'ts the right time to buy or sell. If you want th

Dominate the Market with Reversal Dominator! Tired of chasing trends only to get caught in a sudden reversal? Reversal Dominator is your ultimate weapon for spotting high-probability market turns before they become obvious. This powerful indicator leverages a sophisticated Absolute Strength calculation, paired with an intelligent moving average filter, to give you the precise edge needed to enter or exit trades with confidence. Why Choose Reversal Dominator? Pinpoint Reversals: Never miss a cr
FREE
Powerful Order Block indicator in Tradingview platform. Indicator type: Price Action indicator Introduction: The Order Block Indicator - Elevating Your Price Action Analysis. If you're seeking a comprehensive Order Block indicator on the MQL5 platform, look no further.
Firstly, according to this indicator, an OB is understood as a zone of pending orders from large institutions that haven't been fully executed, revealing themselves in the market through subtle signs. Prices react strongly whe

Stop Guessing, Start Sniping: Introducing SR Sniper! Tired of entry points that seem random? The SR Sniper indicator is your new essential tool for finding high-probability trades with surgical precision. It's designed to cut through the market noise, giving you clear Buy and Sell signals right at the most critical price zones. This powerful indicator combines the dynamic analysis of the Commodity Channel Index (CCI) with automatic Support and Resistance (S/R) detection —and then filters everyt
FREE

This dashboard shows you the 3MA Cross Overs current status for Multi-currency multi-timeframes. Works for Metatrader 4 (MT4) platform. Detailed Post:
https://www.mql5.com/en/blogs/post/759238
How it Works:
MA Cross Signals It will show “S” Green/Red Strong Signals and “M” or “W” Green/Red Medium or Weak signals. We have 3 types of MA: Faster, Medium and Slower MA. A strong signal is when FasterMA and MediumMA are both above/below SlowerMA. A medium signal is when only FasterMA is above/below

Heiken Ashi Button Heiken-Ashi , often spelled Heikin-Ashi, is a Japanese word that means "Average Bar." The Heiken-Ashi approach can be used in conjunction with candlestick charts to spot market trends and forecast future prices. It's useful for making candlestick charts easier to read and analysing patterns. Traders can use Heiken-Ashi charts to determine when to stay in trades while the trend continues and close trades when the trend reverses. The majority of earnings are made when markets a
FREE
Highly configurable Accumulation and Distribution (AD) indicator. Features: Highly customizable alert functions (at levels, crosses, direction changes via email, push, sound, popup) Multi timeframe ability Color customization (at levels, crosses, direction changes) Linear interpolation and histogram mode options Works on strategy tester in multi timeframe mode (at weekend without ticks also) Adjustable Levels Parameters:
Ad Timeframe: You can set the lower/higher timeframes for Ad. Ad Bar Shif
FREE

Download directly the indicator file here. (if you can't open on MT4) MACD Indicator is one of the most popular momentum indicators among users. Searching and detecting MACD signals by the eye may not be easy. Scan Full Charts Dashboard Indicator with simple user interface and search customization panel saves time and scans all charts for MACD signals search and notifies the user with high accuracy. After finding the signal, the user was aware of the result by alerts and notifications. This ind
FREE
28-символьная, мультитаймфреймовая мощная панель для полного обзора рынка Настраиваемые оповещение о сигналах на покупку/продажу, push-уведомления, оповещения по email и всплывающее сообщение на экране. Обозначение сигналов на покупку и продажу Двухцветная трендовая гистограмма. Commodity channel index (CCI) - это осциллятор, изначально введенный Дональдом Ламбертом в 1980 году. CCI измеряет текущий уровень цены по отношению к среднему уровню цены в течение заданного периода времени. CCI находи
FREE

Индикатор My Big Bars (мои большие бары) показывает бары (свечи) более старшего таймфрейма. То есть, если открыт график с таймфреймом H1 (один час), индикатор "подкладывает" снизу график с таймфреймом H4, D1 и так далее. Используются следующие старшие таймфреймы: M3, M5, M10, M15, M30, H1, H3, H4, H6, H8, H12, D1, W1 и MN1. Индикатор автоматически подбирает только те старшие таймфреймы, которые больше текущего и кратны ему. Если открыт график с таймрфеймом M30 (30 минут), то среди старших таймфр
FREE
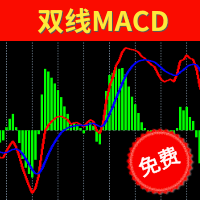
Two Lines MACD Many people who conduct technical transactions on MT4 like to use MACD to judge the turning or continuation of the market. When everyone uses the MACD indicator that comes with MT4, they find that the indicator is a single-line MACD, and the histogram seems to be similar to the past. The MACD that I understand does not match. In order to provide traders with a perfect trading experience, we especially provides free two-line MACD indicators for all traders! The single line in the
FREE

Индикатор IceFX Heatmap показывает участки на графике, на которых цена наиболее долго оставалась в боковике в пределах последних нескольких дней. Такие участки отображаются в стиле тепловой карты ("Heatmap style"), наглядно демонстрируя основные уровни. Участки, на которых цена задерживалась наиболее долго, показаны более светлым цветом (при черно-белом отображении) или красным цветом (при цветном отображении).
Настройки Days - количество дней, для которых рассчитывается тепловая карта. Resolut
FREE

Если вам нравится этот проект, оставьте 5-звездочный обзор. Торговля большими объемами требует, чтобы мы рассмотрели несколько
инструментов/чартов для
найти новые возможности, этот показатель поможет вам при составлении конкретных
уровни множественным числом или его суффиксом и обновлять их автоматически
как изменение цены, задача, которая в противном случае будет утомительной. Например, на GBPUSD вы могли бы иметь 4 экземпляра индикатора на
диаграмма к сюжету: Каждый интервал 0,01 с длиной лин
FREE

Индикатор Supertrend Line выявляет тренд при помощи расчетов на основе ATR.
Как она работает? Supertrend рисует линию, следующую за текущим трендом. Эта линия строится на основе расчетов по ATR. Линия под свечой означает вероятность бычьего тренда Линия над свечой означает вероятность медвежьего тренда
Как торговать с индикатором CSL Покупайте, когда линия Supertrend находится ниже уровня цены, и продавайте, когда линия Supertrend находится выше уровня цены. Настоятельно рекомендуется использо
FREE
Highly configurable Trader Dynamic Index (TDI) indicator.
Features: Highly customizable alert functions (at levels, crosses, direction changes via email, push, sound, popup) Multi timeframe ability (higher and lower timeframes also) Color customization (at levels, crosses, direction changes) Linear interpolation and histogram mode options Works on strategy tester in multi timeframe mode (at weekend without ticks also) Adjustable Levels Parameters:
TDI Timeframe: You can set the lower/higher ti
FREE
MetaTrader Маркет - торговые роботы и технические индикаторы для трейдеров, доступные прямо в терминале.
Платежная система MQL5.community разработана для сервисов платформы MetaTrader и автоматически доступна всем зарегистрированным пользователям сайта MQL5.com. Ввод и вывод денежных средств возможен с помощью WebMoney, PayPal и банковских карт.
Вы упускаете торговые возможности:
- Бесплатные приложения для трейдинга
- 8 000+ сигналов для копирования
- Экономические новости для анализа финансовых рынков
Регистрация
Вход
Если у вас нет учетной записи, зарегистрируйтесь
Для авторизации и пользования сайтом MQL5.com необходимо разрешить использование файлов Сookie.
Пожалуйста, включите в вашем браузере данную настройку, иначе вы не сможете авторизоваться.