Guarda i video tutorial del Market su YouTube
Come acquistare un Robot di Trading o un indicatore
Esegui il tuo EA
hosting virtuale
hosting virtuale
Prova un indicatore/robot di trading prima di acquistarlo
Vuoi guadagnare nel Market?
Come presentare un prodotto per venderlo con successo
Indicatori tecnici per MetaTrader 4 - 23
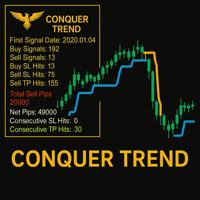
Conquer Trend – Master the Trend Like Never Before! Conquer Trend is your ultimate solution for dominating the markets with precision and simplicity. Built for traders who want to ride the strongest trends across any pair and any time frame, this powerful indicator brings together trend detection, retest confirmation, and performance tracking — all in one streamlined tool.
Multi-Timeframe Trend Analysis Get a clear view of the trend across multiple timeframes. Whether you're scalping, day tra

In the ever-evolving world of Forex trading, understanding the different trading sessions is paramount to making informed trading decisions. Each trading session brings its own unique characteristics, opportunities, and challenges, and recognizing these can greatly enhance your trading strategies. Whether you're a novice or a seasoned trader, the Forex market's three main trading sessions – Asian, London, and New York – are crucial milestones that dictate market behavior and potential trade set

Tick Speed Pro povides a charted record of tick speed to allow you to see the ebb and flow of market activity. Observing patterns in tick speed may allow you to better time entries to reduce slippage and re-quotes.
The tick speed plot updates it's entire position to show you only the last N seconds you choose, ideal for scalping and HFT approaches. An alert is provided to signal when the instrument is getting ticks at a higher rate than the alert limit. Multiple loadings are supported to compare

Offer 249 down from 350 for the next 3 copies. then back to 350 $
Are you tired of using outdated indicators that leave you guessing where to set your profit targets? Look no further than the AK CAP Opening Range Breakout Indicator. This powerful tool is backed by a US patent and has already helped countless traders pass funded challenges like FTMO. We use it daily on our prop traders and internal funds, and now it's available to you as well. The calculation behind the indicator is incredibly a

MACD is probably one of the most popular technical indicators out there. When the market is trending, it actually does a pretty good job, but when the market starts consolidating and moving sideways, the MACD performs not so well. SX Impulse MACD for MT5 is available here . Impulse MACD is a modified version of MACD that works very well for trading Forex, stocks, and cryptocurrencies. It has its own unique feature which perfectly filters out the values in a moving average range and enables it t

Why the RSI Alert Indicator is Essential for Your Trading Toolkit
In the fast-paced world of trading, timely and accurate information is crucial. The RSI Alert Indicator is a powerful tool designed to help you stay ahead of the market by providing real-time alerts when the Relative Strength Index (RSI) reaches critical levels. Whether you're a novice trader or a seasoned professional, this indicator can significantly enhance your trading strategy by pinpointing potential market reversals with

Gioteen Volatility Index (GVI) - your ultimate solution to overcoming market unpredictability and maximizing trading opportunities. This revolutionary indicator helps you in lowering your losing trades due to choppy market movements. The GVI is designed to measure market volatility, providing you with valuable insights to identify the most favorable trading prospects. Its intuitive interface consists of a dynamic red line representing the volatility index, accompanied by blue line that indicat
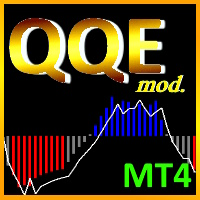
The Quantitative Qualitative Estimation (QQE) indicator is derived from Wilder’s famous Relative Strength Index (RSI). In essence, the QQE is a heavily smoothed RSI.
Modification of this version: ( converted from tradingview script by Mihkell00, original from Glaz, 100% identical output)
So there are Two QQEs. One that is shown on the chart as columns, and the other "hidden" in the background which also has a 50 MA bollinger band acting as a zero line.
When both of them agree - y
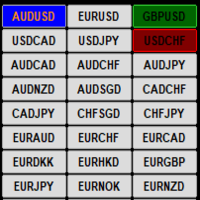
This indicator display current profit/loss status for each pair visually on a single chart. If the current open chart pair is selected and a trade/s are opened for that pair only the Symbol name is highlighted and the button color reflects the current trade/s status if the selected chart pair does not have any open trades then the button color is Blue. The input options are :
1/ Select Pairs automatically from the Market Watch
2/ Manually select your own Pairs
3/ Select all MT4 Timeframes aut

Indicator finds most prominent extremums (highs and lows) in history and displays their price levels for currently visible range of prices. 8 levels are shown at most. This is a tool for those who used to lookup the history for important levels formed by reversal points outliers. If price scale is changed manually or adjusted automatically for changes in time scale, indicator visualize all found levels (if any) inside visible area. The width (importance) of a level depends from a number of times
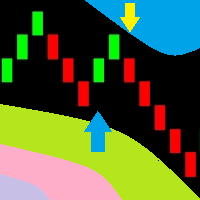
You can now use the conventional price charts to display Renko bars. This indicator can send dialog boxes with alerts, push notifications to mobile devices and emails. You can easily use this indicator to create Expert Advisors, because the indicator uses buffers.
Indicator parameters Renko size, points - size of Renko bars Arrows gap, points - distance to the signal arrows Alerts - true/false - use pop-up alerts when signals appear Push notifications - send Push notifications to the mobile ter

The indicator compares Fractal and Zigzag indicators to define hard Support and Resistance. The arrow signal appears when a new support or resistance emerges or when the price breaks through Support and Resistance zone. This indicator is efficient in conjunction with a rebound and breakout strategy. It works well on H4 and D1 for all pairs.
Settings BarCounts = 200; FastPeriod = 7 - fast period SlowPeriod = 14 - slow period Show_SR = true - show support/resistance Show_Arrows = true - show up/d

Instant Pitchfork is built for traders who rely on quick and precise pitchfork trend structures to plan entries, stops, and targets. Click an anchor on the chart and Instant Pitchfork automatically draws the best-fit Andrews’ Pitchfork for the current market structure.
Click the anchor again to instantly switch between Andrews’, Schiff, and Modified Schiff pitchfork modes to find the best structural fit in seconds. Works on any symbol and any timeframe.
Instant Pitchfork — Quick Manual 1. Atta
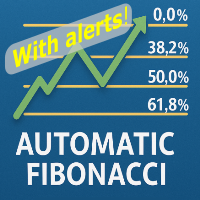
Automatic fibonacci with alerts is an indicator that automatically plots a fibonacci retracement based on the number of bars you select on the BarsToScan setting in the indicator. The fibonacci is automatically updated in real time as new highest and lowest values appear amongst the selected bars. You can select which level values to be displayed in the indicator settings. You can also select the color of the levels thus enabling the trader to be able to attach the indicator several times with d

The indicator visualizes the result of the CalculateScientificTradePeriod script (which, of course, also needs to be downloaded), which, firstly , estimates how many Mx bars of the active chart the future trend will most likely continue and what is its quality, and, secondly , calculates the optimal the averaging period (which is also equal to Mx) of the ScientificTrade indicator, which gives the maximum profit according to the extremely effective ScientificTrade strategy. For the FindS
Introduction
The Convergence Divergence Suite contains 17 indicators , built-in MT4 technical indicators and custom ones . The list will be increased in subsequent versions as per users' requests. Any selected indicator is loaded on your chart then automatic Convergence and Divergence trend lines are drawn on the chart and indicator. This tool is important if you use any of the listed indicators or convergence/divergence in your strategy. Advantages With the Convergence Divergence Suite you d

Welcome to the world of SMC (Smart Money Concepts) Trading, where we empower traders with the tools and knowledge to make smarter trading decisions. Our latest addition to our suite of trading tools is the SMC Trading Pro indicator, version 1.0. Key Features: Major Market Structure Identification with BODY break. Order Block must be in Major Swing ( not Small Swing ). Order Block with Fair Value Gap Detection. Order Block in Discount | Premium zone. Filter for only Bullish, Bearish or All Order

Fully featured Pivots and Levels indicator Pivots: Floor (normal), Woody, Camarilla, Fibonacci Levels: ATR, Historical Volatility with standard deviations, Close Price Volatility with standard deviations
Features: 4 +/- levels MTF, pivots/levels based on Daily, Weekly, 4hr or even 15min Hour and minute time offset
Texts with prices and pip distances to central pivot/level Inputs for Camarilla/Fibonacci/ATR/Volatility levels
Alerts, popup, push, email, sound, live or completed candles on level c
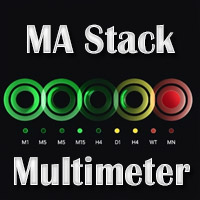
Basic MA Stack Indicator: This is a single timeframe & single currency indicator. It looks at MAs and show 3 possible states on chart: When all MA Align Upwards: Stack Up When all MA Align Downwards: Stack Down If MAs not aligned: Stack None Available for free here: https://www.mql5.com/en/market/product/69539
You can position the small block on your chart. And get current status of the Stack. It is simplistic and very eash to use and can guide you to find good trends in your strategies. Buy St
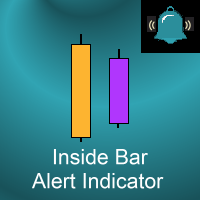
This indicator marks Inside Bars (bars with a lower high and a higher low than the previous bar) on your chart. It will also send alerts when one forms, including via e-mail or push notification to your phone . It's ideal for when you want to be notified of an inside bar set-up but don't want to have to sit in front of your chart all day. You can configure all the settings including: What symbol (if any) is plotted to highlight an inside bar Whether the symbol is plotted above the bar or below t
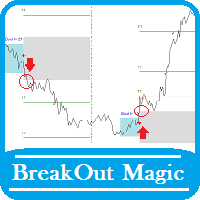
<< See how it works on YouTube >> You can also download the script of this indicator for free here: BreakOutMagic_EA.ex4 Then copy it to the following address: ...\MetaTrader 4\MQL4\Experts Note that in order for the script to work, it must have already downloaded and activated the Break Out Magic indicator from the market. Possibilities:
Arrow signal to buy, sell and hit the targets Alert signal send mail Execute custom audio file The Break Out Magic indicator monitors price fluctuations over

The GGP Wave Trend Oscillator MT4 Indicator is a volatility and momentum tool designed to help traders optimize their trading performance and providing traders find the most accurate market reversals. This indicator is MT4 conversion of the Indicator: WaveTrend Oscillator [WT] by “ LazyBear “ in Trading View website and some alert methods are added to provide real-time alerts when a trading signal is generated, in order to allow traders to act quickly and efficiently. When the oscillator is ab

This indicator shows main trend, entry zone and exit zone. This is a muti-timeframe indicator, so it is always repainting in the current period of the higher timeframe.
Features Colorful Histogram: it indicates the main trend, the tomato means the market is bearish,and the sky blue means the market is bullish. Inner Blue Bands: it is entry zone for entry market, the market is relatively safe for entry. Outer Yellow Bands: it is exit zone for exit market, the market is oversold or overbought.

The UT Bot Alert MT5 Indicator is an advanced technical analysis tool designed to help traders optimize their trading performance. This indicator is MT5 conversion of the UT Bot alerts indicator by “QuantNomad “ in Trading View website and some alert methods are added to provide real-time alerts when a trading signal is generated, in order to allow traders to act quickly and efficiently. Key Features: Alert Types: in addition to the terminal pop-up alerts, the mobile notification sends the alert
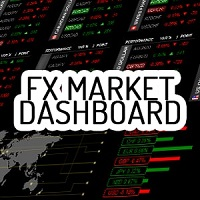
Fx Market Dashboard è uno strumento innovativo che presenta una grafica molto professionale. Semplificare la lettura del mercato è sempre stata una nostra prerogativa e crediamo che con questo strumento tutti possano capire meglio il mercato. Questo strumento si occupa principalmente di darci una visione chiara di quali sono le valute più forti e più deboli, attraverso queste informazioni possiamo iniziare a capire meglio dove il mercato mette denaro o porta via denaro.
La lettura della logica

Super oscillator indicator is an oscillator designed to calculate trend reversal points. A set of bar calculations and a set of algorithms to calculate trend reversals. Level probing system with high probability trends. All of these features combine to make it easier for investors to find trends.
Suggestions and Features There are two levels on the super oscillator indicator. They are at levels of 0.5 and -0.5. The oscillator bar should be below -0.5 to find the upward trend. And a blue color t

Questo consulente esperto non esegue alcuna operazione, ma esegue la scansione di tutti i simboli nel tuo orologio di mercato e scansiona ciascuna azione una per una in tempi diversi e alla fine ti mostra quale simbolo in quale periodo di tempo ha una potente candela avvolgente.
Inoltre, puoi definire un periodo MA e un limite RSI alto e basso, e ti mostra quali simboli in quale intervallo di tempo attraverserà la media mobile regolata e quale simbolo in quale intervallo di tempo attraverserà
FREE
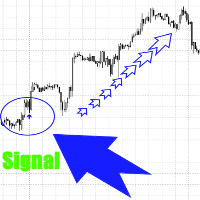
Данный индикатор не перерисовывает сигналы и это значит , что там, где он нарисует стрелку там она и останется. Сигналы рисуются здесь и сейчас, а не спустя время , когда цена прошла уже далеко.
Индикатор отлично подойдёт для трендового рынка.
Индикатор является помощником в торговле, он даёт сигнал на покупку или продажу, а вы принимаете решение использовать рекомендации индикатора или нет.
Цена на индикатор минимальна и может вырасти в любое время.
Работает на любых инструментах,таймфрейм

"The trend is your friend" is one of the oldest and best-known sayings in financial markets. However, this message only represents half of the picture. The correct saying should be, "The trend is your friend only until it ends." KT Trend Filter solves this problem by clearly indicating the start of an Uptrend and Downtrend using an averaging equation on the price series. If the trend direction is not clear, it shows the trend as sideways showing the uncertainty in the market.
Features
Get a big

Smooth Heikin Ashi provides a more smoothed signal of bull or bearish trends than regular Japanese candlesticks, or even the standard Heikin Ashi candles. Heikin Ashi as an alternative candlestick pattern that has been in use since its invention in Japan back in the 1700s. On normal Japanese candlesticks, there is a lot noise with mixed bearish and bullish candles side by side, even during trends. Heikin Ashi reduces this noise leaving an easier visual representation of trends. This indicator is

KT Trend Magic shows the trend depiction on chart using the combination of market momentum and volatility. A smoothing coefficient is used to smooth out the noise from the signal.It can be used to find out the new entries or confirm the trades produced by other EA/Indicators.
Usage
Drag n drop MTF scanner which scans for the new signals across multiple time-frames. Find new entries in the trend direction. Improve the accuracy of other indicators when used in conjunction. Can be used as a dynami

Contact me after payment to send you the User-Manual PDF File.
Double Top/Bottom Pattern
Double top and bottom patterns are chart patterns that occur when the underlying investment moves in a similar pattern to the letter "W" (double bottom) or "M" (double top). Double top and bottom analysis are used in technical analysis to explain movements in a security or other investment, and can be used as part of a trading strategy to exploit recurring patterns. Searching for this pattern among the cha
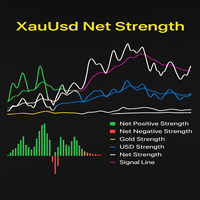
The XauUsd Net Strength indicator is a professional-grade market strength tool designed to track and compare the relative performance of Gold (XAU) against the U.S. Dollar (USD) across a diversified basket of currency pairs. Instead of relying on a single chart, it aggregates information from multiple gold- and dollar-based pairs, applies weighting factors, and translates the results into an easy-to-read strength comparison. The indicator plots six components in a separate window: Green & Red Hi

RSI Signals is a simple dashboard type indicator that displays the values of the RSI (Relative Strength Index) oscillator on various instruments and time frames chosen by the user. In addition, it can be configured by the trader to show signals when the RSI is in an overbought/oversold condition, when it crosses these levels or when it crosses the 50 level, which is important in some strategies. It is simple and easy to set up. By itself, it should not be used as a trading system since RSI signa
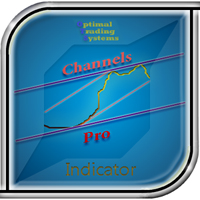
The indicator determines and plots price channels or lines, reading information from multiple timeframes (from current, second and third) simultaneously. Color and width of lines for each timeframe can be customized. It is also possible to set different distance between the Highs and Lows for plotting channels or lines.
Parameters History - maximum number of bars to plot channels or lines; Distance - minimum distance from one High (or Low) to another when plotting lines; Shift - shift for sever
The Ichimoku indicator is an entire system by itself with an amazing win rate many traders feel that the chart looks like a mess when we add the indicator to the chart this is because there are too many elements present in the indicator we have a solution for that now "TT Ichimoku on off button indicator" ABOUT THIS INDICATOR This is an Ichimoku indicator that has the toggle feature separately for every element ie. Kumo cloud button, kijun button, etc... you can also hide/show the indicator

Display your Local Time on your charts
Display your local time instead of (or along with) MT4 server time.
Display crosshair which highlights current candle time.
Automatically adjusts based on chart zoom (zooming in or out).
Displays on every timeframe (M1 – Month), and auto-adjusts as chart timeframe is changed.
Handles special ½ hour time zones , such as India.
Renders fast (no lag) as you scroll charts.
Customize the font family, font size, background color, and crosshair col
Chart Pattern Strategies Signals Indicator Version: 1.02
Overview The Chart Pattern Strategies Signals Indicator is a comprehensive dashboard for MetaTrader 4 designed to give traders a powerful, at-a-glance view of potential chart pattern setups across multiple markets. It monitors a customizable list of instruments in real-time, displaying clear, actionable information directly on your chart. This tool is built to assist manual traders by identifying and organizing high-probability trading si

This is an advanced multi-timeframe version of the popular Hull Moving Average (HMA). Features Graphical panel with HMA indicator data from all timeframes at the same time . If the HMA has switched its direction on any timeframe, a question mark or exclamation mark is displayed on the panel, accompanied by a text and audio message. The messages can be configured separately for each timeframe using the corresponding checkboxes.
The indicator is located in a separate window, so as not to overload
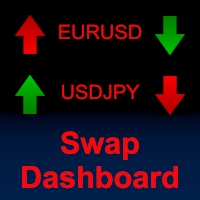
View and compare the swaps of all symbols in the Market Watch in one dashboard. A helpful tool for traders who like to use the swap to their advantage, or simply avoid trading against punishing swap rates. Choose whether you want to view the unedited swaps; adjust the swaps to show as a percentage of the Average True Range (ATR); or show the amount of currency you will get each day for trading the symbol using a given lot size. Sort the symbols by Name, or by their long or short swap value, by c

MT4 trend indicator with a probability of reaching a profit of 70-90%! Works without redrawing and delays. Trend Master PRO shows good results on all trading instruments: currencies, metals, indices, stocks, cryptocurrencies. Recommended timeframe: H1-H4.
More information about the indicator is here: https://www.mql5.com/en/blogs/post/744748
Recommendations for use
Use automatic period detection The main feature of the indicator is the self-optimization function.
Algorithmic & Quant Strategies Signals Dashboard for MT4 Take your forex trading to the next level with the AQS Signals Dashboard , a comprehensive and powerful tool designed for serious traders. This indicator eliminates the need to constantly switch between charts by providing a centralized, all-in-one dashboard that monitors the entire forex market for you. Built on a foundation of proven algorithmic and quantitative trading principles, the AQS Dashboard delivers clear, actionable trade signa
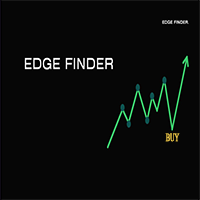
(Strikingly Simple, Powerfully Profitable) Edge Finder i s your all-in-one visual trading assistant, designed to cut through the market noise and highlight high-probability trading opportunities at a glance. How It Works (The Core Idea): Instead of overloading your chart with complex numbers, Edge Finder uses a unique, color-coded system to paint the market picture clearly. Trend & Momentum Visualization: The indicator analyzes the market and dynamically colors the price bars. Specific colors

Institutional Flow Indicator A smart volume-based tool that detects institutional activity zones through direct order flow patterns.
It reveals where large institutions operate. An advanced volume indicator that filters out noise to identify probable institutional patterns. Key Features Smart cluster detection Automatic identification Signal classification: Violet / Yellow – Institutional Zone – Strong, sustained institutional activity Red / Green – Strong Signal – Significant buying/selling pre
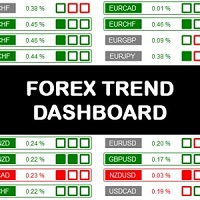
The Forex Trend Dashboard is a truly exceptional tool for analyzing and operating the choice of which exchange to try to trade. The analysis of currency baskets allows you to better understand the real situation of the market and better evaluate your own operational ideas. The dashboard analyzes the trend over different time horizons such as: daily, weekly and monthly. The resulting considerations are very simple, the session opening price and its strength condition are analyzed by recognizing t
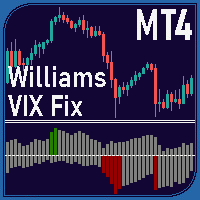
Overview The Williams VIX Fix Indicator is a MetaTrader 4 tool designed to help traders identify potential market tops and bottoms. By analyzing price extremes relative to recent highs and lows, it highlights overbought and oversold conditions using two histograms displayed in a separate window. The indicator combines the Williams VIX Fix calculation with Bollinger Bands and percentile-based thresholds to provide clear signals for potential reversals. Key Features Market Tops and Bottoms Market
Major FX Signal Panel ( AI Trade Planner's) - Professional Intraday Signal Dashboard Unlock Your Intraday Trading Potential with a Powerful, All-in-One Signal Dashboard. Are you tired of switching between charts and struggling to find high-probability intraday setups? This Panel is a professional-grade MetaTrader 4 indicator designed to give you a decisive edge. It scans seven major currency pairs in real-time and delivers a complete, data-driven trade plan directly on your chart. Stop guessin

MT5 Version MA Ribbon MT4 MA Ribbon is an enhanced indicator with 8 moving averages of increasing periods. MA Ribbon is useful to recognize trend direction, reversals and continuation points in the market as well as potential entry, partial take profit and exit points. Entry points for long and shorts position can be found when the price entries or leaves the Ribbon, at retest or a defined number of MA crossovers. It offers a good combination with mostly any volume or momentun indicators to f
25% off. Original price: $40 RSI Scanner is a multi symbol multi timeframe RSI dashboard that monitors Relative Strength Index indicator for price entering and exiting overbought and oversold in up to 28 symbols and 9 timeframes.
Download Demo here (Scans only M1 and M5) Settings description here MT5 version here
RSI Scanner features: Signals RSI entering and exiting the overbought and oversold zones. Monitors 28 customizable instruments and 9 timeframes at the same time. You can choose

This indicator includes various types of moving averages. The indicator contains the following set of moving averages: CA (Cumulative Moving Average) MIN (Minimum for the period) MAX (Maximum for the period) SMA (Simple Moving Average) EMA (Exponential Moving Average) DMA (Double exponential moving average) TMA (Triple exponential moving average) LWMA (Linear Weighted Moving Average) SMM (Simple Moving Median) SMMA (Smoothed Moving Average) HMA (Hull Moving Average) NoLagMa The list of moving av
FREE
Unlock High-Confidence Trading with Flash Signal! Tired of signals that appear too late or repaint? The Flash Signal: EMA-Stoch System indicator is engineered to deliver timely, filtered trade entries, transforming complicated market analysis into clear, actionable buy and sell arrows. Stop guessing and start trading with conviction! Key Advantages: Why You Need Flash Signal Filtered for Quality: This isn't just a simple EMA crossover. We combine the power of three Exponential Moving Averages (
FREE

Il comportamento di diverse coppie di valute è interconnesso. L'indicatore Visual Correlation consente di visualizzare diversi strumenti su 1 grafico mantenendo la scala. È possibile definire una correlazione positiva, negativa o nessuna correlazione.
Alcuni strumenti iniziano a muoversi prima di altri. Tali momenti possono essere determinati sovrapponendo grafici.
Per visualizzare uno strumento su un grafico, devi inserire il suo nome nel campo Simbolo. Version for MT5 https://www.mql5.com/
FREE

The volume weighted average price (VWAP) is a trading benchmark used by traders that gives the average price a security has traded at throughout the day, based on both volume and price. VWAP is calculated by adding up the dollars traded for every transaction (price multiplied by the number of shares traded) and then dividing by the total shares traded. You can see more of my publications here: https://www.mql5.com/en/users/joaquinmetayer/seller
FREE

White Crow Indicator
by VArmadA A simple yet powerful candle analysis based indicator using the White Soldiers & Crow patterns.
Works with timeframes 1H and higher and tested on all major pairs. Pay attention to the signal: An arrow indicating a long or short entry.
How It Works:
Arrows indicate a ongoing trend. After multiple bullish or bearish candles in a row the chances for another candle towards that trend is higher.
Instructions: - Crow Count: Set the number of candles that need to s
FREE
A LONG CANDLE SEARCH INDICATOR. This indicator will allow you to quickly find a candle that differs from others, namely its long one.
When the price moves out of the "flat" momentum, it indicates that the trend wants to change. So it's time to enter into a deal!
Keep in mind that not all arrows guarantee you an excellent entry point. Before opening a deal, make sure that the price has broken out of the flat. You can also resort to other indicators.
I'll show you good entry points in the scre
FREE

Индикатор сглаженного Stochastic Oscillator (xStoh)
Входные параметры: xK Period - K период xD Period - D период xSlowing - замедление xMethod - метод усреднения (0-SMA | 1-EMA | 2-SMMA | 3 - LWMA) xPrice field - тип цены (0 - Low/High | 1 - Close/Close) Принцип работы
Индикатор перерассчитывает стандартный технический индикатор Stochastic Oscillator (дважды усредняет получаемые значения iStochastic).
FREE

Dominate the Market with CCI Crossover Master! Stop guessing and start trading with confidence ! The CCI Crossover Master indicator is your secret weapon for capturing high-probability moves based on proven momentum and trend analysis. It simplifies the complex " CCI Crossover Master " strategy, giving you crystal-clear Buy and Sell signals directly on your chart. Key Advantages That Drive Your Success: Precision Entry Signals: Never miss a high-potential trade again. The indicator generates sh
FREE

A trend indicator showing the strength of bulls and bears in a trading range.
Consists of two lines:
The green line is a balanced overbought/oversold condition. The red line is the direction of trading activity. Does not redraw calculations.
Can be used on all Symbols/Instruments/Time Frames.
Easy to use and set up.
How to use the indicator and what it determines.
The basic rule is to follow the direction of the red line:
if it crosses the green line from the bottom up, the market is dominat
FREE

Sometimes a trader needs to know when a candle will close and a new one appears to make the right decisions, this indicator calculates and displays the remaining of current candle time . It is simple to use, just drag it on the chart. Please use and express your opinion, expressing your opinions will promote the products. To see other free products, please visit my page.
FREE

Bollinger Bands Breakout Alert is a simple indicator that can notify you when the price breaks out of the Bollinger Bands. You just need to set the parameters of the Bollinger Bands and how you want to be notified.
Parameters: Indicator Name - is used for reference to know where the notifications are from Bands Period - is the period to use to calculate the Bollinger Bands Bands Shift - is the shift to use to calculate the Bollinger Bands Bands Deviation - is the deviation to use to calculate t
FREE
Download the free USDJPY version here.
MACD Indicator The Moving Average Convergence and Divergence (MACD) is a trend following momentum indicator which shows the relationship between two moving averages that we chose and configure them on the indicator. The MACD is calculated by subtracting the 26-period exponential moving average and the 12 period D.A.M. These are the default parameters when you put the MACD indicator on the charts, and the period is usually 9 which means the last 9 candles

A simple and effective trend indicator. It will be a good assistant when trading. A minimum of understandable settings. Put it on a chart and set it up Good to combine with other indicators. I will post another trend indicator soon. The combination of these two indicators gives good results. Works on all timeframes. Suitable for any couple. Experiment, adjust, observe. Filter by higher timeframes.
FREE

This indicator displays each bar's volume in points as a histogram. The second version of the indicator. Now it is represented as an oscillator. It is more informative and functional. At that it does not load the main chart. GitHub It displays: bar's volume in points as a histogram (buffer 0) average value of the volume for the whole period (buffer 1) bars upper than the client average value with another color (buffer 2) average value of the amount of bars set by a user (buffer 3) Also: setting
FREE

Dopo 7 anni, ho deciso di rilasciare alcuni dei miei indicatori e EA gratuitamente.
Se li trovate utili, per favore Mostrate il vostro supporto con una valutazione a 5 stelle! Il vostro feedback mantiene in arrivo gli strumenti gratuiti! Vedi anche gli altri miei strumenti gratuiti qui
_________________________________ Indicatore di Larghezza delle Bande di Bollinger per l'Analisi Avanzata della Volatilità del Mercato L'Indicatore di Larghezza delle Bande di Bollinger, sviluppato
FREE

Unisciti al Canale Koala Trading Solution nella comunità MQL5 per scoprire gli ultimi segnali, le notizie su tutti i prodotti Koala. Il link per unirti è il seguente: https://www.mql5.com/en/channels/koalatradingsolution Descrizione:
siamo felici di presentare il nostro nuovo indicatore gratuito basato su uno degli indicatori professionali e popolari nel mercato forex (PSAR) questo indicatore è una nuova modifica sull'indicatore SAR parabolico originale, nell'indicatore pro SAR puoi vedere
FREE

MT5 Version Elliot Wave Oscillator MT4 Elliot Wave Oscillator MT4 is an indicator designed to support Elliot Wave counts. The default settings help filtering out the noise in the market allowing a clear perception for the waves counts in differnt timeframes. Elliot Wave Oscillator high customization level allows the you to optimize this indicator to your personal preferences. Shorter Periods and faster reactive MAs will provide more infomation but will require a higher level of experience for

The purpose of this new version of the MT4 standard indicator provided in your platform is to display in a sub-window multiple timeframes of the same indicator. See the example shown in the picture below. But the display isn’t like a simple MTF indicator. This is the real display of the indicator on its timeframe. Here's the options available in the FFx indicator: Select the timeframes to be displayed (M1 to Monthly) Define the width (number of bars) for each timeframe box Alert pop up/sound/ema
FREE

Simulator for Risk / Reward ratio calculator We-RiskReward is a MT4 indicator made by the We-Trading team to simulate an order with Risk / Reward calculator.
Horizontal Lines This indicator show you 3 horizontal lines that are: Open line Take Profit line Stop Loss line You can move the lines and you will see R/R and Lots calculation in real time. You can use it to simulate Long and Short positions.
Indicator parameters As input parameters you need to check only the Risk for trade. For e.g. you
FREE

Unlock Instant Pattern Recognition with Our Advanced Trading Indicator Are you looking to instantly spot key candlestick patterns like Engulfing, Doji, Marubozu, Harami, Hanging Man, Shooting Star, Evening Star, Hikkake, Dark Cloud Cover, or Black Crow as they form? With this powerful indicator, you can monitor all 28 currency pairs in real time and get instant alerts whenever one of these crucial patterns is detected. Key Features: Real-Time Alerts: Instantly know when any of the key candlestic
FREE

40% off. Original price: $50
Ichimoku Trend Finder is a multi symbol multi timeframe trend dashboard that helps traders to monitor and identify potential market trends from one chart. This panel scans the Ichimoku Kinko Hyo indicator in 28 configurable instruments and 9 timeframes for classic Ichimoku trend signals with a deep scan feature to scan all market watch symbols (up to 1000 instruments!).
Download Demo here (Scans only M1 and M5) Settings description here MT5 version here
Sai perché MetaTrader Market è il posto migliore per vendere strategie di trading e indicatori tecnici? Non c'è bisogno di pubblicità o di protezione del software, nessun problema di pagamento. Tutto ciò è fornito da MetaTrader Market.
Ti stai perdendo delle opportunità di trading:
- App di trading gratuite
- Oltre 8.000 segnali per il copy trading
- Notizie economiche per esplorare i mercati finanziari
Registrazione
Accedi
Se non hai un account, registrati
Consenti l'uso dei cookie per accedere al sito MQL5.com.
Abilita le impostazioni necessarie nel browser, altrimenti non sarà possibile accedere.