Camarilla Pivots Historical
- Indikatoren
- Version: 1.0

SIE KÖNNEN JETZT KOSTENLOSE VERSIONEN UNSERER KOSTENPFLICHTIGEN INDIKATOREN HERUNTERLADEN. ES IST UNSERE ART DER RÜCKGABE AN DIE GEMEINSCHAFT!
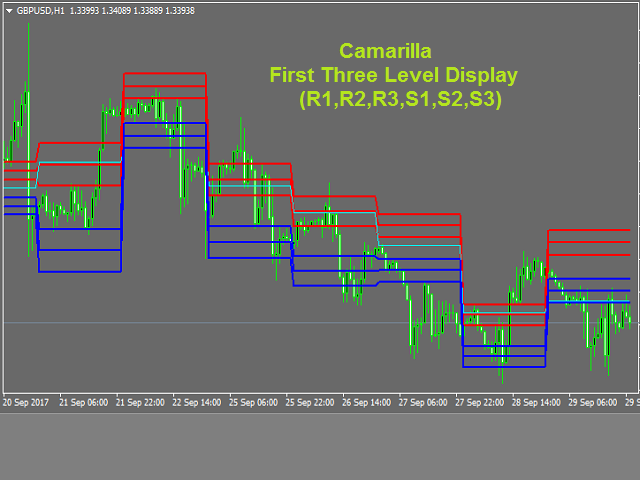
Camarilla Pivots Historical stellt die historischen Daten der Camarilla Pivot Levels auf dem Chart dar. Die Camarilla Pivot Levels wurden 1989 von Nick Scott entwickelt. Die Niveaus werden von Intraday-Händlern als primäre Unterstützungs- und Widerstandsniveaus verwendet. Die Levels werden mit der folgenden Formel berechnet:
- R4 = C + BEREICH * 1.1/2
- R3 = C + BEREICH * 1,1/4
- R2 = C + BEREICH * 1,1/6
- R1 = C + BEREICH * 1,1/12
- PP = (HOCH + TIEF + SCHLUSS) / 3
- S1 = C - BEREICH * 1,1/12
- S2 = C - BEREICH * 1,1/6
- S3 = C - BEREICH * 1,1/4
- S4 = C - BEREICH * 1,1/2
Abgesehen von der primären Unterstützung und dem Widerstand werden die Niveaus häufig für das Risikomanagement und den Intraday-Handel verwendet.
Risikomanagement
Wenn sich der Kurs den Niveaus S3 und R3 nähert, ist es in der Regel möglich, dass eine Umkehrung bevorsteht, so dass Händler in der Regel versuchen, ihre Handelspositionen auf diesen Niveaus zu beenden.
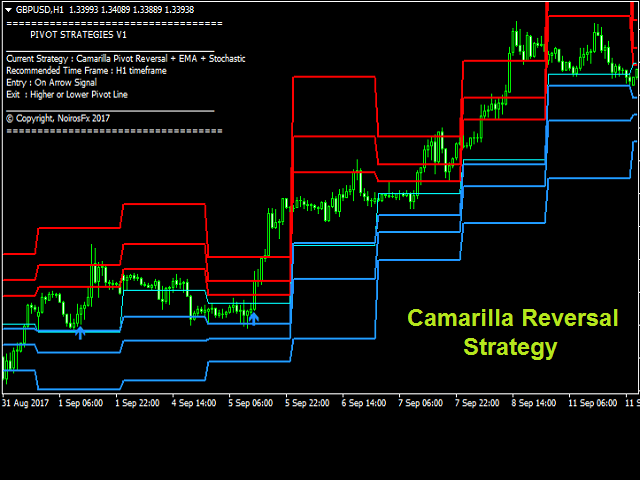
Handel mit Nockenumkehrungen
Da Händler bei den S3- und R3-Niveaus eine potenzielle Umkehr erwarten, können sie bei diesen Niveaus auch in die Umkehrrichtung handeln, wenn sie erreicht werden. So erwartet ein Daytrader bei einem S3-Niveau einen Kauf- und bei einem R3-Niveau einen Verkaufshandel.
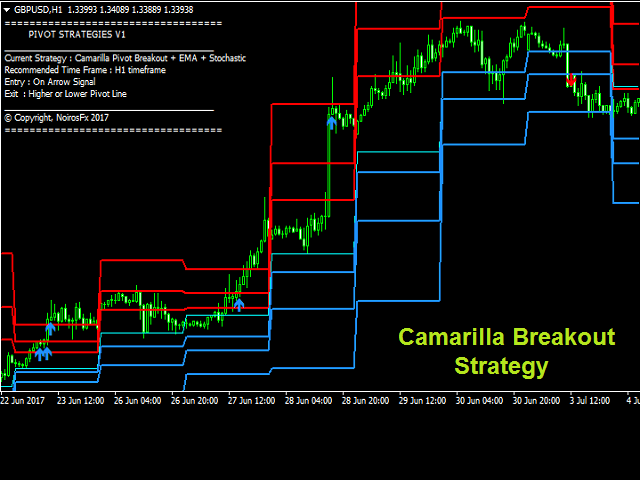
Handel mit Nockenausbrüchen
Wenn der Kurs die vierten Niveaus (R4 & S4) durchbricht, kann der Kurs eine neue Richtung einschlagen, so dass Händler auf diesen Niveaus nach möglichen Ausbruchssignalen suchen. Sie können also bei einem R4-Ausbruch einen Kaufhandel und bei einem S4-Ausbruch einen Verkaufshandel eingehen.
Eingabe
- GMT Zeitverschiebung: Verwenden Sie diese Option, um Ihre Plattformzeit für die Pivot-Linienberechnung zu synchronisieren.
- Anzuzeigende Levels: Sie können entweder die ersten drei Pivot-Levels (R1, R2, R3, S1, S2, S3) oder die letzten drei Pivot-Levels (R3, R4, R5, S3, S4, S5) anzeigen.
- Display Level Texts ?: Aktivieren/Deaktivieren der Pivot-Etiketten
- Widerstands-Textfarbe: Farbe des Widerstands-Labels
- Support Textfarbe: Support Label Farbe
Wir sind sozial
Treten Sie unserem Telegram Channel bei, um kostenlose tägliche Signale und schnelleren Support für unsere Produkte zu erhalten.
Außerdem erhalten Sie täglich Trading-Tipps, Nachrichten und Ratschläge.Folgen Sie uns bitte: Klicken Sie hier


very good